© 2015 N.A. Abu et al., This open access article is distributed under a Creative Commons Attribution (CC-BY) 3.0 license
doi:10.3844/jcssp.2015.351.360 Published Online 11 (2) 2015 (http://www.thescipub.com/jcs.toc
Corresponding Author: Nur Azman Abu, Department of System and Computer Communication, Faculty of Information and Communication Technology, Universiti Teknikal Malaysia Melaka, Melaka 76100, Malaysia
JCS
SMOOTH FORMANT PEAK VIA DISCRETE TCHEBICHEF
TRANSFORM
1
Nur Azman Abu,
1,2Ferda Ernawan and
3Fadzilah Salim
1Department of System and Computer Communication, Faculty of Information and Communication Technology,
Universiti Teknikal Malaysia Melaka, Melaka 76100, Malaysia
2Department of Information Technology, Faculty of Computer Science,
Universitas Dian Nuswantoro, Semarang 50131, Indonesia
3
Department of Electrical Engineering Technology, Faculty of Engineering Technology, Universiti Teknikal Malaysia Melaka, Melaka 76100, Malaysia
Received 2013-02-13; Revised 2014-06-02; Accepted 2014-09-09
ABSTRACT
With the growth in computing power, speech recognition carries a strong potential in the near future. It has even become increasingly popular with the development of mobile devices. Presumably, mobile devices have limited computational power, memory size and battery life. In general, speech recognition operation requires heavy computation due to large samples per window used. Fast Fourier Transfom (FFT) is the most popular transform to search for formant frequencies in speech recognition. In addition, FFT operates in complex fields with imaginary numbers. This paper proposes an approach based on Discrete Tchebichef Transform (DTT) as a possible alternative to FFT in searching for the formant frequencies. The experimental outputs in terms of the frequency formants using FFT and DTT have been compared. Interestingly, the experimental results show that both have produced relatively identical formant shape output in terms of basic vowels and consonants recognition. DTT has the same capability to recognize speech formants F1, F2, F3 on real domains.
Keywords: Formant Estimation, Discrete Tchebichef Transform, Spectrum Analysis, Fast Fourier
Transform, Orthogonal Transform Function
1. INTRODUCTION
Speech recognition systems have become one of the useful applications for pattern recognition, machine learning, computer-assisted translation and mobile devices. Speech is a natural source of interface for human machine communication (Erzin, 2009). Formant frequency is a significant parameter to interpret linguistic as well as non-linguistic speech word (Tomas and Obad, 2009). Formant frequency is an important element speech feature and rich source of information of the uttered word in speech recognition. The formant is associated with the free resonance of the vocal-tract system (Fattah et al., 2009).
A detection of the formant frequencies via Fast Fourier Transform (FFT) is one of the fundamental operations in speech recognition. The FFT is often used to compute numerical approximations to continuous Fourier transform. However, a straightforward application of the FFT often requires a large window to be performed even though most of the input data to the FFT may be zero. FFT algorithm is a computationally complex which requires operating on an imaginary domain. It is a complex exponential function that defines a complex sinusoidal function.
unlike continuous orthonormal transforms (Ernawan et al., 2011a). At the same time, DTT does not involve any numerical approximation on a computationally friendly domain. The Tchebichef polynomials have unit weight and algebraic recurrence relations involving real coefficients. These factors in effect make DTT suitable for transforming the speech signal from time domain into frequency domain. In the previous work, DTT has been applied in audio processing and image processing applications. For example, DTT has been used in speech recognition (Ernawan et al., 2012a), image projection, image super resolution (Abu et al., 2009), image dithering (Ernawan et al., 2012b) and image compression (Ernawan et al., 2011b; 2013a; Abu et al., 2010).
2. MATERIAL AND METHODS
The input sounds of five vowels and five consonants being used here in this paper are coming from male voices at a sampling rate of 11 KHz per second from the International Phonetic Alphabet. A sample sound of the vowel ‘O’ is shown in Fig. 1. This section provides a brief overview on the existing of mathematical transforms, namely, Fast Fourier Transform (FFT) and Discrete Tchebichef Transform (DTT).
2.1. Fast Fourier Transform
The standard spectrum analysis method for speech analysis is the FFT (Saeidi et al., 2010). FFT is a simple class of special algorithm that perform Discrete Fourier Transform (DFT) with considerable savings in computational time. FFT is applied to convert time domain signals into frequency domains on the speech signals. The FFT takes advantage of the symmetry and periodic properties of the Fourier transform to reduce the computational time. In this process, the transform is partitioned into a sequence of reduced-length transforms that are collectively performed with reduced computation. FFT is much faster for large values of N, discrete orthonormal Tchebichef moments appear to provide a much better support than continuous orthogonal moments (Ernawan et al., 2013b). The discrete orthonormal Tchebichef polynomials are more stable especially whenever Tchebichef polynomials of
large degree are required to be evaluated. Speech recognition requires large samples of data in speech signal processing. To avoid such problems, the orthonormal Tchebichef polynomials use the set recurrence relation to approximate the speech signals. For a given positive integer N (the vector size) and a value n in the range [1, N-1], the orthonormal version of the one dimensional Tchebichef function is given by the following recurrence relations {tk} of moment order k in polynomials tk(n) (Jassim and Paramesran, 2009):
1 2 3 obtained from the following Equations:
0
2
( 1)( 1)
( )
n n N
n N n
γ = + − −
− (11)
The forward discrete Tchebichef transform of order N is defined in Equation 12 as follows:
1
0
( ) ( ) ( )k
n
X k x n t n
=
=
∑
N
-(12)
For k = 0,1,…, N-1. The X(k) denotes the coefficient of orthonormal Tchebichef polynomials.
The inverse discrete Tchebichef transform is given in Equation 13 by:
1
0
( ) ( ) ( )
N
k k
x n X k t n
−
=
=
∑
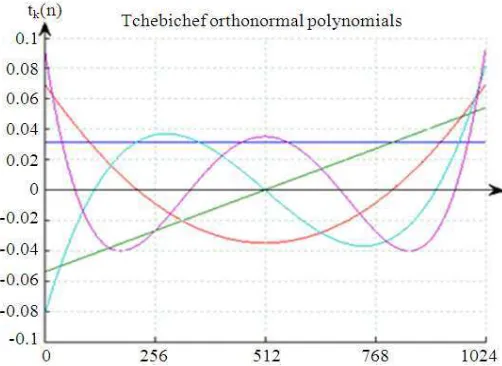
(13)For n = 0,1,…,N-1. The Tchebichef transform involves only algebraic expressions and it can be computed easily using a set of recurrence relations in Equations 1-11 above. The first five discrete orthonormal Tchebichef polynomials are shown in Fig. 2.
Fig. 1. The sample sound of the vowel ‘O’
3. RESULTS
This section presents a step-by-step process on the speech recognition algorithm. This section also explores the experimental results on each step of the speech recognition. The speech recognition involves silence detector, pre-emphasis, speech signal windowed, power spetral density and autoregressive model.
3.1. Silence Detector
Speech signals are highly redundant and typically contain a variety of background noise (Dalen and Gales, 2011). Unfortunate effect from the background noise has a severe impact on the performance of speech recognition system. By removing the silence part, the speech sound can provide useful information of each utterance. Certain level of the background noise interfere with the speech. At the same time, silence regions have quite a high zero-crossings rate as the signal changes from one side of the zero amplitude to the other and back again. For this reason, the threshold is included in order to remove any zero-crossings. In this experiment, the threshold is set to be 0.1. This means that any zero-crossings that start and end within the range of tα, where -0.1<tα<0.1, are not included in the total number of zero-crossings in that window.
3.2. Pre-Emphasis
Pre-emphasis is a technique used in speech processing to enhance high frequency signals. It reduces the high spectral dynamic range. The use of pre-emphasis is to flatten the spectrum consisting of formants of similar heights. Pre-emphasis is implemented as a first-order Finite Impulse Response (FIR) filter which is defined in Equation 14 as follows:
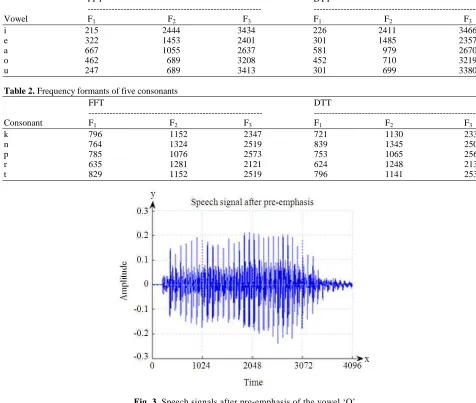
= ( ) - [ -1] N-1, where N is the sample size which represents speech signal. The speech signals after pre-emphasis of the vowel ‘O’ is shown in Fig. 3.
3.3. Speech Signal Windowed
Speech recognition consumes a heavy process that requires large samples of data which represent speech signal for each frame. FFT is calculated on a window of speech frame (Mahmood et al., 2012). A windowing
function is used on each frame to smooth the signals and make it more amendable for spectral analysis. Hamming window is a window function used commonly in speech analysis to reduce the sudden changes and undesirable frequencies occurring in the framed speech. Hamming window is defined in Equation 15 as follows:
2 with values 0≤k≤L-1. The resulting windowed segment is defined in Equation 16 as follows:
( ) n ( )
x k =S ⋅w k (16)
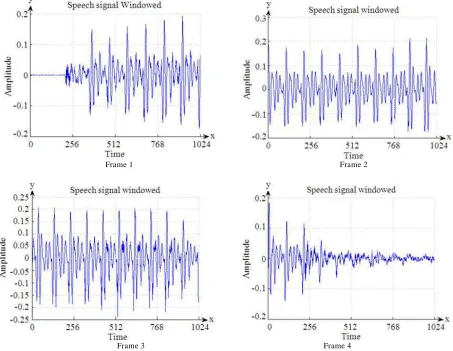
where, Sn is the signal function and w(k) is the window function on FFT. Whereas, DTT consists of only algebraic expressions and the Tchebichef polynomial matrix can be constructed easily using a set of recurrence relations. Therefore the window is very inefficient when the sample data are multiplied by a value that is close to zero. Any transition occurring during this part of the window will be lost so that the spectrum is no longer true real time. Speech recognition using DTT does not use windowing function. In this paper, a sample speech signal has been windowed into 4 frames as illustrated in Fig. 4.
Each window consists of 1024 sample data which represents speech signal. This blocking assumes that the signals are stationary within each frame. The windowed signal is then transformed into spectral domain, giving good discrimination and energy compaction. In this experiment, the third frame for 2049-3072 sample data is used. The speech signals using FFT of the vowel ‘O’ are shown in Fig. 5. The speech signals using DTT of the vowel ‘O’ are shown in Fig. 6.
3.4. DTT Coefficient
Consider the discrete orthonormal Tchebichef polynomials definition in 1-12 above, the set of coefficients on discrete Tchebichef transform is given in Equation 17 and 18. A set of kernel matrix 1024 of Tchebichef polynomials are computed with speech signal on each window. The coefficients of DTT of order n = 1024 sample data for each window are given using the formula as follows:
0 0 0 0 0 0 a matrix computation of discrete orthonormal Tchebichef polynomials tk (n) for k = 0,1,…., N-1. S is the sample of speech signal window which is given by x0, x1, x2, …, x(n-1). The coefficient of DTT is given in Equation 19 as follows:
-1
C = T S (19)
Next, speech signal on frame 3 is computed with 1024 discrete orthono1rmal Tchebichef polynomials.
3.5. Spectrum Analysis
The spectrum analysis using FFT can be generated in Equation 20 as follows:
2
( ) ( )
p k = c n (20)
The spectrum analysis using FFT of the vowel ‘O’ is shown in Fig. 7. The spectrum analysis using DTT can be defined in Equation 21 and 22 as follows:
2
where, c(n) is the coefficient of DTT, x(n) is the sample data at time index n and tk(n) is the computation matrix of orthonormal Tchebichef polynomials. The spectrum analysis using DTT of the vowel ‘O’ is shown in Fig. 8.
3.6. Power Spectral Density
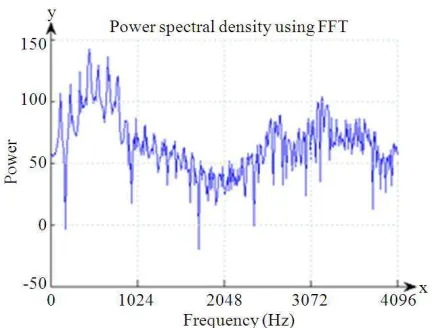
Power Spectral Density (PSD) shows the strength of the variations (energy) as a function of frequency. In other words, it shows the frequencies at which variations are strong and at which frequency variations are weak. The one-sided power spectral density using FFT can be computed in Equation 23 as follows:
2
where, X(k) is a vector of N values at frequency index k, the factor 2 is called for here in order to include the contributions from positive and negative frequencies. The result is precisely the average power of spectrum in the time range (t1, t2). The power spectral density in (23) and (24) are plotted on a decibel (dB) scale of 20log10. The power spectral density using FFT for vowel ‘O’ on frame 3 is shown in Fig. 9. The power spectral density using DTT can be generated in Equation 24 as follows: estimate of the signal’s power spectrum. Autoregressive model is used to determine the characteristics of the
3.8. Frequency Formants
The uniqueness of each vowel is measured by formants. The resonance frequencies known as formant can be detected as the peaks of the magnitude spectrum of speech signals. Formants are defined as the resonance frequencies of the vocal tract which are formed by the shape of vocal tract (Ozkan et al., 2009).
A formant is a characteristic resonant region (peak) in the power spectral density of a sound. Next, the frequency formants shall be detected. The formants of the autoregressive curve are found at the peaks using a numerical derivative. These vector positions of the
formants are used to characterize a particular vowel. The first two formants (F1, F2) of a vowel utterance cue the phonemic identity of the vowel (Patil et al., 2010). The third formant F3 is also important for vowel categorisation (Kiefte et al., 2010). However, it is frequently excluded from vowel plots overshadowed by the first two formant.
The frequency peak formants of the experiment result F1, F2 and F3 are compared to referenced formants to decide on the output of the vowel. The frequency formants of the five vowels and the five consonants using FFT and DTT on frame 3 are as shown in Table 1 and 2 respectively.
Table 1. Frequency formants of five vowels
FFT DTT
--- ---
Vowel F1 F2 F3 F1 F2 F3
i 215 2444 3434 226 2411 3466
e 322 1453 2401 301 1485 2357
a 667 1055 2637 581 979 2670
o 462 689 3208 452 710 3219
u 247 689 3413 301 699 3380
Table 2. Frequency formants of five consonants
FFT DTT
--- ---
Consonant F1 F2 F3 F1 F2 F3
k 796 1152 2347 721 1130 2336
n 764 1324 2519 839 1345 2508
p 785 1076 2573 753 1065 2562
r 635 1281 2121 624 1248 2131
t 829 1152 2519 796 1141 2530
Frame 1 Frame 2
Frame 3 Frame 4
Fig. 4. Speech signal windowed into four frames
Fig. 5. Imaginary part of FFT for speech signal of vowel ‘O’ on frame 3
Fig. 7. Imaginary part of FFT for spectrum analysis of the vowel ‘O’ on frame 3
Fig. 8. Coefficient of DTT for spectrum analysis of the vowel ‘O’ on frame 3
Fig. 9. Power Spectral Density using FFT for vowel ‘O’ on frame 3
Fig. 10. Power spectral density using DTT for vowel ‘O’ on frame 3
Fig. 11. Autoregressive using FFT for vowel ‘O’ on frame 3
4. DISCUSSION
In the sample above, the experimental result are presented on how the vowels and consonants are recognized. The experimental result on speech recognition using FFT and DTT is compared and analyzed. Speech signals of the vowel ‘O’ using FFT as in Fig. 5 produce a speech signal that is clearer compared to the DTT. On the other hand, the speech signals of the vowel ‘O’ and consonant ‘RA’ using DTT as presented in Fig. 6 produce more noise.
Next, spectrum analysis of the vowel ‘O’ using FFT as in Fig. 7 produces a lower power spectrum than DTT. On one hand, spectrum analysis using DTT as in Fig. 8 has a higher power spectrum than FFT. It is also capable of capturing the fourth formant for consonant ‘RA’. Spectrum analysis using DTT produces four formants F1, F2, F3 and F4 concurrently in spectrum analysis for a consonant. The power spectral density of vowel ‘O’ using FFT as in Fig. 9 shows that the power spectrum is higher than power spectral density using DTT. Next, the power spectral density using DTT in Fig. 10 produce more noise than FFT in frequency spectrum.
According to the observation as presented in Fig. 11 and
12, the peaks of first frequency formant (F1), second frequency formant (F2) and third frequency formant (F3) using FFT and DTT respectively appear to produce identically quite similar output. Based on the result of the experiment as presented in Table 1 and 2, the result of frequency formants of speech recognition using FFT and DTT for five vowels and five consonants respectively is nearly equally similar.
The result showed that the peaks of five vowels and five consonants using DTT are identically similar to FFT in terms of vowel and consonant recognition. DTT is able to capture all three formants concurrently, F1, F2 and F3. The frequency formants using FFT and DTT are compared and it is evident that they have produced relatively identical outputs in terms of speech recognition. DTT indeed has the potential to perform well in terms of basic vowel and consonant recognition.
5. CONCLUSION
Speech recognition using FFT has been a popular form of transform over the last decades. Alternatively, this paper introduces DTT on speech recognition. As a discrete orthonormal transform, DTT produces a simpler and more computationally efficient transform than FFT. On the one hand, FFT is computationally more complex dealing with imaginary numbers but DTT on the other hand
consumes simpler computation on real rational numbers only. Therefore, DTT operates on friendly domain which involves only algebraic expressions and it can be computed easily using a set of recurrence relations. It is ideal for discrete transform in speech recognition to transform from the time domain into the frequency domain. The autoregressive model using FFT and DTT produces the smoother similar shape. DTT has proven to perform better in a smaller frame size in the recognition of vowels and consonants.
Furthermore, speech recognition using DTT can be extended in the future in terms of time complexity. On one hand, FFT algorithm produces the time complexity O (nlog n). Next, the computation time of DTT produces time complexity O(n2). For future research, DTT can be efficiently improved to reduce the time complexity from O(n2) to be O(nlog n) using convolution algorithm. DTT is capable of increasing the speech recognition performance and at the same time getting the similar frequency formants in terms of speech recognition.
6. ACKNOWLEDGEMENT
The researchers would like to express a very special thanks to Ministry of Education, Malaysia for providing financial support for this research project by
Fundamental Research Grant Scheme
(FRGS/2012/FTMK/SG05/03/1/F00141).
7. REFERENCES
Abu, N.A., W.S. Lang and S. Sahib, 2009. Image super-resolution via discrete Tchebichef moment. Proceedings of International Conference on Computer Technology and Development, Nov. 13-15, IEEE Xplore Press, Kota Kinabalu, pp: 315-319. DOI:10.1109/ICCTD.2009.61
Abu, N.A., S.L. Wong, N.S. Herman and R. Mukundan, 2010. An efficient compact Tchebichef moment for image compression. Proccedings of the 10th International Conference on Information Science Signal Processing and their Applications, May 10-13, IEEE Xplore Press, Kuala Lumpur, pp: 448-451. DOI: 10.1109/ISSPA.2010.5605448
Ernawan, F., E. Noersasongko and N.A. Abu, 2011a. Fast dynamic speech recognition via discrete Tchebichef transform. Proccedings of the International Conference on Informatics and Computational Intelligence, Dec. 12-14, IEEE Xplore Press, Bandung, pp: 250-255. 10.1109/ICI.2011.48
Ernawan, F., E. Noersasongko and N.A. Abu, 2011b. An efficient 2×2 Tchebichef moments for mobile image compression. Proceedings of the International Symposium on Intelligent Signal Processing and Communication System, Dec. 7-9, IEEE Xplore
Press, Chiang Mai, pp: 001-005.
DOI:10.1109/ISPACS.2011.6146066
Ernawan, F., E. Noersasongko and N.A. Abu, 2012a. Using discrete Tchebichef transform on speech recognition. Proccedings of the 4th International Conference on Machine Vision, Dec. 9-10, IEEE Xplore Press, Singapore, 8350: pp:83501-83501. DOI: 10.1117/12.920206
Ernawan, F., N.A. Abu and H. Rahmalan, 2012b. Tchebichef moment transform on image dithering for mobile applications. Proceedings of the 4th International Conference on Digital Image Processing, Apr. 7-8, SPIE, Kuala Lumpur, pp: 1-5. DOI: 10.1117/12.946023
Ernawan, F., N.A. Abu and N. Suryana, 2013a. Adaptive Tchebichef moment transform image compression using psychovisual model. J. Comput. Sci., 9: 716-725. DOI: 10.3844/jcssp.2013.716.725
Ernawan, F., N.A. Abu and N. Suryana, 2013b. The efficient discrete Tchebichef transform for spectrum analysis of speech recognition. Proceedings of the International Conference on Graphic and Image Processing, Oct. 5-7, SPIE Digital Library, Singapore, pp: 1-7. DOI: 10.1117/12.2010642 Erzin, E., 2009. Improving throat microphone speech
recognition by joint analysis of throat and acoustic microphone recordings. IEEE Trans. Audio, Speech Language Process., 17: 1316-1324. DOI: 10.1109/TASL.2009.2016733
Fattah, S.A., W.P. Zhu and M.O. Ahmad, 2009. A time-frequency domain formant time-frequency estimation scheme for noisy speech signals. Proceedings of the International Symposium on Circuits and Systems, May 24-27, IEEE Xplore Press, Taipei, pp: 1201-1204. DOI: 10.1109/ISCAS.2009.5117977
Hsu, H.W. and Liu, C.M, 2010. Autoregressive modeling of temporal/spectral envelopes with finite-length discrete trigonometric transforms. IEEE Trans. Signal Process., 58: 3692-3705. DOI: 10.1109/TSP.2010.2047105
Jassim, W.A. and R. Paramesran, 2009. Speech signals representation by discrete transforms. Proceedings of the International Conference for Technical Postgraduates, Dec. 14-15, IEEE Xplore Press,
Kuala Lumpur, pp: 1-5. DOI:
10.1109/TECHPOS.2009.5412082
Kiefte, M., T. Enright and L. Marshall, 2010. The role of formant amplitude in the perception of /i/ and /u/. J. Acoustical Society Am., 127: 2611-2621. DOI: 10.1121/1.3353124
Mahmood, A., M. Alsulaiman and G. Muhammad, 2012. Multidirectional local feature for speaker recognition. Proceedings of the 3rd International Conference on Intelligent Systems Modelling and Simulation, Feb. 8-10, IEEE Xplore Press, Kota Kinabalu, pp: 308-311. DOI: 10.1109/ISMS.2012.45 Ozkan, E., I.Y. Ozbek and M. Demirekler, 2009. Dynamic speech spectrum representation and tracking variable number of vocal tract resonance frequencies with time-varying dirichlet process mixture models. IEEE Trans. Audio Speech Language Process., 17: 1518-1532. DOI: 10.1109/TASL.2009.2022198
Patil, A., C. Gupta and P. Rao, 2010. Evaluating vowel pronunciation quality: Formant space matching versus asr confidence scoring. Proccedings of the National Conference on Communication, Jan. 29-31, IEEE Xplore Press, Chennai, pp: 1-5. DOI: 10.1109/NCC.2010.5430187
Saeidi, R., J. Pohjalainen, T. Kinnunen and P. Alku, 2010. Temporally weighted linear prediction features for tackling additive noise in speaker verification. IEEE Signal Process. Lett., 17: 599-602. DOI: 10.1109/LSP.2010.2048649
Sukumar, A.R., A.S. Sukumar, A.F. Shah and B.P. Anto, 2010. Key-word based query recognition in a speech corpus by using artificial neural networks. Proceedings of the 2nd International Conference on Computational Intelligence, Communication Systems and Networks, Jul. 28-30, IEEE Xplore Xpress, Liverpool, pp: 33-36. DOI: 10.1109/CICSyN.2010.56