Gadjah Mada International Journal of Business January-April 2010, Vol. 12, No. 1, pp. 1–30
Cynthia A. Utama
Faculty of Economics University of IndonesiaSanti Rahmawati
Faculty of Economics University of Indonesia
This study aims to investigate whether: (1) the change in debt level is affected by agency problems, the probability of bankruptcy, firm size, and profitability; (2) the change in debt level is affected by multinationality (i.e., multinational corpora-tions (MNCs) or domestic corporacorpora-tions (DCs)) and whether multinationality affects the relationship of agency problems, probability of bankruptcy, size, and profitability to the change in debt level. This study finds that in general, the change in debt level is negatively affected by the probability of bankruptcy and size. Furthermore, the changes in debt level for Indonesian MNCs are negatively affected by the probability of bankruptcy, firm size, and profitability. The negative effects of size and profitability on the change in debt level support the view of the Pecking Order Theory. However, for domestic companies, none of the determinants has a significant effect on the change in debt level. We also find that: (1) only size has a negative influence on the change in debt level when we include all interactive terms in the model; (2) if we include one interactive variable at a time, the probability of bankruptcy, firm size, and profitability have
THE INFLUENCE OF MULTINATIONALITY
ON DETERMINANTS OF CHANGE
IN DEBT LEVEL
Keywords: capital structure; Indonesia leverage; multinational corporations
JEL Classification: G15, G32
negative influences on the change in debt level; in addition, a positive impact of agency problems on the change in debt level is more pronounced for MNCs compared to DCs. Overall, we conclude that multinationality affects the relationship between agency problems and the change in debt level.
Introduction
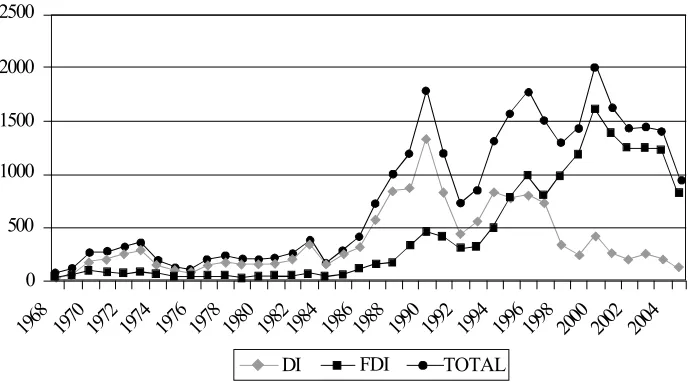
Globalization induces multinational firms (henceforth MNCs) to conduct foreign direct investments (FDIs) in developing countries such as Cambo-dia, Indonesia, Laos, Malaysia, Philip-pines, Thailand, and Vietnam. Econo-mists consider an FDI to be a major driving force for economic growth. It contributes to national economic mea-sures, such as Gross Domestic Prod-uct (GDP), Gross Fixed Capital For-mation (total investment in a host economy), and balance of payments (Nugroho and DTE 2006). They also argue that an FDI promote develop-ment since it could provide sources of new technologies, processes, products, organizational systems, and manage-ment skills to the host country or firms that receive the investment. Further-more, it may provide a company with new markets and marketing channels, cheaper production facilities, and an access to new technologies, products, skills and financing.
According to the Investment Co-ordinating Board, the net value of FDIs
Table 1. The Net Values of Foreign Direct Investment Flows to Indonesia during Years 1990-2004 (in Million USD)
Year Value
1998 -0.356
1999 -2.745
2000 -4.550
2001 -2.978
2002 0.145
2003 -0.597
2004 0.423
Year Value
1990 1.093
1991 1.482
1992 1.777
1993 2.004
1994 2.109
1995 4.346
1996 6.194
1997 4.667
Source: Bank Indonesia (The Indonesia Central Bank) : Indonesia Financial Statistics, several sequential publication until February 2005, in Tambunan (2006).
Note: The Foreign Direct Investment Inflow including Privatization of State-Owned Enterprise to foreign parties and bank restructuring, mainly the selling of bank assets to foreign investor.
Figure 1.The Growth of Total Foreign Direct Investment Projects and Total Domestic Investment Projects Approved by the Indone-sian Investment Coordinating Board
Source: Badan Koordinasi Penanaman Modal or BKPM (2004) in Tambunan (2006) 0
500 1000 1500 2000 2500
1968 1970 1972 1974 1976 1978 1980 19821984 19861988 1990 1992 1994 19961998 2000 2002 2004
Michael and Shaked (1986) de-fine MNC as a firm with foreign sales of at least 20 percent of its total income, and that invests its capital at least in six countries. In general, the business ac-tivities of an MNC are coordinated by a holding firm located in its country of origin (Yuliati and Prasetyo 1998). Eiteman et al. (2007) argue that MNCs should be able to maintain the optimal debt ratio to finance their operations due to their abilities to undertake inter-national diversification. However, some factors, such as agency problems, the possibility of bankruptcy, profitability and firm size, could also affect the debt levels of MNCs.
Burgman (1996) finds that the agency problems of MNCs are higher than those of DCs, thereby reducing their leverage. MNCs have larger au-dit costs, higher cultural differences, higher political risks, and different ac-counting systems. Consequently, in-vestors are faced with high asymmet-ric information and agency costs. As a result, the agency problems are strengthened in MNCs compared to in DCs.
Furthermore, in contrast to DCs which operate in a single country, MNCs are affiliated with other firms in differ-ent countries. This has created an op-portunity for the MNCs to reduce the bankruptcy risk on account of their abilities to diversify their businesses. Therefore, the lower bankruptcy risk should reduce the cost of debt and increase the capability of debt pay-ment. Hence, the likelihood of MNCs’ bankruptcies has a negative influence
on the debt financing (Doukas and Pantzalis 1997).
Other factors that are found to influence the capital structure decision are firm size and profitability (Rajan and Zingales 1995). Firms with larger size have more asymmetric informa-tion, so they will bear higher cost of debt when they seek the debt financing through the capital markets. The size of MNCs is expected to be larger than that of DCs; accordingly, the leverage of MNCs is estimated to be lower than that of DCs.
On the other hand, Copeland, Weston, and Shastri (2005) and Fama and French (2002) find that higher corporate profits cause firms to rely more on retained earnings than debt to finance their investment activities. Therefore, MNCs with higher profit-ability would be able to rely on retained earnings instead of debt.
Based on the discussion above, this study aims at answering the fol-lowing questions:
1) Is there any influence of agency problems, the probability of bank-ruptcy, firm size, and profitability on the change in debt level?
2) Is there any effect of multinationality (i.e., MNCs or DCs) on the rela-tionship between agency problems, the probability of bankruptcy, firm size, profitability, and the change in debt level?
designs, including sample selection and data collection. Section 4 provides empirical tests, and section 5 discusses our conclusion.
Theoretical Framework and
Hypotheses Development
The Influences of Agency
Problems, the Probability of
Bankruptcy, Firm Size, and
Profitability on the Change in
Debt Level
Easterbrook (1984) and Jensen (1986) state that excess free cash flows2 raise the conflict of interests between stockholders and managers. Managers tend to invest excess funds below the cost of capital or spend them for personal gains, such as manage-ment perks, rather than distribute them as dividends to stockholders. Thus, higher free cash flows are positively associated with more severe agency problems, as manifested by the conflict of interests between the principal (stockholders) and the agent (manag-ers).
Jensen and Meckling (1976, 1986, 1989); Stulz (1990); Maloney et al. (1993) explain that debt can be used to reduce the conflict of interests be-tween stockholders and management. In other words, the debt also provides management disciplines (Rubin 1990). The periodic payment of interest and (e.g., Tahirman 2000; Purba 2001; and
Permana 2005). On the other hand, empirical studies in international set-tings which examine the debt levels of MNCs are numerous (e.g., Michael and Shaked 1986; Lee and Kwok 1988; Burgman 1996; and Chkir and Chosset 2001). In Indonesia, these studies are relatively rare (e.g., Kusuma 1999; Vera et al. 2005). In contrast to previ-ous research in Indonesia, this study: (1) investigates the determinants of changes in debt levels of MNCs com-pared to those of DCs; (2) directly compares the differences in the deter-minants of changes in debt levels be-tween MNCs and DCs in a single regression model with an interaction variable, which acknowledges the in-fluence of multinationality on the rela-tionship between the determinant fac-tors (i.e., agency problems, the prob-ability of bankruptcy, firm size, and profitability) and the change in debt level; (3) has two objectives, i.e., to investigate the determinant factors of the change in debt level without consid-ering multinationality and to investigate the change in debt level after taking multinationality into account. There-fore, the contribution of this research is to extend the scope of previous studies in determining the change in debt level in Indonesia based on multinationality. The paper is organized as follows. In section 2, we provide theoretical framework and develop hypotheses. In section 3, we elaborate on research
2 Excess free cash flows are cash flows in excess of that required to fund all projects that have
principal of debt should limit the flex-ibility of management to use free cash flows for self-interested behavior (Con-trol Hypothesis). Furthermore, default on the interest payment can result in management losing their jobs (Threat Hypothesis).
Several empirical studies corrobo-rate the self-interested behavior of managers in making capital structure decisions to avoid the disciplinary roles of debt, for instances, increasing management’s shareholding tends to reduce debt to equity ratio (Friend et al. 1988), or entrenched CEOs make ef-forts to stay away from debt, and gearing ratios remain lower in the ab-sence of demand from owners (Berger et al. 1997). Accordingly, debt reduces the agency cost of free cash flows by reducing the cash flows available for spending at the discretion of managers (Stulz 1990; Harris and Raviv 1991; and Doukas and Pantzalis 2003).
Hence, greater agency problems will encourage firms to increase the use of debt to control for potential conflict of interests between share-holders and managers.
HI.1: Agency problems are posi-tively related to the change in debt level.
Altman (1968), Douglas and Finnerty (1997), and Akhtar and Oliver (2009) find that the probability of bank-ruptcy has a negative influence on the change in debt level. A firm that has a high level of possibility of bankruptcy would be difficult to get financing from debt as its cash flows are deemed not
sufficient to pay the interest and princi-pal of debt. In the trade-off theory, capital structure decisions of firms de-pend on benefits and costs of using more debt. Less debt is used if the cost of bankruptcy is higher than the tax shield benefit or other benefits from using more debt (Kim and Sorensen 1986; Graham 2000). Therefore, firms with a high likelihood of bankruptcy will reduce the use of debt.
HI.2: The possibility of bankruptcy is negatively related to the change in debt level
Rajan and Zingales (1995) state that there is a negative relationship between debt and firm size since infor-mational asymmetries among insiders in a firm and the capital markets are lower for large firms. So, large firms should be more capable of issuing informationally sensitive securities like equity, thereby having lower debt. Con-sequently, a large firm will rely on retained earnings to finance its invest-ment activities; when it raises external financing, it will prefer equity rather than debt (Graham 2000; Tong and Green 2005). In other words, the in-crease in firm size will induce the firm to rely more on retained earnings or equity issuance and to reduce the use of debt.
markets requires high disclosure and transparency of information due to the existence of asymmetric information (Myers and Majluf 1984). This implies that profitable firms will retain earnings and become less levered whereas un-profitable firms will borrow and be-come more levered, thus creating a negative relation between profitability and the probability that external financ-ing is raised. This argument is also supported by Rajan and Zingales (1995), Shyam-Sunder and Myers (1999), and Fama and French (2002), who find that profitability is negatively related to debt ratio. Thus, an increase in profitability will cause a firm to rely more on re-tained earnings, and consequently the use of debt will be lower.
HI.4: Profitability is negatively re-lated to the change in debt level.
The Influence of
Multinationality on the
Relationship of Agency
Problems, the Probability of
Bankruptcy, Firm Size, and
Profitability to the Change in
Debt Level
In this section, the first four hy-potheses are not different from those developed in the previous section. This section focuses on the influence of multinationality on the relationship of agency problems, the possibility of bankruptcy, profitability, and firm size to the change in debt level.
As mentioned earlier, MNCs with
operations in many countries have vari-ous advantages, such as international diversification. MNCs can reduce the cost of capital and are more resilient to face an unfavorable change in a coun-try since the sources of their operating cash flows are not concentrated only in one country (Eiteman et al. 2007). Sing and Nejadmalayeri (2004) find that international diversification is positively associated with higher leverage for the sample of French corporations. Mean-while, Mittoo and Zhang (2008) pro-vide epro-vidence that Canadian MNCs have higher leverage relative to Cana-dian DCs. This is also substantiated by Vera et al. (2005), who find that MNCs have more debt than do DCs. Thus, MNCs should experience a higher change in debt level compared to DCs due to their relatively lower cash flow volatility and easier access to interna-tional capital markets.
HII.5: The change in debt level for MNCs is higher than that for DCs.
since they are more difficult to monitor due to increased complexity and geo-graphic diversity (Aggarwal and Kyaw 2010). Consequently, because the agency problems of MNCs are ex-pected to be higher than those of DCs, a higher debt level will be needed to mitigate the agency problems (Jensen and Meckling 1976, 1986, 1989; Stulz 1990; Maloney et al. 1993; Rubin 1990). Therefore, we expect that the positive relation between agency problems and the change in debt level is stronger for MNCs than DCs.
HII.6: The positive relation between agency problems and the change in debt level is more pronounced for MNCs com-pared to DCs.
The possibility of bankruptcy of MNCs is expected to be lower than that of DCs as MNCs operate in vari-ous countries which are not perfectly correlated and giving rise to diversifi-cation opportunities for the MNCs. Consequently, the overall cash flows of MNCs will be more stable, thereby reducing the probability of bankruptcy and increasing the ability of debt fi-nancing (Shapiro 1978 in Lee and Kwok 1988). The argument of more stable MNCs’ cash flows compared to DCs’ is also corroborated by Burgman (1996) and Eiteman, Stonehill, and Moffett (2007). The main rationales are: (1) MNCs have a range of revenues not only from the country of origin, thereby increasing cash flows available for debt payment and (2) MNCs have a better ability to manage and hedge against
ex-change rate risk. Furthermore, Doukas and Pantzalis (2003) also argue that since the operations of MNCs are industrially and geographically diversi-fied, the business and financial risks of MNCs are expected to be lower in comparison to those of DCs. Hence, it suggests that financial distress for MNCs should be relatively low, leading to reduced cost of debt and rising MNCs’ leverage. Therefore, the nega-tive relationship between the possibility of bankruptcy and the change in debt level should be stronger for MNCs than DCs.
HII.7: The negative impact of the possibility of bankruptcy on the change in debt level is stronger for MNCs than DCs. Based on the definition of MNC by Michael and Shaked (1986) and Rajan and Zingales (1995), which have been described previously, MNCs have subsidiaries at least in six countries. Accordingly, the size of MNCs is larger than that of local firms. Consequently, if size is a proxy for financial informa-tion, outside investors should prefer equity relative to debt, and size should result in a lower change in debt level for MNCs.
HII.8: The negative relationship be-tween firm size and the change in debt level is stronger for MNCs than DCs.
Previous studies show that MNCs have a better opportunity than do DCs to earn more profit mainly due to hav-ing an access to more than one source of earnings and a better chance to have favorable business conditions in par-ticular countries (Kogut 1985; Barlett and Ghoshal 1989). Therefore, accord-ing to the peckaccord-ing order theory, MNCs rely more on retained earnings rather than external financing such as debt to finance their operational activities (Burgman 1996). In other words, the use of MNCs’ debt will decline be-cause MNCs have higher profitability than do DCs, and will rely more on retained earnings instead of debt. HII.9: The negative relationship
between profitability and the change in debt level will be stronger for MNCs than DCs.
Research Sample
Sample
The unit of analysis is the listed companies on the Indonesian Stock Exchange, both domestic and multina-tional corporations. Observation pe-riod is from 2001 to 2005. Data are taken from the OSIRIS database.
To be included in the sample, cri-teria that must be met are: (1) the firms must be included in the Osiris database (Bureau Van Djiek); (2) the firms are in the manufacturing sector, and are classified as multinational firms or do-mestic firms based on the definition of Michael and Shaked (1986),2 and (3) the firms’ financial data are available in Osiris.
The firms that operated until the end of 2005 amounted to 329 firms, either MNCs or DCs, but the numbers of firms that meet the criteria are 48 firms as MNCs and 33 firms as DCs. Thus, this study uses 81 firms over five years, a total of 405 observations.
Definitions of Operational
Variables
In accordance with the descrip-tion given in the earlier literature, the operational definitions of research vari-ables are as follows. Corporate debt is measured by the change in debt-to-asset ratio (DAR). We measure le-verage using the term used by Lee and Kwok (1988), Burgman (1996), Chen et al. (1997), Chkir and Cosset (2001). Debt-to-asset ratio and its change are given as follows.
2 We also recheck the MNCs classification based on the following site: id.wikipedia.org/wiki/
Perusahaan_multinasional; and wrightreports.ecnext.com/coms2/reportdesc_COMPANY
DAR= Long Term Debt ....(1) (Long Term Debt + Market Value
where DARt is the debt-to-asset ratio in year t; DARt-1 is the debt-to-asset ratio in previous year t-1.
The proxy for agency problems utilized in this study is free cash flow to the firm (FCFF) to total assets. As mentioned previously, free cash flow is cash flow in excess of that required to fund all projects that have positive NPV. Jensen (1986) argues that even though managers invest in all available positive net-present-value projects, they tend to use the surplus cash for their own utility rather than disgorging the cash to shareholders. Because the self-interested behavior of managers in-duces them to hoard and misuse free cash flows, the agency problem mani-fests itself through the expansion of firm size, thereby increasing the man-agers’ control and personal remunera-tion even though their acremunera-tions may reduce the overall firm value. There-fore, firms with high FCFs face more severe agency problems in the sense that higher FCFs provide an opportu-nity for managers to engage in “value destroying activities” such as increas-ing their perquisites, shirkincreas-ing, and in-vesting in negative NPV projects. For example, Jensen (1986) shows that in the 1970s and early 1980s, the oil indus-try earned windfall profits but instead of paying them out to the shareholders, management spent heavily on explora-tion and development activities even
though the projects’ returns were be-low the cost of capital. Furthermore, the condition worsened when manage-ment also decided to invest in unrelated businesses (diversification) that fur-ther reduced shareholder wealth. Sec-ond, Jensen (1993 in Brush et al. 2000) demonstrates that GM, IBM, and Eastman Kodak in 1980s made mas-sive unprofitable investments out of FCFs in industries with excess capac-ity. Using the sample of larger firms, he finds that these firms have inefficien-cies in capital expenditures and R&D spending decisions that cause the firms to earn returns below those on market-able securities. This empirical finding proves that managers tend to hoard the free cash flows rather than distributing them to shareholders since their com-pensation depends on the firm’s growth, and accordingly they are encouraged to overinvest in cash or capital expen-ditures. Several empirical findings cor-roborate this evidence. Free Cash Flow Theory, e.g., Rajan et al. (2000), as-serts that firms having large amount of free cash flows are inclined to engage more in corporate diversification that reduces firm value. Weisbach (1988), Christie and Zimmerman (1994), and Gul (2001) show that agency problems in high FCF firms manifest in the choice of FIFO inventory method in order to increase operating income. This non-value maximizing behavior purports to attain higher compensation and secure their jobs. Therefore, based on previ-ous empirical studies (e.g., Jensen 1986; Weibach 1988; Lehn and Poulsen 1989; Agrawal and Jayaraman 1994; Christie DAR= DARt - DARt-1 ... (2)
and Zimmerman 1994; Rajan et al. 2000; Gul 2001; Kim and Lee 2003), we employ a proxy for the agency problem as follows:
While free cash flow is calculated using the following formula:
where:
t = year t
t-1 = year t-1
FCFFt = Free Cash Flow to the Firm EATt = Earnings after Tax
Deprt = Depreciation
Capext= Capital Expenditures NWt = Net Working Capital in year
t
NWt-1 = Net Working Capital in year t-1
The probability of bankruptcy is measured by the Z-Score, which is a multidimensional measure for bank-ruptcy formulated by Altman (1968) based on the financial ratios of a firm. The value above 2.99 reflects the lower probability of financial distress while the value below 1.80 indicates the higher probability of financial distress. We use this measurement due to two rea-sons. First, in Indonesia, the empirical
study to test the predictive ability of the Altman’s Z-score (Altman 1968) was conducted by Hadad et al. (2003). Their sample included 32 listed compa-nies on the Jakarta Stock Exchange (i.e., it consisted of 16 companies still active on the stock exchange and 16 companies already delisted from the stock exchange) over 1999-2002. The result shows that Altman’s Z-score has predictive power (see Table 2). The predictive accuracy is greater than 70 percent (i.e., 74.5% accuracy rate of three years, 77.3% accuracy rate of two years, and 78.1% accuracy rate of one year prior to bankruptcy.) Second, Pongsatat et al. (2004) investigate the comparative ability of Ohslon’s Logit Model and Altman’s Z-Score Model for predicting the bankruptcies of large and small firms in Thailand. A matched pair sample of 60 bankrupt and 60 non-bankrupt firms were examined over the years 1998-2003. They conclude that while each of the two methods has a predictive ability when applied to Thai firms, there is no significant dif-ference in respective predictive abili-ties of Altman’s (1968) model and Ohlson’s (1980) model, either for large-asset or for small-large-asset Thai firms. Hence, even though the Altman’s Z-score raises critiques about the selec-tion of the relatively best financial ra-tios to detect the probability of bank-ruptcy and how much weight should be given to each of the chosen financial ratio, the above studies show that this measurement has a relatively good predictive ability.
Agency Problem= (FCFF) ... (3) Total Assets
FCFFt= EATt + Deprt
The measurement of Altman’s Z-score is given by the following formula.
Further, firm size is measured by the log of total assets (Titman and Wessels 1988; Rajan and Zingales 1995; Lee and Kwok 1988; Burgman 1996; Che et al. 1997; Doukas and Pantzalis 1997), and the profitability of firm is measured by return on assets (ROA) as defined by Doukas and Pantzalis
(2003). The formulae of the two mea-sures are given respectively as follows:
Data Analysis
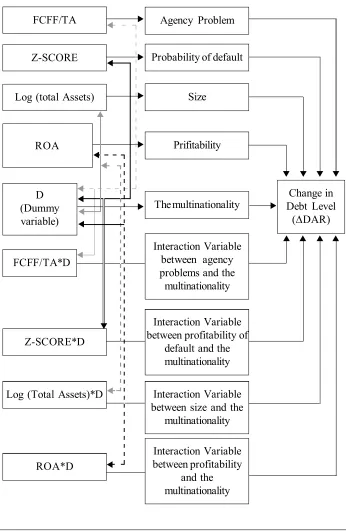
This study uses two models. The first model is to analyze capital struc-ture determinants regardless of multinationality. On the other hand, the second model is relevant to identifying the significance of capital structure determinants of MNCs relative to DCs. We utilize the dichotomous variable and dichotomous interaction variables for multinationality. The relationship among research variables are summa-rized in Figures 2 and 3. We employ the method of Pooled Least Squares (PLS), Fixed Effects Model (FEM), and Ran-dom Effects Model (REM) to examine both models.
Both models reveal a row in the following regression formula.
Table 2. The Comparison of Correct Estimates between Output Discrimi-nant Analysis and Logistic Regression
Correct Estimates Discriminant (%) Logistics (%)
3 years before bankrupt 74.5 80.99
2 years before bankrupt 77.3 85.54
1 year before bankrupt 78.1 86.72
Source: Hadad et.al 2003
SIZE= Log (Total Asssets)....(6)
ROA= ...(7)Net Income Total Assets
Z= 3.3 +
1.2 +
1.0 +
0.6 +
1.4
...(4) Net Working Capital
Total Assets
Sales Total Assets Market Value of Equity
Book Value of Debt EBIT
Total Assets
where:
i = firm i,
t = year t,
DAR = Change in debt to total assets ratio,
(FCFF/TA)it = Free cash flows to Total assets,
Z-SCOREit = Altman’s Z-score, Log (TA)it = Log of total assets.
Figure 2. The Relationships among Research Variables in Model 1
FCFF/TA
Z-Score
Log (Total Assets)
ROA
Agency Problems
Probability of default
Size
Profitability
Change in Debt Level (DAR)
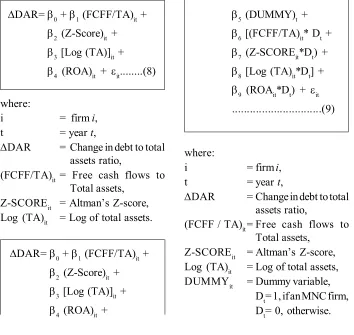
DAR=0 + 1 (FCFF/TA)it + 2 (Z-Score)it + 3 [Log (TA)]it + 4 (ROA)it + it...(8)
where:
i = firm i,
t = year t,
DAR = Change in debt to total assets ratio,
(FCFF / TA)it= Free cash flows to Total assets,
Z-SCOREit = Altman’s Z-score, Log (TA)it = Log of total assets, DUMMYit = Dummy variable,
Dt= 1, if an MNC firm, Dt= 0, otherwise. 5 (DUMMY)t + 6 [(FCFF/TA)it* Dt + 7 (Z-SCOREit*Dt) + 8 [Log (TA)it*Dt] + 9 (ROAit*Dt) + it ...(9)
Figure 3. The Relationships among Research Variables in Model II
FCFF/TA
Z-SCORE
Log (total Assets)
FCFF/TA*D
Z-SCORE*D
Log (Total Assets)*D
ROA*D
Agency Problem
Probability of default
Size
Prifitability
The multinationality
Interaction Variable between agency problems and the multinationality
Interaction Variable between profitability of
default and the multinationality
Interaction Variable between size and the
multinationality
Interaction Variable between profitability
and the multinationality
Change in Debt Level
(DAR) D
(Dummy variable)
ROA
Results
Descriptive Analysis
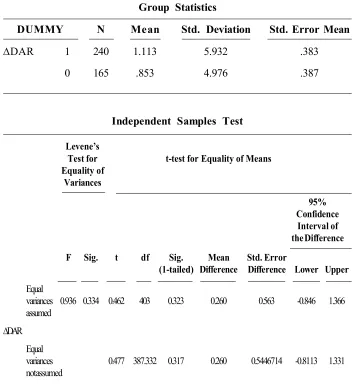
Predicated on the results of de-scriptive statistics in Table 3, we pro-vide epro-vidence that MNCs have an average change in debt level of 1.11, which is higher than that of DCs (0.85). We employ the t-test for equality means to examine the mean difference of the changes in debt levels of both firms as shown in Table 4.
Based on Table 4, the average change in MNCs’ debt level is not significantly different from that of DC. This result is not consistent with the hypothesis II.5, i.e., the change in MNCs’ debt level is higher than that of DCs. However, a regression analysis is needed to confirm this hypothesis further.
Furthermore, Pearson correlation analysis as shown in Table 5 depicts several findings. First, Z-score value is positively related to ÄDAR (p-value = 0.000). Higher Z-score value implies a lower probability of default, thereby increasing the change in debt level. Second, log (TA) is negatively related to DAR (p-value = 0.005). Thus, firm size is negatively related to the change in debt level. Third, DFCFF is posi-tively related to DAR (p-value = 0.047). Therefore, a positive relation-ship between agency problems and the change in debt level becomes stronger for MNCs. Fourth, DZSCORE is posi-tively related to ÄDAR (p-value = 0.000). In other words, the positive relationship between Z-score (or the negative relationship between the prob-ability of bankruptcy) and the change in debt level is stronger for MNCs.
Table 3. Descriptive Statistics
Variable MNC DC
Mean Std Mean Std
DAR 1.11 5.93 0.85 4.98
FCFF/TA 0.02 0.12 0.03 0.12
ZSCORE 3.78 6.54 2.48 3.00
LTA 8.85 0.42 8.94 0.54
Table 4. t-tests for the Equality of Means of the Changes in Debt Level
Group Statistics
DUMMY N Mean Std. Deviation Std. Error Mean
DAR 1 240 1.113 5.932 .383
0 165 .853 4.976 .387
Independent Samples Test
Levene’s
Test for t-test for Equality of Means Equality of
Variances
95% Confidence
Interval of the Difference F Sig. t df Sig. Mean Std. Error
(1-tailed) Difference Difference Lower Upper Equal
variances 0.936 0.334 0.462 403 0.323 0.260 0.563 -0.846 1.366 assumed
DAR Equal
17
a
&
Rah
maw
ati—
The
Influ
ence
of M
ultin
ation
ality
on th
e D
eter
min
ants
of C
han
ge in
Deb
t Lev
el
Correlations
DAR FCFF ZSCORE LTA PROF DUMMY FCFF ZSCORE LTA PROF
DAR Pearson Corr 1 0.059 0.237* * -0.127* * 0.001 0.023 0.083* 0.230* * 0.017 0.024
Sig. (1-tailed) 0.120 0.000 0.005 0.488 0.322 0.047 0.000 0.368 0.314
FCFF Pearson Corr 1 0.359* * 0.166* * 0.561* * -0.020 0.750* * 0.285* * -0.007 0.479* *
Sig. (1-tailed) 0.000 0.000 0.000 0.347 0.000 0.000 0.444 0.000
ZSCORE Pearson Corr 1 -0.023 0.366* * 0.118* * 0.392* * 0.911* * 0.119* * 0.427* *
Sig. (1-tailed) 0.322 0.000 0.009 0.000 0.000 0.008 0.000
LTA Pearson Corr 1 0.229* * -0.095* 0.140* * -0.015 -0.045 0.130* *
Sig. (1-tailed) 0.000 0.028 0.002 0.383 0.183 0.005
PROF Pearson Corr 1 -0.137* * 0.470* * 0.271* * -0.125* * 0.734* *
Sig. (1-tailed) 0.003 0.000 0.000 0.006 0.000
DUMMY Pearson Corr 1 0.119* * 0.347* * 0.997* * 0.147* *
Sig. (1-tailed) 0.008 0.000 0.000 0.002
FCFF Pearson Corr 1 0.423* * 0.135* * 0.649* *
Sig. (1-tailed) 0.000 0.003 0.000
ZSCORE Pearson Corr 1 0.348* * 0.465* *
Sig. (1-tailed) 0.000 0.000
LTA Pearson Corr 1 0.162* *
Sig. (1-tailed) 0.001
PROF Pearson Corr 1
Sig. (1-tailed)
Tests for Models I and II
Before conducting the regression analysis, we examine the assumptions in the multiple linear regression. To overcome the heteroskedasticity prob-lem in both models, we use the White heteroskedasticity-consistent standard errors and variances.
Furthermore, to see whether there is an autocorrelation problem, we em-ploy the Durbin-Watson (DW) test. The Durbin-Wation (DW) value for Model 1 is 2.33 whereas for Model 2 is 2.37. Based on the indicators used in the DW values between -2 to +2 for the two models, we may conclude that both models are free from the autocorrelation problem.
Multicollinearity tests are con-ducted with the indicator values of VIF (Variance Inflation Factor), and VIF values for all variables in the two mod-els are under 10. Thus, the model is free from multicollinearity.
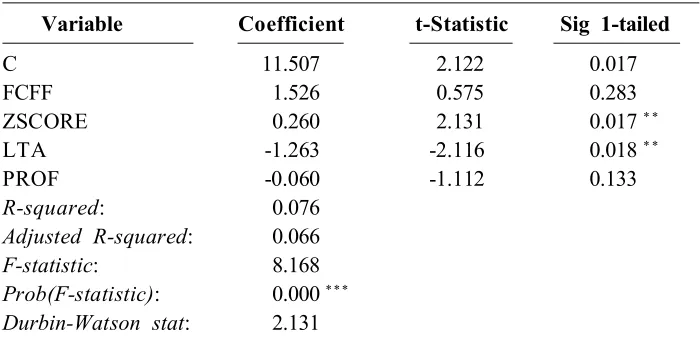
Model I Regression Analysis
The regression results for Model 1 in Table 6 show that agency problems and profitability do not affect the change in debt level. Accordingly, hypotheses I.1 and I.4 are not supported.
Z-score has a positive influence on the change in debt level, and this is significant at 5 percent level. Because a greater value of Z-score indicates a lower probability of default, then the regression result basically shows a positive effect. This result is consistent with hypothesis I.2, i.e., there is a negative influence of the probability of default on the change in debt level. As mentioned above, the capital structure decisions of firms depend on the ben-efits and costs of using more debt. Less debt is used if the cost of bankruptcy is higher than the tax shield benefit or other benefits of using more debt (Kim and Sorensen 1986; Graham 2000).
Table 6. PLS Statistical Outputs for Model I
Variable Coefficient t-Statistic Sig 1-tailed
C 11.507 2.122 0.017
FCFF 1.526 0.575 0.283
ZSCORE 0.260 2.131 0.017* *
LTA -1.263 -2.116 0.018* *
PROF -0.060 -1.112 0.133
R-squared: 0.076
Adjusted R-squared: 0.066
F-statistic: 8.168
Prob(F-statistic): 0.000***
Durbin-Watson stat: 2.131
Firm size negatively affects the change in debt level, which is signifi-cant at 5 percent level. Therefore, the hypothesis I.3 is substantiated. Hence, the result supports Rajan and Zingales (1995) who find that informational asymmetries among insiders in a firm and in the capital markets are lower for large firms. Therefore, large firms should be more capable of issuing informationally sensitive securities like equity, and accordingly should have a lower debt level.
Overall, we conclude that factors affecting the change in debt level in Indonesian firms without considering the multinationality are the probability of bankruptcy and firm size. On the
other hand, agency problems and prof-itability do not affect the change in debt level. In other words, hypotheses I.2 and I.3 are supported whereas hypoth-eses I.1 and I.4 are not evidenced.
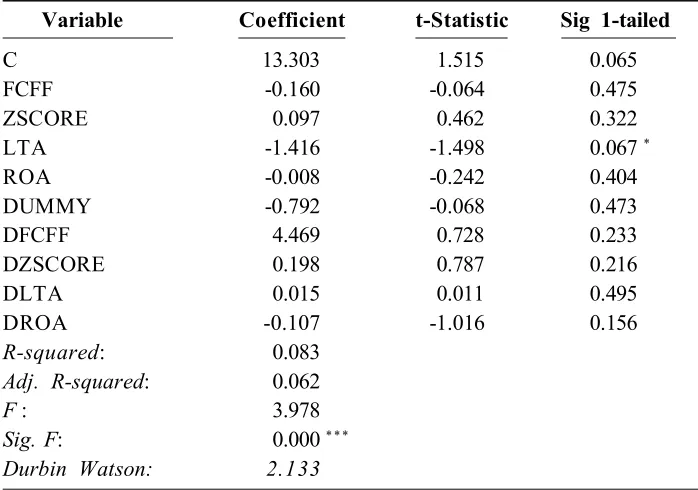
Model II Regression Analysis
The results of Model II in Table 7 show that only firm size has a negative influence on the change in debt level, and this is marginally significant at 10 percent level. Meanwhile, agency prob-lems, the probability of bankruptcy, and profitability do not affect the change in debt level. Therefore, only hypothesis II.3 is supported while hypotheses II.1, II.2, and II.4 are not supported.
Table 7. PLS Statistical Outputs for Model II
Variable Coefficient t-Statistic Sig 1-tailed
C 13.303 1.515 0.065
FCFF -0.160 -0.064 0.475
ZSCORE 0.097 0.462 0.322
LTA -1.416 -1.498 0.067*
ROA -0.008 -0.242 0.404
DUMMY -0.792 -0.068 0.473
DFCFF 4.469 0.728 0.233
DZSCORE 0.198 0.787 0.216
DLTA 0.015 0.011 0.495
DROA -0.107 -1.016 0.156
R-squared: 0.083
Adj. R-squared: 0.062
F : 3.978
Sig. F: 0.000***
Durbin Watson: 2.133
Previous empirical studies that in-vestigated the capital structures of do-mestic and multinational corporations (e.g., Titman and Wessels 1988; Rajan and Zingales 1995; Lee and Kwok 1988; Burgman 1996; Che, Cheng, He, and Kim 1997; Doukas and Pantzalis 1997) controlled for size factor. As pointed out by Rajan and Zingales (1995) in Chkir and Cosset, the effect of size is ambiguous. Larger firms tend to be more diversified and therefore are less likely to go bankrupt. This being the case, size should have a positive effect on leverage. However, if size is a proxy for the financial information, outside investors should prefer equity relative to debt, and size should result in a lower change in debt level for MNCs. Based on the empiri-cal studies on firms in Indonesia, we conclude that size is a proxy for the financial information, so the influence of size on the change in debt level is negative.
In addition, multinationality appar-ently does not influence the change in debt level. In other words, the change in MNCs’ debt level is not relatively different from that of DCs. Thus, hy-pothesis II.5 is not substantiated. We conclude that multinationality in Indo-nesia does not affect leverage. Fur-thermore, multinationality does not in-fluence the relationship of agency prob-lems, the probability of bankruptcy, size, and profitability to the change in debt level. In other words, hypotheses II.6, II.7, II.8, and II.9 are not sup-ported.
Sensitivity Analysis
Alternative Statistical Tests for Models I and II
This research uses panel data, so the use of Pooled Least Squares (PLS) does not consider the differences among observations and across years since the intercepts and the slopes of the model are assumed to be equal. There-fore, to accommodate the flaw of PLS, we employ the Fixed Effects Model (henceforth FEM) and the Random Effects Model (henceforth REM).
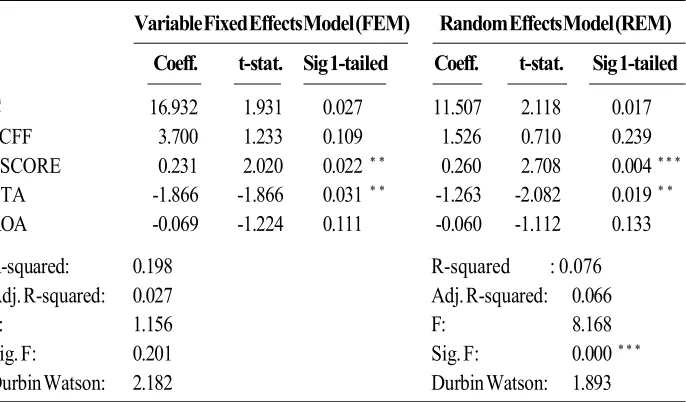
The statistical outputs of FEM and REM for Model I are shown in Tables 8 and 9. Based on PLS and REM, the Z-score has a positive influence on the change in debt level (significant at 5% level for FEM and 1% level for REM) while LTA has a negative influence (significant at 5% level for FEM and REM). Thus, hypotheses I.2 and I.3 are supported.
Based on the previous three mod-els, we use the Chow test, the Hausman test, and the Breusch-Pagan test to determine the best prediction model. Chow test is used to determine whether PLS or FEM is better. The hypothesis is stated as follows:
H0: Use Common / Pooled Least Squares (PLS)
H1: Use Fixed Effects Model (FEM) Meanwhile, Hausman test is uti-lized to decide on whether REM or FEM model is better. The hypothesis is stated as follows:
H0: Use Random Effects Model (REM)
Table 8. The Statistical Outputs of Fixed Effects Model and Random Effects Model for Model I
Variable Fixed Effects Model (FEM) Random Effects Model (REM) Coeff. t-stat. Sig 1-tailed Coeff. t-stat. Sig 1-tailed
C 16.932 1.931 0.027 11.507 2.118 0.017
FCFF 3.700 1.233 0.109 1.526 0.710 0.239
ZSCORE 0.231 2.020 0.022* * 0.260 2.708 0.004* * *
LTA -1.866 -1.866 0.031* * -1.263 -2.082 0.019* *
ROA -0.069 -1.224 0.111 -0.060 -1.112 0.133
R-squared: 0.198 R-squared : 0.076
Adj. R-squared: 0.027 Adj. R-squared: 0.066
F: 1.156 F: 8.168
Sig. F: 0.201 Sig. F: 0.000* * *
Durbin Watson: 2.182 Durbin Watson: 1.893
*** significant at 1 percent level ** significant at 5 percent level * significant at 10 percent level
Table 9. Summary of Coefficient Signs for PLS, FEM, and REM Tests for Model I
Expected Fixed Random
Coefficient PLS Effect Model Effect Model
(FEM) (REM)
Variable DDAR DDAR DDAR DDAR
FCFF + - -
-ZSCORE +a +** +** +***
LTA - -** -** -**
ROA - - -
-a Because higher z-score value shows lower likelihood probability of default then the influence
of z-score to change in debt level is positive. This does not imply contradiction to hypothesis stated above, i.e. the higher likelihood probability of default so the change in debt level will be lower.
The output statistics of Chow test in Table 10 show that the p-value for the cross-section F is 0.9157, thereby concluding that the PLS model is better than the FEM. Meanwhile, Hausman test in Table 11 describes that the p-value for the cross-section random is 1.0000; accordingly, the REM model is found to be better than the FEM.
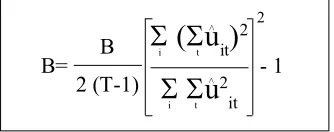
Furthermore, we conduct the Breusch-Pagan test to examine whether REM is better than PLS. Based on Greene (1993) and Lloyd, Morrissey, and Osei (2008), the Breusch-Pagan test examines whether there is varia-tion within groups in the random ef-fects model. The hypotheses given are H0 :
= 0, and H1: otherwise. The
statistical test is given as follows:
where uit is the residual of regression of xit on yit. This statistic is distributed as a chi-squared with the degree of freedom of one. If H0 is accepted, then we cannot reject the hypothesis that the slope coefficient of REM does not diverge from that of PLS (GLS= OLS). Based on the PLS residuals, the result obtained by the Breusch-Pagan test statistics for Model I is as follows:
< <
405 (5) 1.427 x 10⁻²⁴
2 (3 - 1) 11534.98 -1 = 506.25 2
Table 10. Chow Test for Model I Redundant Fixed Effects Tests Pool: FEM1
Test cross-section fixed effects
Effects Test Statistic d.f. Prob.
Cross-section F 0.757643 (67,333) 0.9157
Cross-section Chi-square 57.461491 67 0.7906
Table 11. Hausman Test for Model I Correlated Random Effects - Hausman Test Pool: REM1
Test cross-section random effects
Test Summary Chi-Sq. Statistic Chi-Sq. d.f. Prob.
Cross-section random 0.000000 4 1.0000
B= - 1B 2 (T-1)
(
u
it)
2
u
2 it<
i t
<
i t
Critical values of 5 percent and 1 percent of the chi-squared distribution with one degree of freedom are 3.842 and 6.635, respectively. Accordingly, they are statistically significant at 5 percent and 1 percent levels, respec-tively. Therefore, we conclude that REM is better than PLS model. How-ever, based on previous discussion, the result of REM is not different from that of PLS, i.e., Z-score has a positive influence on the change in debt level whereas size has a negative influence on the change in debt level. Hence, we confirm hypotheses I.2 and I.3.
The tests of FEM and REM are also conducted for Model II, but the
statistical test for FEM cannot be run as the statistical output shows a near singular matrix. Meanwhile, the result of REM in Table 12 shows that size has a negative effect on the change in debt level, and it is significant at 10 percent level. Furthermore, we employ the Breusch-Pagan test to determine whether PLS or REM is better.
Based on the PLS residuals, the result obtained by the Breusch-Pagan test statistic for Model II is as follows:
405 (5) 1.427 x 10⁻²⁵
2 (3 - 1) 11440.39 -1 = 506.25 2
Table 12. The Statistical Outputs of REM Test for Model II
Variable Coefficient t-Statistic Sig 1-tailed
C 13.303 1.496 0.068
FCFF -0.160 -0.088 0.465
ZSCORE 0.097 0.924 0.178
LTA -1.416 -1.457 0.073*
ROA -0.008 -0.263 0.396
DUMMY -0.792 -0.077 0.470
DFCFF 4.469 0.969 0.167
DZSCORE 0.198 1.091 0.138
DLTA 0.015 0.013 0.495
DROA -0.107 -0.941 0.174
R-squared: 0.083
Adj. R-squared: 0.062
F: 3.978
Sig. F: 0.000***
We thus conclude that REM is better than PLS, but the significances of coefficients as summarized in Table 13 are low, indicating that only size has a negative influence on the change in debt level. Multinationality in fact does not affect the change in debt level and the determinants of the change in debt level.
Overall, when we exclude the multinationality variable from the model, the coefficients on Z-score and size are significantly positive and negative, respectively, while the coefficient on agency problems and profitability are not significantly different from zero.
Therefore, in general the change in debt level is negatively affected by the probability of bankruptcy and size. However, when we include the multi-nationality and its interaction with the determinants in the regression, the prob-ability of bankruptcy turns out to be insignificant whereas size remains sig-nificant.
The Determinants of the Change in Debt Level for MNCs and DCs
Based on Model I, we use the full sample of both MNCs and DCs to analyze the determinants of capital structure for Indonesian firms in gen-Table 13. Summary of Coefficient Signs for PLS and REM for Model II
Expected Fixed Random
Coefficient PLS Effect Model Effect Model
(FEM) (REM)
Variable DDAR DDAR DDAR DDAR
FCFF + - -
-FCFF + -
-ZSCORE + + +
LTA - -* -*
ROA - -
-Dummy + -
-DFCFF + + +
DZSCORE +a + +
DLTA - + +
DROA - -
-a Bec-ause higher z-score v-alue shows lower likelihood prob-ability of def-ault then the inter-action variable betweeen dummy variable and z-score is positive. The argumentation is MNCs expected to have a lower probability of bankruptcy than DCs.
eral. In this section, we examine the capital structure determinants for MNCs and DCs separately using REM. The results in Table 12 show that when the sample is divided into MNCs and DCs, significant differences in the de-terminants appear. For MNCs, the re-sults show that: (1) Z-score has a positive influence on the change in debt level (significant at 1% level); (2) size has a negative influence on the change in debt level (significant at 10% level); and (3) profitability has a negative influence on the change in debt level (significant at 5% level). Therefore, hypotheses I.2, I.3, and I.4 are sub-stantiated. On the contrary, for DCs
none of the independent variables is significant in determining the change in debt level. Although these results show that the determinants of capital struc-ture in Indonesia differ, depending upon whether the firm is a domestic or a multinational corporation, the results do not directly indicate if the influences of the determinants are significantly different between MNCs and DCs. The next test (Model 2) attempts to do this by combining MNCs and DCs in one regression, and examines if the coefficients on independent variables are significantly different between MNCs and DCs.
Table 14. The Determinants of Changes in Debt Level for MNCs and DCs
MNC DC
Variable Coeff. t-stat. Sig 1-tailed Coeff. t-stat. Sig 1-tailed
C 12.511 1.554 0.061 13.303 1.956 0.026
FCFF 4.309 1.057 0.146 -0.160 -0.045 0.482
ZSCORE 0.294 4.612 0.000* * * 0.097 0.684 0.248
LTA -1.401 -1.541 0.063* -1.416 -1.869 0.032* *
PROF -0.115 -1.837 0.034* * -0.008 -0.135 0.447
R-squared: 0.108 R-squared: 0.029
Adjusted R-squared: 0.093 Adjusted R-squared: 0.005
F-statistic: 7.135 F-statistic: 1.212
Prob(F-statistic): 0.000* * * Prob(F-statistic): 0.308
Durbin-Watson stat: 2.126 Durbin-Watson stat: 2.146
The Determinants of the Change in Debt Level with Each Individual Interactive Variable
We also conduct an analysis of including an interactive term MNC*X into the regression, where X
repre-sents each individual change in debt level determinant in the regression. So, we test separate regressions that in-clude one interactive variable at a time using the REM. Based on results in Table 15, we find that: (1) Z-score has
Table 15. The Determinants of Change in Debt Level by Including an Interactive Variable at a Time
Independent Dependent Variable : DDAR
Variable
(1) (2) (3) (4)
Intercept 12.048 12.867 10.753 11.809
(0.025)** (0.013)** (0.130) (0.026)**
FCFF 0.220 1.822 1.636 1.690
(0.446) (0.199) (0.239) (0.224)
ZSCORE 0.261 0.115 0.267 0.272
(0.002)*** (0.148) (0.003)*** (0.004)***
LTA -1.295 -1.353 -1.157 -1.287
(0.022)** (0.015)** (0.127) (0.023)**
ROA -0.066 -0.062 -0.064 -0.043
(0.103) (0.1046) (0.111) (0.094)*
Dummy -0.403 -0.783 2.016 -0.224
(0.294) (0.075) (0.436) (0.374)
DFCFF 2.670
(0.035)**
DZSCORE 0.169
(0.165)
DLTA -0.265
(0.422)
DROA -0.040
(0.287)
Adjusted R2 0.063 0.065 0.063 0.063
Prob(F-Statistic) 0.000*** 0.000*** 0.000*** 0.000***
a positive influence on the change in debt level, and it is significant at 1 percent level in three out of four equa-tions; (2) size has a negative influence on the change in debt level, and it is significant at 5 percent level in three out of four equations; and (3) profitabil-ity has a negative influence on the change in debt level, and it is marginally significant at 10 percent level in one out of four equations. Meanwhile, the change in debt level is not influenced by the multinationality since the statistical outputs of four equations show that multinationality is not significant. Fi-nally, only the interactive variable be-tween multinationality and agency prob-lems in the first equation is significant, meaning that a positive impact of the agency problems and the change in debt level is more pronounced for MNCs than DCs. It signifies that hypothesis II.6 is supported.
Conclusion
This study aims at investigating whether: (1) the change in debt level is affected by agency problems, the prob-ability of bankruptcy, size, and profit-ability; (2) the change in debt level is influenced by multinationality (i.e., MNCs or DCs), and (3) there is an influence of multinationality on the re-lationship of agency problems, the prob-ability of bankruptcy, size, and profit-ability to the change in debt level.
The results of this study provide evidence that in general the change in debt level is negatively affected by the probability of default (thereby posi-tively affected by Z-score) and also negatively affected by size. However, when the sample is divided between MNCs and DCs, the results show that the change in debt level for MNCs is positively influenced by Z-score but negatively influenced by size and prof-itability. Meanwhile, for DCs none of the variables significantly affects the change in debt level.
References
Aggarwal, R., and N. A. Kyaw. 2010. Capital structure, dividend policy, and multinationality: Theory versus empirical evidence. International Review of Financial Analysis 19: 140-150.
Agrawal, A., and N. Jayaraman. 1994. The dividend policy of all-equity firms: A direct test of the free cash flow theory. Managerial and Decision Economics 15: 139-148. Akhtar, S. and B. Oliver. 2009. The determinants of debt ratio for Japanese multinational and
domestic corporations. International Review of Finance 9 (Issue 1-2): 1-26. Altman, E. I. 1968. Financial ratios, discriminant analysis and the predicion of corporate
bankruptcy. Journal of Finance 23 (4): 589–609.
Barlett, C. A., and S. Ghoshal. 1989. Managing Across Borders: The Transnationals Solution. Cambridge, MA, Harvard Business School Press.
Brush, T. H., P. Bromiley, and M. Hendricks. 2000. The free cash flow hypothesis for sales growth and firm performance. Strategic Management Journal 21 (4): 455-472. Burgman, T. A. 1996. An empirical examination of multinational corporate capital structure.
Journal of International Business Studies 27 (3): 553–570.
Chen, C. J. P., A. C. S. Cheng, J. He, and J. Kim. 1997. An investigation of the relationship between international activities and capital structure. Journal of International Business Studies 28 (3): 563-577.
Chkir, I. E., and J. C. Cosset. 2001. Diversification strategy and capital structure of multinational corporations. Journal of Multinational Financial Management: 17-37. Christie, A. A., J. L. Zimmerman. 1994. Efficient and opportunistic choices of accounting
procedures: Corporate control contests. The Accounting Review 69: 539-566. Copeland, T. E., J. F. Weston, and K. Shastri. 2005. Financial Theory and Corporate Policy
(4th ed.). Addison Wesley, Fourth Edition.
Denis, D. J., D. K. Denis, and A. Sarin. 1997. Agency problems, equity ownership, and corporate diversification. The Journal of Finance 52 (1): 135–160.
Doukas, J., and C. Pantzalis. 1997. Multinational firms’ agency cost of debt. Working Paper (August). Old Dominion University and Western Michigan University.
Doukas, J., and C. Pantzalis. 2003. Geographic diversification and agency cost of debt of multinational firms. Journal of Corporate Finance 9: 59-92.
Emery, D. R., and J. D. Finnerty. 1997. Corporate Financial Management. Prentice Hall. Eiteman, D. K., A. I. Stonehill , and M. H. Moffett. 2007. Multinational Business Finance
(11th ed.). Addison-Wesley, Massachusetts.
Fama, F., and K. French. 2002. Testing trade-off and pecking order predictions about dividends and debt. Review of Financial Studies 15 (1): 1-33.. Oxford University Press for Society for Financial Studies.
Graham, J. R. 2000. How big are the tax benefits of debt? Journal of Finance 55 (5): 1901-1941.
Gull, F. A. 2001. Free cash flow, debt monitoring and managers’ LIFO/FIFO policy choice. Journal of Corporate Finance 7: 475-492.
Hadad, M. D., W. Santoso, and I. Rulina. 2003. Indikator Kepailitan di Indonesia: An Additional Early Warning Tools pada Stabilitas Sistem Keuangan (Desember). www.bi.go.id/NR/rdonlyres/E5BBB591-594B-4C44-8D03-AD62E5650132/7823/ IndikatorKepalilitandiIndonesia.pdf.
Harris, M., and A. Raviv. 1991. The theory of capital structure. Journal of Finance 49: 297-355.
Jensen, M. C., and W. H. Meckling. 1976. Theory of the firm: Managerial behavior, agency costs and ownership structure. Journal of Financial Economics 3: 305-360. Jensen, M. C. 1986. Agency cost of free cash flow, corporate finance and takeovers.
American Economic Review 76: 323-339.
Jensen, M. C. 1989. Eclipse of the public corporation. Harvard Business Review 5: 61-74. Jensen, M. C. 1993. The modern industrial revolution, exit, and control systems. Journal
of Finance XVVIII (3): 831-880.
Kim, W. S., and E. H. Sorensen. 1986. Evidence on the impact of the agency costs of debt in corporate debt policy. Journal of Financial and Quantitative Analysis 21: 131-144. Kim, B., L. Lee. 2003. Agency problems and performance of Korean companies during the Asian financial crisis: Chaebol vs Non-Chaebol firms. Pacific-Basin Finance Journal 11: 327-348.
Kogut, B. 1985. The Multinational Corporations in 1980’s. MIT Press, Cambridge, MA. Kusuma, I. W. 1999. Financial performance and characteristic: Comparison of US multina-tional and domestic firms. Gadjah Mada International Journal of Business 1: 11-28. Lee, K. C., and C. C. Y. Kwok. 1988. Multinational corporation vs domestic corporation: International environment factors and determinants of capital structure. Journal of International Business Studies 19 (4): 41–58.
Lehn, K, and A. Poulsen. 1989. Free cash flow and stockholders gains in going private transactions. Journal of Finance: 771-787.
Maloney, M. T., R. E. McCormick, and M. L. Mitchell. 1993. Managerial decision making and capital structure. Journal of Business 66. 189-217.
Michael, A., and I. Shaked. 1986. Multinational corporation vs domestic corporation: Financial performance and characteristics. Journal of International Business Studies 17 (4): 89–100.
Mitto, U. R, and Z. Zhang. 2008. The capital structure of multinational corporations: Canadian versus U.S. evidence. Journal of Corporate Finance 14: 706-720. Myers, S., and N. Majluf. 1984. Corporate financing and investment decisions when firms
Permana, R. 2005. Analisis struktur modal pada perusahaan non-financial yang tercatat di Bursa Efek Jakarta selama tahun 2000-2002. Thesis, Unpublished. Program Pascasarjana Ilmu Manajemen FEUI.
Pongsatat, S., J. Ramage, and H. Lawrence. 2004. Bankruptcy prediction for large and small firms in Asia: A comparison of Ohlson and Altman. Journal of Accounting and Corporate Governance 1 (2): 1-13.
Purba, S. D. 2001. Analisis leverage operasi dan faktor-faktor yang berhubungan dengan struktur modal. Thesis, Unpublished. Program Pascasarjana Ilmu Manajemen FEUI.
Rajan, R. G., and L. Zingales. 1995. What do we know about capital structure? Some evidence from international data. Journal of Finance 50 (5): 1421–1460.
Rajan, R. G., H. Servaes, L. Zingales. 2000. The cost of diversity: The diversification discount and inefficient investment. Journal of Finance 55: 35-80.
Rubin, P. H. 1990. Managing Business Transaction. The Free Press, New York.
Shapiro, A. C. 1978. Financial structure and the cost of capital in the multinational corporation. Journal of Financial and Quantitative Analysis: 455-480.
Shyam-Sunder, L., and S. Myers. 1999. Testing static trade-off against pecking prder models of capital structure. Journal of Financial Economics 51: 219-244.
Singh, H., and A. Nejadmalayeri. 2004. Internationalization, capital structure, and cost of capital: Evidence from French corporations. Journal of Multinational Financial Management 14: 153-169.
Stulz, R. 1990. Managerial discretion and optimal financing policies. Journal of Financial Economics 26: 3-27.
Tahirman. 2000. Faktor-Faktor yang mempengaruhi struktur modal dengan analisis tingkat hutang (debt ratio) pada perusahaan go-public di BEJ. Thesis, Unpublished. Program Pascasarjana Ilmu Manajemen FEUI.
Tambunan, T. 2006. Iklim Investasi di Indonesia: Masalah, Tantangan dan Potensi. Kadin-Indonesia-Jetro. www.kadin-indonesia.or.id/enm/images/dokumen/KADIN-98-1579-02032007.pdf
Titman, S., and R. Wessels. 1988. The determinants of capital structure choice. Journal of Finance 43 (1): 1-19.
Tong, G., and J. C. Green. 2005. Pecking order or trade-off hypothesis? Evidence of the capital structure of Chinese firms. Taylor and Francis Journals 37 (19): 1-14. Vera, R., L. Tobing, and A. Ibad. 2005. Perbedaan struktur pendanaan perusahaan
multinasional dan domestik di Indonesia. Jurnal Manajemen dan Bisnis 12 (2) (Juni). Weisbach, M. S. 1988. Outside directors and CEO turnover. Journal of Financial
Econom-ics 20: 431-460.
Yuliati, S. H., and H. Prasetyo. 1998. Dasar-Dasar Manajemen Keuangan Internasional (1st