Full Terms & Conditions of access and use can be found at
http://www.tandfonline.com/action/journalInformation?journalCode=cbie20
Download by: [Universitas Maritim Raja Ali Haji] Date: 18 January 2016, At: 21:42
Bulletin of Indonesian Economic Studies
ISSN: 0007-4918 (Print) 1472-7234 (Online) Journal homepage: http://www.tandfonline.com/loi/cbie20
Local government taxation: An analysis of
administrative cost inefficiency
Blane D. Lewis
To cite this article: Blane D. Lewis (2006) Local government taxation: An analysis of
administrative cost inefficiency, Bulletin of Indonesian Economic Studies, 42:2, 213-233, DOI: 10.1080/00074910600873666
To link to this article: http://dx.doi.org/10.1080/00074910600873666
Published online: 20 Aug 2006.
Submit your article to this journal
Article views: 182
View related articles
ISSN 0007-4918 print/ISSN 1472-7234 online/06/020213-21 © 2006 Indonesia Project ANU DOI: 10.1080/00074910600873666
LOCAL GOVERNMENT TAXATION:
AN ANALYSIS OF ADMINISTRATIVE COST INEFFICIENCY
Blane D. Lewis* The World Bank, Jakarta
Local governments in Indonesia administer taxes ineffi ciently. The average cost of
local tax administration as a percentage of revenue generated is estimated to be over 50%. There is, however, a wide variation in administrative ineffi ciency across
local governments. The estimation of a stochastic cost frontier model suggests that administrative cost ineffi ciency increases signifi cantly as fi scal transfers from the
centre rise; the investigation also demonstrates that local governments with elected executives are no more administratively cost effi cient than those with appointed
heads. The simple and complex measures of cost ineffi ciency yield broadly
simi-lar results concerning the level and variation of ineffi ciency across local
govern-ments, but can offer signifi cantly different estimates of the relative ineffi ciency of
individual local governments. This poses a dilemma for the central government in monitoring and evaluating local government tax administration performance.
INTRODUCTION
Tax administration is concerned with identifying taxpayers, assessing tax liabil-ity, collecting taxes and enforcing tax payment. Its main objective is to produce the desired amount of public revenue at minimum cost, all other things remain-ing the same (Mikesell 1982). Applied analysis of the tax administrative perform-ance of governments typically focuses on realisations and/or costs (Berne and Schramm 1986). The former concentrates on the extent to which generated rev-enues approach potential or desired levels, and the latter on the degree to which costs have been minimised—i.e. the cost effi ciency of tax administration.
This paper examines the cost effi ciency of tax administration by kabupaten and
kota (districts and municipalities, or local governments). The investigation consid-ers two approaches to estimating administrative cost effi ciency. The fi rst is based
on a straightforward indicator—the cost-to-yield ratio (i.e. cost of tax administra-tion divided by tax revenue). The measure is common in applied work, owing to its simplicity and the general availability of relevant data (McMaster 1991). The
* The author is Senior Adviser for Fiscal Decentralization at the World Bank in Jakarta un-der fi nancing from the Dutch Trust Fund (TF050378). The views expressed here are those
of the author and should not be attributed to the World Bank or the government of the Netherlands. The author would like to thank Indonesia’s Ministry of Finance for access to data, Guenther Schultz for useful comments on an earlier draft of the paper, and the editor and two anonymous referees for constructive criticism.
second approach derives from the specifi cation and estimation of a stochastic cost
frontier regression model. This method is theoretically more rigorous than the simple approach, and allows for the simultaneous testing of some hypotheses about the determinants of administrative ineffi ciency.
Stochastic frontier models have traditionally focused on exploring questions related to effi ciency of private production (Kumbhaker and Lovell 2000). A
lim-ited number of studies have, however, used stochastic frontier methods to ana-lyse public sector phenomena. De Borger et al. (1994), for example, appraise the general technical productivity of municipalities in Belgium via stochastic frontier methods. And Sakata (2004) employs a stochastic cost frontier approach to study the effi ciency of local government fi re protection services in Japan. The present
examination appears to be the fi rst to apply stochastic frontier techniques to
ques-tions related to public tax administrative effi ciency.
The particular objectives of this paper are to establish some initial ideas about local government tax administrative effi ciency and to develop preliminary notions
about the viability of different measures of cost ineffi ciency. The paper proceeds
as follows. First, some background on local taxation in Indonesia is presented with a view to offering a rationale for the analysis that follows. Second, sources and yields of local revenue are reviewed and the role of local governments in rev-enue administration is described. Third, some initial empirical results on the cost of administering local taxation, using the cost-to-yield measure of ineffi ciency, are
presented. Fourth, the stochastic cost frontier model is developed and the hypoth-eses to be tested are fully detailed. Fifth, the econometric model is estimated and the derived results are discussed. Sixth, the simple (i.e. cost-to-yield ratio) and complex (i.e. stochastic cost frontier) measures of cost ineffi ciency are compared
and contrasted. The fi nal section of the paper summarises the main conclusions
of the study and draws attention to some problems in the analysis of local tax administrative effi ciency in Indonesia.
BACKGROUND
Local government own-source revenue is quantitatively unimportant in local budgets. In 2003, own-source taxes and charges made up less than 8% of total local revenue. As such, the interest in examining local tax administrative effi ciency
may perhaps seem odd at fi rst. However, the signifi cance of local own-source
rev-enue might well change in the future, if the central government decides to award additional tax authority to local governments, as has been advocated by many analysts (Lewis 2003a). Apart from possible changes in control over local sources of revenue, the interest in local government tax administration is motivated by at least four facts.
First, as is well known, local governments were given the authority to create their own taxes and charges under the government’s decentralisation program, whose implementation began in 2001.1 Since that time, local governments have apparently established new revenue instruments in a rather aggressive manner.
1 See Undang-Undang 34 Tahun 2000 tentang Perubahan atas Undang-Undang 18 Tahun 1997 tentang Pajak dan Retribusi Daerah [Law 34/2000 concerning the Revision to Law 18/1997 on Regional Taxes and Charges].
An early study estimated that just under 1,000 new taxes and charges were cre-ated by local governments in the run-up to and during the fi rst year of
decen-tralisation (Lewis 2003b). More recent work indicates that local governments may have established as many as 6,000 new taxes and charges during the period 2000 through mid-2005 (LPEM–FEUI 2005).2
Second, local governments seem to have created many of their offi cial new
revenue instruments in an extra-legal manner. Lewis (2003b) estimated that only about 40% of the newly established taxes and charges in 2000–01 were submit-ted to the central government for review and evaluation, as required by law. The remainder were presumably implemented directly via local by-laws, without cen-tral government appraisal and therefore contrary to applicable legislation.
Third, the conventional wisdom in Indonesia is that many of the newly estab-lished local revenue instruments have proven to be economically harmful (Barnes et al. 2005). The Survey of Regional Investment Attractiveness carried out by Regional Autonomy Watch (Komite Pemantauan Pelaksanaan Otonomi Daerah, KPPOD) in 2003 (Regional Autonomy Watch 2003) suggested, for example, that private businesses fi nd that local tax regimes, in general, constrain investment
and other entrepreneurial activities. An often mentioned specifi c problem relates
to restrictions on inter-regional domestic trade evidently imposed by many local government taxes and charges (Ray 2001).
Fourth, corruption related to local taxation has become more than a little appar-ent under decappar-entralisation. One concern has been the increased formation of strictly unoffi cial and illegal local levies, the payment of which does not produce
any revenue at all for local government budgets (Von Luebke 2005). Another issue relates to the bribery of local offi cials that occurs in connection with legitimate
taxation (which does generate some local government revenue). Kuncoro (2004) argues that the proliferation of offi cial local taxes and charges under
decentralisa-tion has been accompanied by an increase in the bribing of local offi cials by
busi-nesses. He shows that such bribery signifi cantly increases business compliance
costs, while at the same time reducing tax revenue for local governments.
The assertive and occasionally unsanctioned (by central government) creation of offi cial new local revenue instruments, many of which are believed to have
had a negative impact on local economies, along with the establishment of illegal levies and other corrupt practices related at least to some local taxation, naturally stimulates interest in examining local government tax administration in general.
As a result of the above local tax phenomena, and of other perceived weak out-comes related to decentralisation, interest in evaluating the performance of local governments has intensifi ed; for example, the president has recently charged the
National Development Planning Agency (Bappenas) with coordinating the devel-opment of a system to monitor and evaluate local government performance across
2 A caveat is in order with regard to the fi gure of 6,000 ‘new taxes and charges’. This
actu-ally represents the number of new tax and charge by-laws (peraturan daerah, or perda) issued during the period 2000 through mid-2005. Some of these new perda undoubtedly were written in order to change the tariffs and/or bases of existing taxes and charges, as allowed by Law 34/2000. That is, the new perda did not in all cases authorise new tax and charge instruments. As such, the quoted fi gure might best be thought of as an upper bound on the
number of newly established revenue sources.
a wide range of indicators. One aspect of performance that the centre has expressed interest in assessing is the effi ciency of own-source revenue administration. An early
proposal of signifi cance in the current context was to use the cost-to-yield ratio to
monitor local government administrative cost effi ciency over time, and to evaluate
the relative administrative cost performance of individual local governments.
LOCAL REVENUE AND REVENUE ADMINISTRATION Local revenue
Local government own-source revenue in Indonesia comprises local taxes, user charges and fees, and various other types of revenue. The main local taxes include those on electricity, hotels, restaurants, mining, advertising, entertainment and park-ing.3 The central government defi nes tax bases and determines maximum rates; local
governments may set tax rates at any level up to these maxima. The most signifi cant
charges are those for health services provided by local public clinics (puskesmas), for the issue of building permits, and for public market licences. The central govern-ment provides guidelines for establishing user charges and fees; local governgovern-ments have authority to determine charges and fees based on the guidelines. Other own-source revenue includes that generated by local government enterprises (especially water authorities) and interest income on unspent balances.
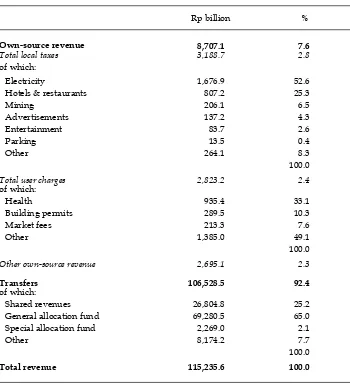
Table 1 shows local government own-source revenue by category for 2003.4 Each of the three main types of local revenue—taxes, charges and ‘other’—con-tributes roughly the same amount to total own-source revenue. The table also shows the relative importance of individual items in each own-source revenue category. Own-source revenue makes up less than 8% of total local government revenue; revenue budgets are dominated by intergovernmental transfers, which account for slightly more than 92% of total local fi scal resources.
The table also shows the relative importance of various categories of transfers. Revenue sharing (property tax, income tax and natural resource revenues), the general allocation fund (Dana Alokasi Umum, DAU), the special allocation fund (Dana Alokasi Khusus, DAK), and other transfers (emergency funds from the cen-tre and grants from provinces) account for about 25%, 65%, 2% and 8% of total intergovernmental transfers, respectively.5 A transfer of special signifi cance in the
current context is shared property tax revenue. Total property taxes were about Rp 10.0 trillion in 2003, about Rp 7.5 trillion of which were transferred to local governments. While property tax transfers are small relative to total transfers, such revenue is important in the context of local government tax administration, as will be seen below.
3 These are the so-called ‘positive list’ taxes, that is, those that are explicitly enumerated in Law 34/2000 as allowable.
4 All data used in this paper are from the Ministry of Finance Regional Financial Informa-tion System. The Ministry of Finance has generously provided the author with access to these data.
5 See Lewis (2002) for detailed descriptions of the various kinds of intergovernmental transfers, including allocation methods, and Lewis (2005) for an examination of the impact of transfers on local government spending, own-source revenue generation, and savings.
Revenue administration6
The local government agency charged with revenue administration is the Dinas Pendapatan Daerah (the Regional Revenue Offi ce, DiPenda). The DiPenda
typi-cally comprises departments for general affairs (agency administration); planning (own-source revenue forecasting); data collection (taxpayer identifi cation, tax
lia-bility assessment and enforcement of tax payment); and billing and recording (tax billing, tax collections and tax revenue recording). The head of each department reports to the director of the agency who, in turn, answers to the executive. The
6 This section of the paper draws heavily on Oosterman (2004). TABLE 1 Local Government Revenue, 2003
Rp billion %
Own-source revenue 8,707.1 7.6
Total local taxes 3,188.7 2.8
of which:
Electricity 1,676.9 52.6
Hotels & restaurants 807.2 25.3
Mining 206.1 6.5
Advertisements 137.2 4.3
Entertainment 83.7 2.6
Parking 13.5 0.4
Other 264.1 8.3
100.0
Total user charges 2,823.2 2.4
of which:
Health 935.4 33.1
Building permits 289.5 10.3
Market fees 213.3 7.6
Other 1,385.0 49.1
100.0
Other own-source revenue 2,695.1 2.3
Transfers 106,528.5 92.4
of which:
Shared revenues 26,804.8 25.2
General allocation fund 69,280.5 65.0 Special allocation fund 2,269.0 2.1
Other 8,174.2 7.7
100.0
Total revenue 115,235.6 100.0
Source: Ministry of Finance Regional Financial Information System.
structure and function of the DiPenda (and of other local government offi ces)
is regulated by the central government, and there appears to be little variation across local governments.7
The DiPenda administers all local taxes except the electricity tax, which is man-aged by the National Electricity Company (Perusahaan Listrik Nasional, PLN). It performs a minor role (mainly revenue planning and recording) in administer-ing local user charges, which for the most part are overseen by local government technical implementing units (Unit Pelaksana Teknis Dinas, UPTD). The DiPenda provides no administrative support for ‘other’ types of local government own-source revenue as defi ned above. However, it does play a small part (assistance
with property identifi cation, liability assessment and billing) in administering the
property tax, which is otherwise managed by deconcentrated offi ces of the
Minis-try of Finance’s Directorate General of Taxation.8
Local government tax administration is, in general, very labour intensive. The number of DiPenda employees varies quite considerably across local governments. While small rural local governments may employ only around 50 civil servants, large cities such as Medan and Surabaya may engage several hundred full-time staff. Few DiPenda have made use of standard information technologies in the administration of taxes. A computerised tax administration system that was estab-lished by the Ministry of Home Affairs in some of the larger local governments in the early 1990s no longer appears to function anywhere (Oosterman 2004).
PRELIMINARY INDICATION OF
ADMINISTRATIVE COST INEFFICIENCY
As noted at the outset of the paper, a frequently used measure of local govern-ment administrative cost ineffi ciency is the cost of tax administration divided by
revenue generated—the cost-to-yield ratio. All other things being equal, as the cost-to-yield ratio rises, local governments are seen as increasingly cost ineffi
-cient as regards revenue administration. The measure is standard in applied work owing to its straightforward character and the usual availability of relevant data with which to estimate it.
The most recent available data on DiPenda costs and on local government rev-enue associated with DiPenda operations are for 2003. Cost data include those related to personnel, materials, operations and maintenance, travel, and other (unspecifi ed)
costs.9 As noted above, not all local government own-source revenue is fully admin-istered by the DiPenda, and at the same time it has some administrative responsibil-ity for the central property tax. Therefore some assumptions need to be made with regard to revenue associated with DiPenda operations. In this paper, such revenue is taken to be all local tax revenue except for that from the electricity tax, plus 25% of local user charge revenue, plus 25% of property tax collections. The latter two per-centages are based on recent case study research (Oosterman 2004), the goal of which
7 The DiPenda does not set local tax policy; its functions are purely administrative. 8 Deconcentrated offi ces are divisions of central government departments; that is, they
are not part of decentralised regional administrations.
9 The data are available for 224 of the 348 local governments that existed in 2003.
was to determine local responsibilities over various taxes and associated costs, and to ascertain methods to improve administrative performance. Revenue as defi ned just
above is termed ‘local revenue’ throughout the remainder of the paper.
The data described above can be used to generate a preliminary measure of local government tax administrative cost ineffi ciency. The appropriate calculation shows
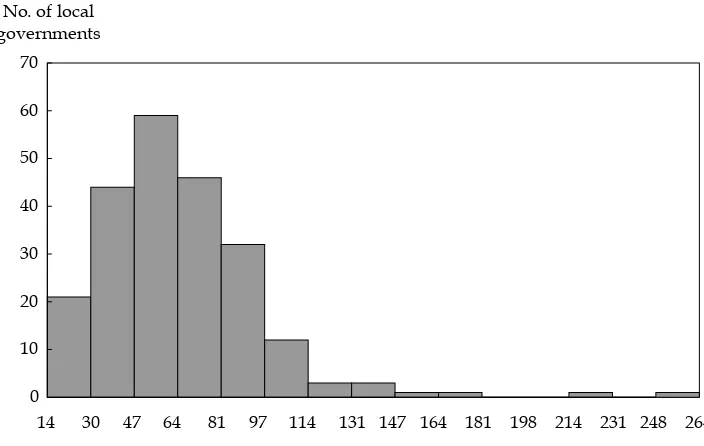
that the overall cost-to-yield ratio of DiPenda operations across all local govern-ments is 53%. The ratio ranges from a low of 14% to a high of 264%.10 About 10% of the local governments in the sample have cost-to-yield ratios that exceed 100%, indicating that the costs of administration are greater than the revenue collected. The strikingly large cost-to-yield ratios are, in part, a function of assumptions about what constitutes ‘local revenue’. But even under more generous assumptions, the overall cost-to-yield ratio is still relatively large. Suppose, for example, local revenue were defi ned as total local taxes (minus the electricity tax) plus total user charges
plus 25% of the property tax; under these assumptions, the average cost-to-yield ratio would be about 32%. And if local revenue were taken to be total local taxes (less electricity tax) plus total local charges plus total property tax, the average cost-to-yield ratio would be approximately 20%.Figure 1 presents a histogram showing the size distribution of the cost-to-yield ratios of local governments.
10 By comparison, cost-to-yield estimates from the United States range from less than 1% for most local taxes to around 1.5% for the property tax (Mikesell 1982). The US cost-to-yield ratio is defi ned as administrative cost divided by revenue net of cost, however.
Using this defi nition to make the fi gures comparable, the overall cost-to-yield ratio for
local governments in Indonesia becomes as high as 110.5%. Source: As for table 1.
FIGURE 1 Histogram of Cost-to-Yield Ratios of Local Governments, 2003
0 10 20 30 40 50 60 70
14 30 47 64 81 97 114 131 147 164 181 198 214 231 248 264 No. of local
governments
Cost-to-yield ratio (%)
One problem with the cost-to-yield ratio as a measure of local government administrative ineffi ciency is that it does not account for differences in prices or
other conditions faced by local governments. Input prices are typically higher in Eastern Indonesia than they are in Java, for example; all other things (i.e. ‘cost effi
-ciency’) being equal, the cost of local government tax administration in Eastern Indonesia relative to revenue generated would exceed that for local governments in Java because of those higher input prices. Differences in tax rates and economies of scale might also infl uence the cost-to-yield ratio independently of
considera-tions related to pure cost effi ciency.11 All else being the same, local governments that employ higher tax rates will have lower cost-to-yield ratios, and if economies of scale in tax administrations obtain, then local governments with more popu-lous jurisdictions will also have lower cost-to-yield ratios. Beyond incorporating such factors into a measure of ineffi ciency, one would also want to explain
vari-ation in relative ineffi ciencies across local governments. The next section of the
paper develops a method for addressing both these questions simultaneously.
MODELLING COST INEFFICIENCY IN TAXATION
This section of the paper employs a stochastic cost frontier model to develop a preferred measure of administrative cost ineffi ciency and to explain variation
in ineffi ciency across local governments. The model is based on the underlying
assumption that the objective of local governments is to minimise administra-tive costs associated with producing a given level of output (which is taken to be local revenue—see below). The minimum stochastic cost frontier comprises a systematic component, c(x, β), and a local government-specifi c idiosyncratic (i.e.
random) element, v. The model posits that deviations from the minimum stochas-tic cost frontier, given by c(x, β) +v, are a function of local government ineffi ciency,
u.
More formally, the model is:
ci=ββ'xi+vi+ui, (1)
where c is the total administrative cost of revenue generation, x is a vector of explanatory variables, β is a vector of parameters to be estimated in the cost func-tion, v and u together form the disturbance term (discussed below), and i is a sub-script denoting the particular local government. All variables other than dummy variables are measured in natural logarithms.
Explanatory variables in x include local revenue—or output, in the traditional cost function framework. It would be preferable, of course, to defi ne output as a
strict function of local government (DiPenda) administrative tasks, such as
iden-11 Any variation in legal authorities and processes across local governments might also, in theory, infl uence cost-to-yield ratios (independently of changes to effi ciency). In Indonesia,
however, most local governments operate within the same legal and regulatory environ-ment. The exceptions are those in Aceh and Papua, which have special fi scal arrangements
with the central government. These exceptional provisions are concerned mainly with the amount of intergovernmental transfers received from the centre, however, and are not like-ly to affect directlike-ly the cost of local tax administration or the local revenue generated.
tifi cation of taxpayers, assessment of tax liability, and tax collection, rather than
revenue generated. There are no comprehensive data, however, on how well local governments execute administrative tasks related to revenue generation.
The rationale for using local revenue as a proxy for output is as follows. Local revenue is a function of the local government’s performance of administrative functions, the tax rate, and the tax base, across the mix of taxes it employs.12 As noted above, the central government fi xes maximum rates for local taxes, and
local governments have discretion in setting tariffs at levels up to these ceilings. In practice, most local governments appear to set tariffs at or near maximum rates.13 The centre defi nes local tax bases in a uniform manner across all local
governments, although the size of individual tax bases varies across local gov-ernments, of course. Perhaps the most infl uential factor in determining the size
of the local tax base is the local economic base (Bahl and Linn 1992). The model developed here controls for the size of the economic base as well as for the mix of taxes employed, as will be made clear later. Because tax rates vary insignifi cantly
and tax bases are defi ned uniformly across local governments, and because the
econometric model employs variables to control for variation in the size of local economic bases and the mix of taxes used, it would seem reasonable to use local revenue as a proxy for administrative output. In any case, this is the best that can be done given the data available .
It might be useful to note that the simple cost-to-yield measure of administra-tive cost ineffi ciency also implicitly assumes that revenue is a reasonable proxy
for output. The ratio does not, however, account for variation in relative prices across local governments, nor does it control for differences in the size of tax bases or the mix of taxes employed among districts and municipalities, as the stochastic frontier model developed here does. The latter at the very least would seem to represent an advance over the simple measure, therefore.14
Local revenue is defi ned in the same manner as earlier described in the context
of calculating the cost-to-yield ratio. It is expected that the cost of tax administra-tion grows as local revenue generated increases.
Other variables in x include wages and the prices of other inputs. Wages are measured by average civil servant wages, which are estimated for each local gov-ernment by dividing the total annual local govgov-ernment wage bill by the number of civil servants employed by the local government. The price of other inputs is proxied by an index developed by Ministry of Finance offi cials, who constructed
the measure with a view to capturing cost differentials faced by local governments.
12 Note that corruption related to offi cial taxation may infl uence local government
per-formance of any of the administrative functions—tax coverage, tax liability assessment, tax collection—and the amount of (offi cial) revenue generated. Owing to lack of data, the
impact of corruption on administrative performance and revenue generation cannot be incorporated into this analysis.
13 Similarly, there appears to be little variation in levels of major charges across local governments (Barnes et al. 2005). In addition, property tax rates are fi xed at uniform levels
across districts and municipalities (Lewis 2003a).
14 Finding good measures of local public sector output for use in empirical studies like the present one is a common and particularly vexing problem (Grosskopf and Yaisawarng 1990; Sakata 2004).
Price homogeneity in the cost function is imposed by dividing administrative cost and civil servant wages by the regional (i.e. district or municipality) price index. It is expected that administrative costs rise along with (relative) civil servant wages.
In addition, x controls for the size of the economic base in local jurisdictions. In general, the local economic base is a function of local population and incomes or output (Bahl and Linn 1992). Thus population15 and gross regional domestic product (GRDP) are incorporated in x. Finally, x includes a variable denoting the level of urbanisation in the local jurisdiction, and a location dummy variable (on- or off-Sumatra) with a view to controlling for the mix of taxes used by local gov-ernments. The number and kinds of taxes local governments employ obviously depend on the structure of their economies; the latter is associated with the level of urbanisation, among other things. And it has been shown elsewhere that local governments on Sumatra have been more aggressive in creating new revenue instruments than those elsewhere; as such it might be expected that the former employ a different mix of taxes than do other districts and municipalities (Lewis 2003b). There are no particular expectations about the directions of infl uence of
the control variables on administrative cost. Table 2 provides a precise defi nition
of the explanatory variables discussed above, and appendix table A gives basic summary statistics for the variables enumerated and defi ned in table 2.
As already mentioned, the disturbance term is made up of two (independent) components: v and u. The former is a normally distributed error term, represent-ing positive or negative local government-specifi c idiosyncratic cost effects (i.e.
random noise). The second component of the disturbance term, u, comprises posi-tive deviations from minimum cost, and can be taken as a measure of local gov-ernment administrative cost ineffi ciency.
The two disturbance terms can be defi ned more precisely:
vi~N 0[ ,σv2] (2)
ui~ [Nαα'zi,σu2] (3)
and
ui=αα'zi+wi (4)
where z is a vector of independent variables that explain cost ineffi ciency across
local governments, αis a vector of parameters to be estimated, and w is truncated normal so that u≥ 0. The model as laid out above is based on a long line of research, including that of Aigner et al. (1977); Stevenson (1980); Reifschneider and Stevenson (1991); Huang and Liu (1994); and Battese and Coelli (1995). Kumbhaker and Lovell (2000) provide a thorough review of the research on stochastic frontier models.
Explanatory variables in z include per capita transfers (net of property tax allocations) from the central government (and its square) and a dummy variable indicating whether the head of the local government was elected by the local par-liament or appointed by the central government (see table 2 for precise defi
ni-15 The use of population also helps control for possible economies of scale in tax admin-istration.
tions). The variables that form z have been chosen with a view to testing two main hypotheses.
The fi rst hypothesis concerns the relationship between administrative effi ciency
and fi scal transfers from the centre. As noted at the outset of the paper, local
gov-ernment revenue is dominated by transfers from the central govgov-ernment. The relative importance of transfers in budgets varies signifi cantly across local
gov-ernments, however; intergovernmental transfers range from about 50% to 99% of total revenue budgets across all districts and municipalities in Indonesia.16
It is posited here that local governments view transfers as a ‘free good’, and are therefore relatively unconcerned with their effi cient use. More specifi cally, it
is hypothesised that increasing per capita transfers are associated with growing administrative cost ineffi ciency, all other things being equal. If this were to be
the case, then one would expect per capita transfers to be positively related to the ineffi ciency variable. The square of per capita transfers is also included in the
specifi cation in order to capture any (quadratic) non-linearity in the relationship
between per capita transfers and ineffi ciency.
16 Local revenue in kabupaten Badung (Bali), much of which is derived from tax revenue from tourist resorts, comprises 50% of total revenue. If Badung is excluded, local revenue ranges from 1% to 30% of total revenue across local governments. Badung has been dropped from the present analysis, owing to lack of data on other variables. For local governments in the sample, local revenue varies from about 1% to 25% of total revenue.
TABLE 2 Variable Names and Defi nitions for the Cost Frontier Model
Variable Name Description
COST Log of total administrative cost of DiPenda divided by Ministry of Finance regional price index
Explanators of cost
OUTPUT Log of local government own-source revenue administered by DiPenda
WAGE Log of local government average wage divided by Ministry of Finance regional price index
GRDP Log of gross regional domestic product for local government jurisdiction
POP Log of population
URBAN Log of percentage of the population that is urban SUMA Dummy variable for local government location (= 1 if in
Sumatra, otherwise 0) Explanators of ineffi ciency
XREVPC Log of per capita central transfers (net of property tax) XREVPCSQ Log of per capita central transfers (net of property tax)
squared
DEMO Dummy variable for head of local government (= 1 if elected by local parliament, otherwise 0)
The second hypothesis has to do with Indonesia’s fl edgling local democracy. As
of 2003, about 60% of local governments were managed by heads elected by local parliaments, and about 40% by heads appointed by the centre.17 It is commonly assumed in Indonesia and elsewhere that local governments with democratically elected heads are better governed than those whose executive has been appointed in some manner. Accordingly it is hypothesised here that local governments with elected heads are more cost effi cient as regards revenue administration than those
with appointed heads. The relevant dummy variable takes on a value of one if the local government head was elected, and zero if he or she was appointed by the central government. If local governments are better managed by elected heads, the dummy variable should be negatively related to the ineffi ciency variable.18
COST MODEL ESTIMATION
AND DISCUSSION OF EMPIRICAL RESULTS
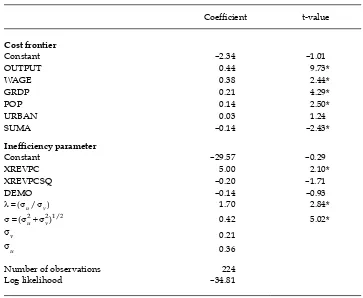
The cost frontier model as represented in equations 1–4 is estimated by maximum likelihood techniques.19 Table 3 presents the regression results.20
The table shows that both local government output (revenue) and civil serv-ant wages are signifi cant and positive determinants of administrative cost, as
expected. The elasticities of cost with respect to output (revenue) and wages are 0.44 and 0.38 respectively. As noted above, the other right-hand side variables in the cost equation (GRDP, population, urbanisation and location) are included to control for the economic base and the mix of revenue instruments employed by local governments. The evidence shows that GRDP and population are both sig-nifi cantly and positively associated with cost. The examination also demonstrates
that local governments on Sumatra have lower administrative costs than those located elsewhere. Finally, the analysis indicates that the urbanisation level of the local jurisdiction is not signifi cantly related to the cost of tax administration at
generally accepted levels of signifi cance.21
A key concern of the regression analysis is to explain cost ineffi ciency across
local governments. Table 3 shows that ineffi ciency is signifi cantly and positively
related to per capita intergovernmental transfers (XREVPC in table 3); the
rela-17 Of the 224 local governments in the sample used in this analysis, 139 (62%) were managed by elected heads in 2003, while 85 (38%) were still governed by appointed heads.
18 The appendix tests the model specifi cation detailed here for a variety of underlying
assumptions. The analysis shows that the specifi cation used in the present examination is
a reasonable one.
19 Maximum likelihood estimations were performed using LIMDEP econometric software; see Greene (2002) for a detailed explanation of methods. In addition to the truncated normal model employed here, LIMDEP allows for the use of half-normal, gamma and exponential stochastic frontier model specifi cations. These other models were also tried. Estimation
results were very similar under all four models. The conclusions reached here are robust with regard to choice of model.
20 λand σ are estimated directly via the maximum likelihood procedures. The standard deviations of the two error terms are derived from the estimated values of λand σ. 21 The insignifi cance of the urbanisation variable may at least in part be due to its strong
collinearity with other variables, especially local revenue and GRDP.
tionship between ineffi ciency and transfers squared (XREVPCSQ) is not
statisti-cally signifi cant at conventional levels. The results support the hypothesis that
local government tax administration is increasingly cost ineffi cient as transfers
from the centre rise.
The Indonesian system of intergovernmental transfers has not been designed to encourage improvements in local government performance of any kind. On the contrary, some rather clear performance disincentives are apparent in the trans-fer system. Transtrans-fers have traditionally been used, for example, to fund at least part of the local government wage bill, without fi rm restrictions being placed on
hiring. This design encourages over-staffi ng in general, and arguably helps to
explain the positive association between transfers and cost ineffi ciency found in
the analysis here.22
22 Lewis (2002) discusses performance disincentives in the Indonesian transfer system. Starting in 2002, 50% of DAU funds were allocated to cover local civil servant salaries. From 2006, the central government has decided to cover 100% of the local public sector wage bill from the DAU, thus further weakening incentives to rationalise local public sector employment.
TABLE 3 Cost Frontier Model Regression Outputa
Coeffi cient t-value
Cost frontier
Constant –2.34 –1.01
OUTPUT 0.44 9.73*
WAGE 0.38 2.44*
GRDP 0.21 4.29*
POP 0.14 2.50*
URBAN 0.03 1.24
SUMA –0.14 –2.43*
Ineffi ciency parameter
Constant –29.57 –0.29
XREVPC 5.00 2.10*
XREVPCSQ –0.20 –1.71
DEMO –0.14 –0.93
λ σ=( u/σv) 1.70 2.84*
σ=(σu2+σv2 1 2)/ 0.42 5.02*
σv 0.21
σu 0.36
Number of observations 224
Log likelihood –34.81
a See table 2 for an explanation of the variables.
* Coeffi cient is statistically signifi cant at the 5% level.
Finally, the examination shows that the method by which local government executives were chosen (DEMO) had no effect on administrative cost effi ciency.
Apparently, the structures of accountability that result from local parliaments’ election of local government executives in Indonesia are insuffi ciently robust
to engender more effi cient practices in tax administration. In mid-2005, citizens
began to elect heads of local government directly. It is expected that by the end of 2006 all local governments will have popularly elected executives. There is not yet, of course, any evidence about the extent to which this change has begun to lead to more accountable and effi cient local governments.
The above econometric results for the cost frontier model can be used to pro-duce estimates of the ineffi ciency parameter, u. The ineffi ciency parameter can be
approximated by the following expression due to Jondrow et al. (1982), as cited and described in Greene (2000) and Greene (2002).
E[ | ]u ε σλ normal probability density and cumulative distribution functions, respectively.
Ε[u⎪ε] is calculated by using estimated values of the underlying parameters on the right-hand side of equation 5, as derived in the frontier regression model and shown in table 3.
The estimates of u can be employed to provide an index of administrative cost ineffi ciency (CI) of individual local governments (Coelli et al. 1998; Sakata 2004).
The cost ineffi ciency index is given by:
CI c x u
where the numerator is the expected actual cost of tax administration and the denominator is the expected minimum or ideal administrative cost.23 Given the functional form of the cost function estimated here, it holds that:
CIi=exp( )ui . (7)
CI assumes a value between one and infi nity and indicates the degree to which
local government administrative costs exceed the minimum cost frontier, given revenue, prices and control variables. A histogram of the ineffi ciency index is
shown in fi gure 2. Note the skewed shape of the distribution of the index, which
23 Other analysts prefer to use an effi ciency index (Kumbhaker and Lovell 2000). The
effi ciency index is the inverse of the ratio shown on the right-hand side of equation 6. It
ranges in value from zero to one and indicates the extent to which actual cost approaches the ideal minimum cost.
φ
is similar to that of the simple cost-to-yield ratio shown in fi gure 1. The mean
value of the ineffi ciency index is 1.40 (median 1.34); the index values range from
1.10 to 3.06 (standard deviation 0.29). These fi gures indicate a generally high level
of cost ineffi ciency in local government tax administration and, at the same time, a
signifi cant variation in administrative performance across local governments.24
SIMPLE AND COMPLEX COST INEFFICIENCY MEASURES COMPARED
A question that naturally arises concerns the extent to which the cost-to-yield measure of ineffi ciency differs from the ineffi ciency index derived from the
sto-chastic cost frontier model. This may be especially important in the context of the central government’s monitoring and evaluation effort, as described at the outset of the paper. That is, it would be useful for government offi cials to know
the degree to which they might realistically rely on the simple measure of admin-istrative cost ineffi ciency, and whether instead they might need to develop other,
perhaps more sophisticated, measures. 25
24 By comparison, in an examination of the costs of providing fi re protection services in
Japanese local governments, Sakata (2004), using an empirical model similar to the one employed here, found an average ineffi ciency index of 1.09 and a range of index values
from 1.02 to 1.44 (with a standard deviation of 0.07).
25 In the analysis that follows, costs in the cost-to-yield ratio measure of ineffi ciency have
been divided by the Ministry of Finance price index, as was done in the cost frontier model. FIGURE 2 Histogram of Ineffi ciency Index of Local Governments, 2003
0 10 20 30 40 50 60 70 No. of local governments
1.1 1.2 1.3 1.5 1.6 1.7 1.9 2.0 2.1 2.3 2.4 2.5 2.7 2.8 2.9 3.1 Inefficiency index (%)
Source: As for table 1
As can be seen from fi gures 1 and 2, the shapes of the distributions of the
sim-ple and comsim-plex measures of ineffi ciency are reasonably similar. Pearson’s
cor-relation coeffi cient for the two measures is 0.726, which is signifi cant at the 1%
level. This suggests a reasonable degree of association between the simple and complex indices of ineffi ciency. Whether or not the two measures are suffi ciently
comparable depends at least in part on how they might be used.
The results here suggest that the simple measure might perhaps serve the gen-eral purpose of monitoring average local government capacity to administer taxes effi ciently, as well as the variation in administrative capacity across local
govern-ments.
But would the simple measure offer a good indication of a particular local gov-ernment’s administrative capacity? Since both parameters are best thought of as indicators of relative ineffi ciency, an initial answer to the question can be gleaned
by comparing local government rankings according to the two measures. The rel-evant calculation reveals a rank order correlation of 0.685, which is also statisti-cally signifi cant at the 1% level.
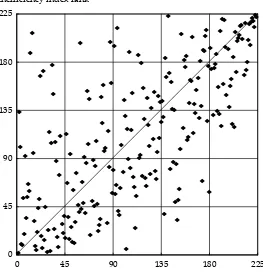
Figure 3 illustrates the relationship between rankings according to the ineffi ciency
index and rankings according to the cost-to-yield ratio across all local governments in the sample. The 45-degree line in the fi gure highlights where local governments
would fall if they had equivalent rankings by both measures. The general statistical FIGURE 3 Local Government Rank by Ineffi ciency Index and Cost-to-Yield Ratio, 2003
F
association between the two ranked indices notwithstanding, fi gure 3 demonstrates
quite signifi cant differences in the rankings across the two measures.
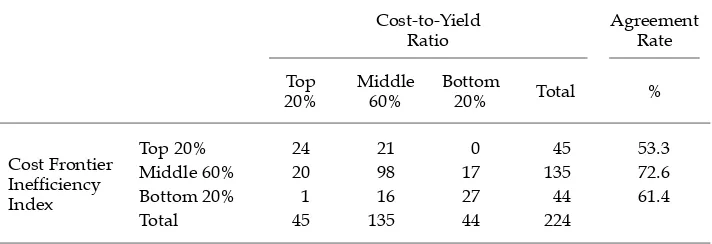
Perhaps the rankings might best be employed to place local governments in broad categories of performance. With a view to examining the possibilities of this approach, I use the rankings of local governments by the two measures to catego-rise them into groups representing the top 20% (the most cost effi cient), the middle
60%, and the bottom 20% (the least cost effi cient). Table 4 shows the distribution
of local governments by performance class according to the two measures. The far right column of the table shows the extent to which the two standards agree on group membership. As can be seen, only 53% of the top 20% of local gov-ernments by one measure are placed in the top 20% of performers by the other measure. The agreement rate, at 73%, is highest for the middle 60% of performers, as might be expected. About 61% of local governments in the lowest 20% of per-formers by one measure are placed in the same category by the other measure. In general, these results do not inspire confi dence in the use of the simple cost-to-yield
ratio as a measure of individual local government administrative performance.26
SUMMARY AND CONCLUSIONS
Local governments are, in general, very ineffi cient in matters related to tax
admin-istration. This paper estimates that the cost of administering local taxes and charges is over 50% of local tax and charge receipts. Results derived from the specifi
ca-tion and estimaca-tion of a stochastic cost frontier model support the conclusion that local government tax administration is, on average, ineffi ciently carried out.
Weak average performance notwithstanding, there seems to be considerable variation in the capacity of local governments to administer taxes effi ciently. Each
of the measures of ineffi ciency employed in this paper—the cost-to-yield ratio
and a cost frontier ineffi ciency parameter—demonstrates the existence of signifi
-cant deviation across local governments.
26 The general results reached here in respect of agreement rates do not change markedly when different categorisation schemes are used.
TABLE 4 Distribution of Local Governments by Performance Measures (no. of local governments)
Cost-to-Yield Ratio
Agreement Rate Top
20%
Middle 60%
Bottom
20% Total %
Cost Frontier Ineffi ciency
Index
Top 20% 24 21 0 45 53.3
Middle 60% 20 98 17 135 72.6
Bottom 20% 1 16 27 44 61.4
Total 45 135 44 224
Econometric evidence based on the implementation of the cost frontier model implies that local government tax administration becomes less cost effi cient as fi scal transfers from the centre increase. It is not surprising, perhaps, that local
governments with relatively abundant and largely untied transfers from the cen-tral government are comparatively unconcerned about the effi cient use of those
funds. There are no incentives to behave otherwise. The results in this paper strongly suggest that the central government needs to fi nd ways to integrate into
the system of intergovernmental transfers incentives that encourage improved administrative performance.
The investigation also fi nds that local governments with elected executives
are no more administratively cost effi cient than those with appointed heads. The
weak accountability arrangements that obtain from local parliaments’ election of local government heads in Indonesia are evidently inadequate to encourage more effi cient practices in tax administration. It is hoped that the recent nation-wide
launch of local popular elections may have more success in this regard, although it would be unwise to expect too much too soon, given the experience of other newly democratising countries.
The simple cost-to-yield measure and the stochastic frontier ineffi ciency
param-eter yield broadly similar results concerning the structure of administrative
inef-fi ciency across all local governments. But the simple and complex measures of
cost ineffi ciency may produce quite different estimates of the relative ineffi ciency
of individual districts and municipalities. This poses a dilemma for the central government in the context of monitoring and evaluating local tax administrative effi ciency. The simple measure is easy to calculate, but it may generate misleading
results for specifi c local governments. The complex measure leads to theoretically
more justifi able assessments, but it is diffi cult to envision the widespread use and
acceptance of such relatively complicated techniques in the policy environment in Indonesia (or anywhere, for that matter).
Another methodological issue is the inappropriateness of using local revenue as a proxy for administrative output. The development of more appropriate indi-cators of administrative output and the collection of data with which to operation-alise such measures would seem, therefore, to constitute an important element of the ongoing applied research agenda on local public fi nance and decentralisation
in Indonesia.
REFERENCES
Aigner, Dennis, Lovell, C.A Knox and Schmidt, Peter (1977) ‘Formulation and estimation of stochastic frontier production function models’, Journal of Econometrics 6 (1): 21–37. Bahl, Roy and Linn, Johannes (1992) Urban Public Finance in Developing Countries, Oxford
University Press, New York NY.
Barnes, Nicole, Sirait, Lisbon and Syadat, Anwar (2005) Study on regional taxes and charges, Research Triangle Institute, Jakarta, mimeo.
Battese, George and Coelli, Thomas (1995) ‘A model for technical ineffi ciency effects in a
stochastic frontier production frontier for panel data’, Empirical Economics 20: 325–32. Berne, Robert and Schramm, Richard (1986) The Financial Analysis of Governments, Prentice
Hall, Englewood Cliffs NJ.
Coelli, Thomas, Rao, D.S. Prasada and Battese, George E. (1998) An Introduction to Effi ciency and Productivity Analysis, Kluwer Academic Publishers, Norwell MA.
De Borger, B., Kernstens, K., Moesen, W. and Vanneste, J. (1994) ‘Explaining differences in productive effi ciency: an application to Belgian municipalities’, Public Choice 80: 339–58.
Greene, William (2000) Econometric Analysis, Prentice Hall International, Upper Saddle River NJ.
Greene, William (2002) LIMDEP Version 8 User’s Manual, Econometric Software Inc., Plain-view NY.
Grosskopf, Shawna and Yaisawarng, Suthathip (1990) ‘Economics of scope in the provision of local public services’, National Tax Journal 43: 61–74.
Huang, C. and Liu, T. (1994) ‘Estimation of a non-neutral stochastic frontier production function’, Journal of Productivity Analysis 5 (2): 171–80.
Jondrow, James, Lovell, C.A. Knox, Materov, Ivan and Schmidt, Peter (1982) ‘On the esti-mation of technical ineffi ciency in the stochastic frontier production function model’,
Journal of Econometrics 19 (2/3): 233–8.
Kodde, David and Palm, Franz (1986) ‘Wald criteria for jointly testing equality and ine-quality restrictions’, Econometrica 5: 1,243–8.
Kompas, Tom and Che, Tuong Nhu (2005) ‘Effi ciency gains and cost reductions from
indi-vidual transferable quotas: a stochastic cost frontier for the Australian south east fi
sh-ery’, Journal of Productivity Analysis 23: 285–307.
Kumbhaker, Subal and Lovell, C.A. Knox (2000) Stochastic Frontier Analysis, Cambridge University Press, Cambridge.
Kuncoro, Ari (2004) ‘Bribery in Indonesia: some evidence from micro-level data’, Bulletin of Indonesian Economic Studies 40 (3): 329–54.
Lewis, Blane (2002) ‘Indonesia’, in Intergovernmental Transfers in Asia: Current Practice and Chal-lenges for the Future, eds Paul Smoke and Y.H. Kim, Asian Development Bank, Manila. Lewis, Blane (2003a) ‘Property taxation in Indonesia: measuring and explaining
administra-tive (under-) performance’, Public Administration and Development 23 (3): 227–39.
Lewis, Blane (2003b) ‘Tax and charge creation by regional governments under fi scal
decentralisa-tion: estimates and explanations’, Bulletin of Indonesian Economic Studies 39 (2): 177–92.
Lewis, Blane (2005) ‘Indonesian local government spending, taxing, and saving: an explanation of pre- and post-decentralization fi scal outcomes’, Asian Economic Journal 19 (3): 291–317.
LPEM–FEUI (Institute for Economic and Social Research, Faculty of Economics, University of Indonesia) (2005) The impediments to doing business in Indonesia, Jakarta, mimeo. McMaster, James (1991) Urban Financial Management: A Training Manual, World Bank,
Washington DC.
Mikesell, John (1982) Fiscal Administration: Analysis and Applications for the Public Sector, Dorsey Press, Homewood IL.
Oosterman, Andre (2004) Improving local tax and service charge administration in Indo-nesia, World Bank, Jakarta, mimeo.
Ray, David (2001) An inventory of trade-distorting local regulations, USAID–PEG project, Ministry of Trade and Industry, Jakarta, mimeo.
Reifschneider, David and Stevenson, Rodney (1991) ‘Systematic departures from the fron-tier: a framework for the analysis of fi rm effi ciency’, International Economic Review 32
(3): 715–23.
Regional Autonomy Watch (2003) Regional investment attractiveness: a survey of business perceptions, Jakarta, mimeo.
Sakata, Masayo (2004) ‘A cost frontier approach for estimating the determinants of cost ineffi
-ciency in Japanese fi re protection management’, Journal of Asian Economics 15 (3): 579–90.
Stevenson, Rodney (1980) ‘Likelihood functions for generalized stochastic frontier estima-tion’, Journal of Econometrics 13 (1): 57–66.
Von Luebke, Christian (2005) Political economy of local business regulations: fi ndings on
local taxation and licensing practices from four district cases in Central Java and West Sumatera, Australian National University, Canberra, mimeo.
APPENDIX
Appendix table A provides summary statistics for the (untransformed) variables used in the econometric analysis. The data are presented for the sake of complete-ness and are not discussed.
The stochastic frontier model employed in this paper makes a number of inter-related assumptions about the specifi cation of ineffi ciency effects related to local
government tax administration. Various null hypotheses can be formed to test these assumptions. Kompas and Che (2005) provide an example of four basic hypothesis tests that can be performed. The tests they execute are relevant to the present examination and are replicated below.
The null hypotheses are: (1) ineffi ciency effects are absent; (2) expected
local government-specifi c effects are equal to zero; (3) expected local
govern-ment-specifi c effects are constant; and (4) ineffi ciency effects are
non-stochas-tic. The hypotheses are tested using generalised likelihood ratio methods, as per Kompas and Che (2005). As the latter note, the test statistic is given by LR = –2 * {ln[L(H0)] – ln[L(H1)]}, where ln[L(H0)] and ln[L(H1)] represent the values of the log likelihood function under the null and alternative hypotheses, respectively. (The value of the log likelihood function of the alternative hypoth-esis—i.e. the model used in the paper—is given in table 3 in the text.) Kodde and Palm (1986) demonstrate that the test statistic has a mixed χ2 distribution; the authors provide critical values that can be used to test the hypotheses.
Appendix table B provides the results. The fi rst two columns of the table show
the number and formal representation of the hypotheses described above. The remaining columns show the value of the log likelihood function, the value of the test statistic, the relevant critical value, and the decision regarding the null hypothesis, respectively.
APPENDIX TABLE A Summary Statistics for Variables Used in Model
Variable Unit Mean Std Dev. Minimum Maximum
COST Rp million 3,637 5,958 570 75,801 OUTPUT Rp million 8,744 14,636 1,604 139,700 WAGE Rp thousand 12,606 1,859 5,449 19,285 GRDP Rp billion 3,802 6,005 9,999 54,050 POP thousand 631.5 592.1 81.2 4,335.6
URBAN % 42.4 32.6 2.0 100.0
SUMA 0–1 dummy 0.25 0.43 0.00 1.00
XREVPC Rp thousand 629 608 158 4,390
XREVPCSQ Rp billion 763 2,113 9 19,271
DEMO 0–1 dummy 0.62 0.49 0.00 1.00
As the table shows, the values of the test statistic all exceed their respective critical values. As such, all the null hypotheses are rejected. The results suggest that ineffi ciency effects are important in the examination of local government tax
administration and that a stochastic approach to estimating those effects is valid. Otherwise put, this evidence lends support to the model specifi cation used in the
paper.
APPENDIX TABLE B Generalised Likelihood Ratio Tests
No. Null Hypothesis Log Likelihood
Test Statistic
Critical
Value Decision 1 γ = α0 = α1 = α2 = α3 = 0 –67.45 65.28 11.91 Reject H0 2 α0 = α1 = α2 = α3 = 0 –62.40 55.18 10.37 Reject H0 3 α1 = α2 = α3 = 0 –61.56 53.50 8.76 Reject H0 4 γ = 0 –49.09 28.56 5.14 Reject H0
Note: γ α= α +α u
2 u 2
v 2 / ( ).
The critical values are taken from Kodde and Palm (1986) and represent the 5% level of signifi cance.
Different Societies, Shared Futures
Australia, Indonesia and the Region
John Monfries
editor
Faculty of Asian Studies, The Australian National University
Australia’s relationship with Indonesia is one of its most important but contentious bilateral relationships, characterised by sharply differing social and cultural mores and by periodic crises and mutual distrust, but also by rich people-to-people contact in many fi elds.
Recent developments, including the tsunami crisis, the Corby affair and the policies of the new Indonesian president, have demonstrated the best and the worst in the relationship. Following the visit by President Yudhoyono in early 2005, offi cial relations are better than they have been for many years.
Australia’s management of its most important regional relationship interacts with and infl uences its other relations in the region, through issues such as Australia’s presence and role in regional organisations, and policy responses to the rise of China. This book examines the wide range of factors and approaches that can be involved in meeting the bilateral and regional challenges, including government links, public images and mutual perceptions, regional organisations, the role of Islam, the aid relationship, security and counterterrorism cooperation, economic and business relations, and the student relationship. The papers present a picture of a complex, many-sided relationship that is not susceptible to simplistic formulas or stereotypes.
Contributors
Richard Woolcott • S. Wiryono • K. Kesavapany • Paul Kelly Hugh White • Rizal Sukma • David Reeve • Isla Rogers-Winarto
Richard Chauvel • Scott Dawson • Noke Kiroyan Stephen Grenville • Jamie Mackie
2006 206 pages BM302
Soft cover: 981-230-386-3 S$29.90/US$19.90 Hard cover: 981-230-387-1 S$49.90/US$29.90
E-book and single chapters available at http://bookshop.iseas.edu.sg Publisher The Institute of Southeast Asian Studies, Singapore, in cooperation
with The Australian National University, Canberra
The Managing Editor Tel +65 6870 2447 Institute of Southeast Asian Studies Fax +65 6775 6259 30 Heng Mui Keng Terrace
Pasir Panjang Road e-mail pubsunit@iseas.edu.sg SINGAPORE 119614 http://bookshop.iseas.edu.sg Orders from the relevant territories should be sent to ISEAS’s distributors as follows: ASIA BOOKS Edith Rieger for Germany, Fax: 49 6223 72466; Eurospan for Europe, Fax 44 (0) 1767 601640; Inbooks for Australia/New Zealand, Fax 61 02 9986 7090. PT Javabooks for Indonesia, Fax 62 21 3293 3484; United Publishers Services for Japan for wholesale distribution, Fax 81 3 5479 7307. Orders from individuals in Japan should be placed with local booksellers specialising in foreign publications (in case of diffi culties, please contact ISEAS).