C-1
THE EFFECTS OF MICRO- AND NANOHYDROXYAPATITE APPLICATION IN METAL CONTAMINATED SOIL ON METAL ACCCUMULATION IN
IPOMOEA AQUATICA AND SOIL METAL BIOAVAILABILITY
Azlan Kamari 1,2, Norjan Yusof 3, Che Fauziah Ishak 4, Esther Phillip 5, Galuh Yuliani 6
1 Department of Chemistry, Faculty of Science and Mathematics, Universiti Pendidikan Sultan Idris, 35900, Tanjong Malim, Perak, Malaysia
2 Nanotechnology Research Centre, Faculty of Science and Mathematics, Universiti Pendidikan Sultan Idris, 35900, Tanjong Malim, Perak, Malaysia
3 Department of Biology, Faculty of Science and Mathematics, Universiti Pendidikan Sultan Idris, 35900, Tanjong Malim, Perak, Malaysia
4 Department of Land Management, Faculty of Agriculture, Universiti Putra Malaysia, 43400, Serdang, Selangor, Malaysia
5 Malaysian Nuclear Agency, 43000, Kajang, Selangor, Malaysia
6 Department of Chemistry, Universitas Pendidikan Indonesia, Jl. Dr. Setiabudi 229, Bandung, Indonesia
Abstract
The potential of microhydroxyapatite (MHA) and nanohydroxyapatite (NHA) to immobilise heavy metals in a 25-year old active firing range soil was investigated. The effects of immobilisation were evaluated in terms of metal accumulation in water spinach (Ipomoea aquatica) and soil metal bioavailability. A pot trial was conducted by amending firing range soil with MHA and NHA at application rates of 0%, 1% and 3% (w/w). Both amendments increased biomass yield and reduced plant metal uptake. The bioconcentration factor (BCF) values of the metals were in the order of Zn > Cu > Pb. The bioavailable fraction of Cu, Pb and Zn in firing range soil decreased significantly (p < 0.05) following MHA and NHA treatments. No toxicity symptoms were observed in water spinach over the pot trial. Therefore, MHA and NHA are two promising immobilising agents for the remediation of metal contaminated land.
Key words: Contaminated soil, heavy metal, soil stabilisation, water spinach, microhydroxyapatite, nanohydroxyapatite
INTRODUCTION
Azlan Kamari, et.al. / The Effect of … ISBN. 978-979-99314-8-1
production, mining activities, biosolids and manure application, wastewater irrigation, and inadequate management of pesticides and chemicals in agricultural production have significantly contaminated soil and groundwater [4]. The level of heavy metals in soil has also influenced by firing range activities. Firing bullets are mainly composed of Pb-alloy slugs enclosed with Cu-alloy jackets [5,6]. Metal particulates originating from multiple impacts of bullet fragments during range operations can be oxidised and transformed into compounds that can be mobilised in soil environment [7-9]. An analysis on metal concentration in military firing range soil collected from Busan Metropolitan City, Korea by Moon et al. [6] found 11,885 mg/kg Pb. Parra et al. [10] measured 9,600 mg/kg Pb in topsoil samples collected from a firing range in New Mexico, USA. Meanwhile, firing range soil of the Small Arms Training Area, Aiken, USA was reported to contain 3,282 mg/kg Pb and 1,762 mg/kg Cu [11].
Toxic metals are not biodegradable and persist for a long period of time in soils. They are not only harmful to ecosystems and agricultural production, but also a serious threat to human wellbeing. Their presence in soil may pose a great risk to food chain and water supplies. Considerable efforts have been made to remediate metal contaminated soils. There are many techniques available for the remediation of metal contaminated soils, such as mechanical separation, solidification, soil washing, heap leaching, soil flushing and electrokinetic [12,13]. However, many of these techniques are costly and not practical to implement. Soil stabilisation is a cost-effective and promising soil remediation technique, and has been extensively used in immobilisation of heavy metals in contaminated soils [14]. This technique relies on application of the soil amendments to help retain metals in the stable solid phase by sorption, precipitation, complexation, ion exchange or redox process, thereby decreasing mobility and bioavailability of metals [14,15].
Liang et al. [14] studied the effects of biochar and phosphate application on Cd leachibility from a contaminated soil. The Cd concentration in TCLP (toxicity characteristics leaching procedure) extract was reported to reduced by 19.6% and 13.7%, respectively. They also reported that the concentration of Cd in the groundwater was reduced by up to 62.7%. The immobilisation of Pb and Zn in a contaminated soil using water treatment sludge, blast furnace slag and red mud was assessed by Zhou et al. [16]. Amending contaminated soil using the three amendments was reported to reduce CaCl2, CH3COOH, HCl and EDTA-extractable Pb and Zn significantly. The Pb and Zn uptake by Rhodes grass was found to decrease with amendments application. A significant immobilising effect was reported for 10% (w/w) treatment. Fang et al. [17] has shown that phosphate rock tailing and triple superphosphate fertilizer were able to reduce CaCl2-extractable Pb and Zn by 55.2-73.1% and 14.3-33.6%, respectively.
The overall aim of this work was to evaluate the potential of microhydroxyapatite (MHA) and nanohydroxyapatite (NHA) as immobilising agents for the remediation of metal contaminated soil.
RESEARCH METHOD
In this study, the soil sample was collected from a 25-year old active firing range in Selangor, Malaysia. The soil samples were taken at the surface layer of up to 25 cm depth using a stainless steel trowel. The samples were air-dried for 1 week, thoroughly mixed and passed through a 2 mm mesh sieve. The soil consists of sand (45%), clay (36%) and silt (19%). The soil pH measured in deionised water with a soil:solution ratio of 1:2.5 using a pH meter, was 4.82. The total Cu, Pb and Zn concentrations in the soil determined by aqua regia extraction were 725, 2337 and 364 mg/kg, respectively. In addition to the total fraction, the bioavailable fraction of metals in soil was also determined using ammonium acetate (1.0 mol/L, pH 7) at a soil:extractant ratio of 1:10. The ammonium acetate extractable Cu, Pb and Zn were 318, 1066 and 135 mg/kg, respectively.
of 15.0 cm and a height of 18.0 cm were filled with 400 g of soil. MHA and NHA were added to the soil at 0%, 1% and 3% (w/w), in six replicates. The soils were left to equilibrate for two weeks. As the soil has a poor plant nutrient content, ¼ strength Hoagland’s nutrient was added to each pot thrice a week at application rate of 20 mL. The Hoagland’s nutrient solution was applied to the soils for two weeks only (equilibration period). The addition of nutrient solution was discontinued when the pot experiment began.
After two weeks, each pot was tipped out and remixed to ensure homogeneity and to prevent the soil samples from becoming anaerobic. A pot experiment was carried out for 8 weeks. Water spinach (Ipomoea aquatica) seed was sown two weeks after addition of amendments. The pots were arranged in a randomised block design. The water content of the soils was adjusted to obtain 70% of the water holding capacity by adding deionised water daily, avoiding prolonged water logging. Plants were allowed to grow under natural lighting and temperature. Mean daily temperature and humidity were monitored with a digital thermometer. At the end of the pot experiment, the soil pH and ammonium acetate extractable metal content in the soil were determined, as previously described.
The plants were harvested at 8 weeks of growth. The aerial parts were cut at 1.0 cm above the soil surface to avoid contamination by soil using a pair of scissors, which was wiped after each use. Roots were carefully extracted from the soil and washed thoroughly with deionized water to remove soil particles. Plant tissues were washed thoroughly with deionised water and dried in an oven at 70 ºC for 48 h. After two days, the dry weight of plant tissue was measured. Dried shoots and roots were milled using a grinder. Milled samples were ashed at 450 ºC for 3 h in a furnace and digested in hot concentrated HNO3. Metal concentrations in the plant digests and soil extracts were measured by flame atomic absorption spectrometry (AAS).
Standard reference plant materials (SRM 1573a Tomato Leaves – National Institute of Standards & Technology, USA, and SRM 1575 Pine Needles – National Bureau of Standards, USA) and certified reference soil material (LGC 6135 Hackney Brick Works Soil – Laboratory of the Government Chemist, UK) were used to verify the accuracy of metal determination. Reference materials were treated and analysed using the same procedures applied for plant tissue and soil samples. The recovery rates were within 90-106% for soil and 86-95% for plant tissue, respectively.
All statistical analyses were performed using Minitab 15 Statistical Software (Minitab Inc., PA, USA). The data were analysed using the general linear model of one-way analysis of variance (ANOVA), followed by Tukey’s test at a significance level of p = 0.05 to determine least significant difference (LSD) for the comparison of means. Correlation was by Pearson’s coefficients at p < 0.05.
RESULTS AND DISCUSSION
Azlan Kamari, et.al. / The Effect of … ISBN. 978-979-99314-8-1
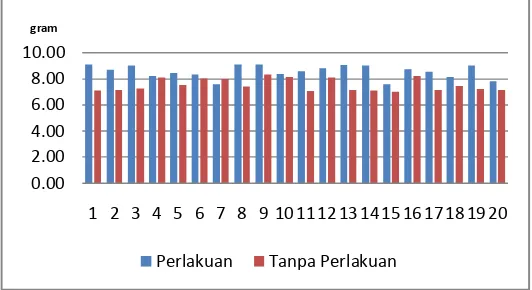
was achieved with NHA 3% (w/w) treatment, followed by application of NHA at 1% (w/w). Although there was an increase in the root yield following application of the MHA, statistical analysis revealed no significant difference was obtained between the MHA 1% and MHA 3% (w/w) treatments.
Table 1. Biomass yield of water spinach.
Treatment Shoot Dry weight (g/pot) Root
Compost* 13.26 4.51
Zero 3.38 a 1.49 a
MHA 1% 4.68 b 2.14 b
MHA 3% 6.02 c 2.77 b
NHA 1% 6.27 c 2.95 c
NHA 3% 10.16 d 3.53 d
LSD 1.01 0.59
MHA and NHA were beneficial as growing media through improvement of soil fertility and provision of plant nutrient. Hydroxyapatite (HA) is a naturally occuring mineral form of calcium apatite with the formula Ca10(PO4)6(OH)2. It is an important material in the manufacture of fertiliser, as a source of phosphorus [18]. Due to its role as a plant nutrient provider, HA has been regarded as one of the key materials in agrochemicals formulations. In general, NHA amendment has resulted in higher biomass yield than MHA. This scenario can be related to the particle size of the HA used. The particles sizes of MHA and NHA are 3 µm and 40 nm, respectively. The smaller size of NHA accelerates the rate of degradation process. And therefore, release the phosphorus to soil-plant environment much faster than MHA. Lower yield of biomass obtained for zero treatment plants can be attributed to metal toxicity. No toxicity symptoms were observed on the plant leaves over the pot experiment. This suggests that water spinach is a robust plant species and has great tolerance to high metal concentrations.
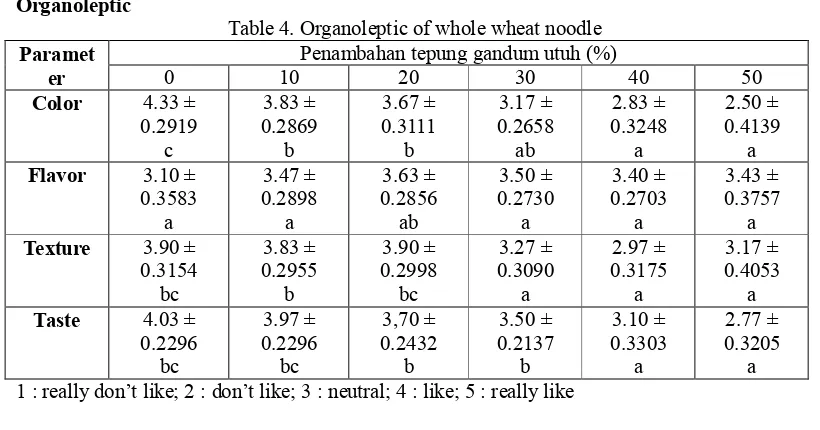
Metal Concentration in Plant Tissue. The concentrations of Cu, Pb and Zn in plant shoots after 8 weeks of growth are given in Table 2. It is apparent that MHA and NHA treatments reduced metal concentrations in the shoot tissue of water spinach. From Table 2, metal concentrations in shoots decreased with the rates of amendments application. Marked reductions in metal concentrations were obtained for NHA treatment at 3% (w/w).
Amending contaminated soil with MHA and NHA increased soil pH from 4.82 to 7.72, therefore reducing metal availability for plant uptake. The pH values of MHA and NHA were determined as 7.53 and 7.24, respectively. The reduction in metal concentrations can also be related to the presence of functional groups (PO43- and OH-) on its surface. These functional groups are able to bind or complex heavy metals [15]. Fourier Transform Infrared (FTIR) analysis has confirmed the presence of functional groups on the surface of amendments, as well as the interaction between functional groups and metals (data not shown). It is clear that the accumulation of heavy metals in plant tissues is greatly affected by several factors such as the nature of the amendment, application rate of amendment, the nature of the metal contaminant, plant species and soil pH.
Table 2. Metal concentration in plant shoots.
Treatment Cu Concentration (mg/kg) Pb Zn
Zero 954 d 125 d 1623 c
MHA 1% 827 c 109 c 1485 c
MHA 3% 575 bc 90 b 1296 bc
NHA 1% 513 b 98 b 1144 b
NHA 3% 418 a 75 a 605 a
LSD 84 15 429
Correlations between metal concentrations in soil and metal concentrations in plant shoot were assessed using two extractants, namely EDTA and ammonium acetate (Table 3). It was found that ammonium acetate gave significant correlation between metal concentrations in soil and metal concentration in plant shoot. In contrast, EDTA exhibited poor correlations. The poor correlation between EDTA extractable metal concentrations and plant tissue metal concentrations may be because EDTA is a good extractant for metal associated with organic matter, which may not be available for uptake by plants [4,6].
Table 3. Correlations between metal concentrations in soil and metal concentrations in plant shoot.
Extractant Metal Correlation coefficient Shoot tissue p-value
EDTA Cu 0.029 NS
Pb 0.013 NS
Zn 0.042 NS
Ammonium acetate Cu 0.633 0.000*
Pb 0.145 0.001*
Zn 0.826 0.003*
Bioconcentration Factor. The bioconcentration factor (BCF) is defined as the ratio of metal concentration in plant shoots to metal concentration in soil [19]. As discussed by Yoon et al. [20], BCF is a measure of the ability of a plant to accumulate metals from soils. In this study, the influence of MHA and NHA treatments on BCF values of the metals was determined, and the values are given in Table 4. The BCF value of Zn for plants grown on zero treatment soil was calculated as 1.24, suggesting that water spinach has great potential for phytoextraction of Zn from contaminated soil. The BCF values suggest that the ability of water spinach to take up Cu, Pb and Zn from soil decreased significantly with the addition of amendments. This can be attributed to metal binding to functional groups of amendments and reduction in metal availability for plant uptake, as discussed in the preceding section.
Values represent mean of 6 replicates. Letters a, b, c and d show the significant differences between the soil treatments, where letter a represents the lowest mean. Different letters indicate significant statistical differences (Tukey’s test at p < 0.05).
Azlan Kamari, et.al. / The Effect of … ISBN. 978-979-99314-8-1
Table 4. BCF values for Cu, Pb and Zn.
Treatment Cu BCF Pb Zn
Zero 0.33 d 0.22 d 1.24 c
MHA 1% 0.25 c 0.17 d 0.62 b
MHA 3% 0.24 c 0.14 c 0.53 ab
NHA 1% 0.20 b 0.09 ab 0.42 b
NHA 3% 0.14 a 0.06 a 0.26 a
LSD 0.04 0.03 0.13
Metal concentration in plant shoots and soil greatly affects the BCF values. When comparing to Cu and Pb, more Zn was measured in the plant shoots (Table 2). In addition, the total concentration of Zn in the soil (364 mg/kg) was lower than the 725 mg/kg measured for Cu. Therefore, Zn had a greater BCF value than Cu.
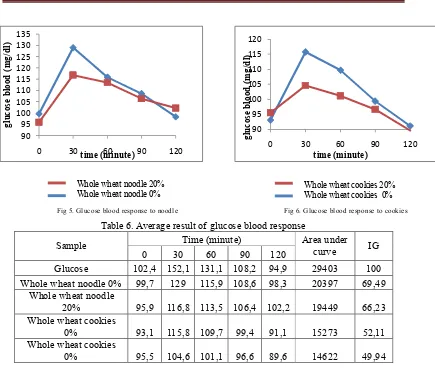
Off-take Values. The effect of MHA and NHA application on metal accumulation in plant tissues was further evaluated in terms of off-take value. The off-take value considers both metal concentration in plant tissues and biomass yield [19,20]. The amount of Cu, Pb and Zn removed by water spinach from soil is given in Table 5. It is also important to estimate the off-take value in kg/ha unit as this will provide an insight into the real effect of soil amendments if applied on a contaminated site [2]. The off-take value (kg/ha) was based on conversion factor of pot area to hectare.
From Table 5, it is observed that the removal of Cu, Pb and Zn by water spinach decreased following MHA and NHA treatments. Overall, Zn was the metal most extracted by plants, whereas Pb was the least. At the end of the pot experiment, it is estimated that 0.39 mg/pot of Cu, 0.07 mg/pot of Pb and 3.78 mg/pot of Zn were removed from the untreated contaminated soil. It is also estimated that the off-take value of Zn could be reduced from 9.45 kg/ha (zero treatment) to 5.30 kg/ha (NHA 1% w/w) and 3.00 kg/ha (NHA 3% w/w).
Table 5. Removal of Cu, Pb and Zn from soil.
Treatment Cu Off-take (mg/pot) Pb Zn Cu Off-take (kg/ha)* Pb Zn
Zero 0.39 0.07 3.78 0.98 0.18 9.45
MHA 1% 0.28 0.06 3.22 0.70 0.16 8.05
MHA 3% 0.21 0.06 2.49 0.53 0.16 6.23
NHA 1% 0.22 0.05 2.15 0.56 0.13 5.30
NHA 3% 0.17 0.05 1.20 0.43 0.10 3.00
Bioavailable Fraction of Metals. The uptake of heavy metals by plants is mainly influenced by the bioavailable fraction of metals, not the total fraction of metals in soil [14,15]. Therefore, the effect of application of MHA and NHA on bioavailable fraction of Cu, Pb and Zn in soil was studied using ammonium acetate extraction. The ammonium acetate extractable metals in soil after 8 weeks of the pot experiment are presented in Table 6.
Values represent mean of 6 replicates. Letters a, b, c and d show the significant differences between the soil treatments, where letter a represents the lowest mean. Different letters indicate significant statistical differences (Tukey’s test at p < 0.05).
Table 6. Ammonium acetate extractable metal in soil.
Treatment Cu Concentration (mg/kg) Pb Zn
Zero 280 d 1018 d 118 d
MHA 1% 223 c 902 cd 103 c
MHA 3% 208 bc 745 b 75 b
NHA 1% 166 b 857 c 52 ab
NHA 3% 110 a 633 a 44 a
LSD 53 102 25
Amending soil with MHA and NHA decreased the bioavailability of Cu, Pb and Zn significantly, particularly at application rate of 3% (w/w). A lower reducing effect was obtained when amendments were applied at 1% (w/w). For example, the ammonium acetate extractable Pb in soil (1066 mg/kg) decreased to 1018 mg/kg (zero treatment), 857 mg/kg (NHA 1% w/w) and 633 mg/kg (NHA 3% w/w) after 8 weeks of pot experiment. The reduction in the amount of metal extracted after the pot experiment can be related to immobilisation effect of the amendments and uptake by plants.
CONCLUSION AND SUGGESTION
Results from this study highlight the potential of MHA and NHA as immobilising agents for the remediation of metal contaminated land. Due to its smaller size, larger surface area and more active sites, NHA was more effective than MHA in immobilising Cu, Pb and Zn in contaminated soil, and reducing plant metal uptake. Pot experiment however is only one aspect of such utilisation. The effectiveness of both amendments as soil amendments rely on their stability in the soil-water environment. It is necessary to study the biodegradation of MHA and NHA and their effect on metal bioavailability.
ACKNOWLEDGEMENTS
This work was supported by the Universiti Pendidikan Sultan Idris Malaysia under Research Grant GPU 2013-0120-102-01 and Ministry of Education Malaysia under Research Grant RACE 2012-0150-108-62. We thank Miss Siti Najiah Mohd Yusoff, Mr Wiwid Pranata Putra, Mr. Mohd Zurin Mahmud, Mr. Mohd Hashimi Ma’ani and Miss Siti Noor Farina Mohd Fuad Ooi for their assistance.
REFERENCES
[1] Qu, J., Luo, C., Cong, Q., Yuan, X. Carbon nanotubes and Cu-Zn nanoparticles synthesis using hyperaccumulator plants. Environmental Chemistry Letters, 2012, 10, 153-158.
[2] Petruzzelli, G. Soil contamination and remediation strategies. Current research and future challenge. EGU General Assembly Conference Abstracts, 2012, 14, 7963-7975.
[3] Xi, J.F., Yu, X.Z., Zhou, L.X., Li, D.C., Zhang, G.L. Comparison of soil heavy metal pollution in suburb fields of different regions. Soils, 2011, 43, 769–775.
Azlan Kamari, et.al. / The Effect of … ISBN. 978-979-99314-8-1
[4] Zhang, X., Wang, H., He, L., Lu, K., Sarmah, A., Li, J., Bolan, N.S., Pei, J., Huang, H. Using biochar for remediation of soils contaminated with heavy metals and organic pollutants. Environmental Science and Pollution Research, 2013, 20, 8472-8483.
[5] Dermatas, D., Menouno, N., Dutko, P., Dadachov, M., Arienti, P., Tsaneva, V. Lead and copper contamination in small arms firing ranges. Global NEST Journal, 2004, 6, 141-148.
[6] Moon, D.H., Park, W., Chang, Y-Y., Ok, Y.S., Lee, S.S., Ahmad, M., Koutsospyros, A., Park, J-H., Baek, K. Immobilization of lead in contaminated firing range soil using biochar. Environmental Science and Pollution Research, 2013, 20, 8464-8471.
[7] Jorgensen, S.S., Willems, M. The transformation of lead pellets in shooting range soils. AMBIO, 1997, 16, 11-15.
[8] Landsberger, S., Iskander, F., Basunia, S., Barnes, D., Kaminski, M. Lead and copper contamination of soil from industrial activities and firing ranges. Biological Trace Element Research, 1999, 71-72, 387-396.
[9] Chrastný, V., Komárek, M., Hájek, T. Lead contamination of an agricultural soil in the vicinity of a shooting range. Environmental Monitoring and Assessment, 2010, 162, 37-46.
[10] Parra, R., Ulery, A.L., Elless, M.P., Blaylock, M.J. Transient phytoextraction agents: Establishing criteria for the use of chelants in phytoextraction of recalcitrant metals. International Journal of Phytoremediation, 2008, 10, 415-429.
[11] Wilde, E.W., Brigmon, R.L., Dunn, D.L., Heitkamp, M.A., Dagnan, D.C. Phytoextraction of lead from firing range soil by Vetiver grass. Chemosphere, 2005, 61, 1451-1457.
[12] Kim, W-S., Jeon, E-K., Jung, J-M., Jung, H-B., Ko, S-H., Seo, C-I., Baek, K. Field application of electrokinetic remediation for multi-metal contaminated paddy soil using two-dimensional electrode configuration. Environmental Science and Pollution Research, 2014, 21, 4482-4491. [13] Zhang, W., Tsang, D.C.W., Chen, H., Huang, L. Remediation of an electroplating contaminated
soil by EDTA flushing: chromium release and soil dissolution. Environmental Science and Pollution Research, 2013, 13, 354-363.
[14] Liang, Y., Cao, X., Zhao, L., Arellano, E. Biochar- and phosphate-induced immobilization of heavy metals in contaminated soil and water: implication on simultaneous remediation of contaminated soil and groundwater. Environmental Science and Pollution Research, 2014, 21, 4665-4674.
[15] Kumpiene, J., Lagerkvist, A., Maurice, C. Stabilization of As, Cr, Cu, Pb and Zn in soil using amendments – A review. Waste Management, 2008, 28, 215-225.
[16] Zhou, Y-F., Haynes, R.J., Naidu, R. Use of inorganic and organic wastes for in situ immobilisation of Pb and Zn in a contaminated alkaline soil. Environmental Science and Pollution Research, 2012, 19, 1260-1270.
[17] Fang, Y., Cao, X., Zhao, L. Effects of phosphorus amendments and plant growth on the mobility of Pb, Cu, and Zn in a multi-metal-contaminated soil. Environmental Science and Pollution Research, 2012, 19, 1659-1667.
[18] Kottegoda, N., Munaweera, I., Madusanka, N., Karunaratne, V. A green slow-release fertilizer composition based on urea-modified hydroxyapatite nanoparticles encapsulated wood. Current Science, 2011, 101, 73-78.
[19] Kamari, A., Pulford, I.D., Hargreaves, J.S.J. Metal accumulation in Lolium perenne and Brassica napus as affected by application of chitosans. International Journal of Phytoremediation, 2012, 14, 894-907.
C-2
CHROMIUM EXTRACTION FROM SOIL BY USING GREEN MUSTARD (Brassica juncea)
Tri Santoso, Baharuddin Hamzah, Irwan Said, *Ririen Hardani
Department of Mathematics and Natural Sciences Education, Faculty of Teacher Training and Education, Tadulako University
* Department of Pharmacy , Faculty of Mathematics and Natural Sciences,Tadulako University - Jl.Sukarno-Hatta Km.9 Palu (94118) – Indonesia
Tel. +62.451.481356 Fax. +62.451.429743
ABSTRACT
The extraction of chromium (Cr) from soil by using green mustard (Brassica juncea) have been studied. The effect of various experimental parameters have been investigated too. The results showed that the amount of Cr from soil by Brassica juncea plants affected by soil pH and plant age, the highest withdrawal occurred at of pH 7.0 - 7.5 at the age of 7 weeks. Cr withdrawal from soil by using green mustard without induction with cadmium showed that the accumulation in roots was 412.287 mg / kg of dry mustard and in the dry weight of leaves was 270.634 mg/kg mustard. The results also showed that there was no influence between the size of the pot with the accumulation of Cr on the plant because of the statistical analysis showed that there was no significant difference between the size of the pot (0.5 kg soil) with the other size larger. While the withdrawal of Cr from soil using cadmium induction showed that the Cr accumulation in roots was 873.30 mg / kg of dry mustard and in the leaves was 545.28 mg / kg dry weight of mustard. Thus, translocation of chromium metal ions from soil into roots and leaves of green mustard with the addition of the cadmium as an inductor may increase significantly which is two times greater than the accumulation of chromium without the addition of inductors.
Key words : extraction, chromium, soil, green mustard, Brassica juncea. 4. Introduction
There is a few kind of hyper accumulator plants that can attract Chromium (Cr). So far only Medicago sativa and Dactylis glomerate that have been identified as hyper accumulator plants of Cr (Shanker, et al, 2005), but both of these plants are very difficult to obtain and has not been developed in Indonesia. Therefore, in order to locate and identify other plants that serve as hyper accumulator of Cr is relatively more easily available and cheap, so this research studied the using of mustard green as hyper accumulator plants of Cr. Long-term goal of this research is to find / produce optimum conditions on the withdrawal of Cr from soil by using green mustard (Brassica juncea), with or without cadmium induction, so that this green mustard plants can be used as hyper accumulators of heavy metal chromium.
Tri Santoso, et.al. / Chromium Extraction From … ISBN. 978-979-99314-8-1
Consideration of selection of green mustard plants as an alternative hyper accumulator plant are, it has been shown to be used as hyper accumulator plant of lead (Pb) (Jerald, 1997), green mustard is including in Brassicaceae family, the same family of the most hyper accumulator plants of heavy metals that have been identified and green mustard plants are easily available and cheap so that application in the field are more likely to be done
Chromium, a toxic element, in principle dispersed in nature both in the water, air and soil and environmental industries and metal electroplating industry mainly through atmospheric emissions from industrial activities and residential city. Although Cr is not essential for plant growth, but can be taken by most species of plants. The advantages of this metal is poisoning can induce symptoms such as reduced growth and death of plants (Barcelo and Poschenrieder,1990), the destruction of the membrane (Kennedy and Gonsalves, 1987) and alteration of enzyme activity. Chromium intensively used in electroplating, other anthropogenic activities such as industrial metal, metal plating, mining, production, use and disposal of batteries, metal contaminated waste and sludge disposal, will cause a broad spread of Cr into the environment, including soil (Alloway, 1995).
To make the soil clean from Cr metal, required an effective method. Many conventional methods that can be used such as the methods of flushing, dilution and chemical stabilization. However, these methods are not efficient because it will cause new pollution problems at a time when that will come. For example, the method of rinsing / washing the soil causes the cation / anion leached will only move to a deeper layer of soil to reach groundwater. An alternative method that can be used and has proven effective is to use plants that have very high ability to transport metal pollutants from soil (fitoremediation/fitoextraction).
Phytoremediation approach is divided into five general categories namely phytodegradation, rizofiltration, phytovolatilization, phytostabilization and phytoextraction. Phytoextraction is the use of hyper accumulator plants to remove toxic substances like heavy metals from soil and store it in the bud or leaf (Brooks, et.al., 1979, Jerald, 1997). Intake of metals by the roots is an important stage for the main phytoextraction. The efficiency of this technology depends on many factors, among others, the capacity of root systems which retrieve and transfer the metal into the upper plant parts and the interaction between the soil with its physical-chemical characteristics, microbial and others. These complex interactions are influenced by various factors such as specific sections, climatic conditions, hydrology and geology.
Green mustard plant, Brassica juncea, is a heavy metal accumulator plants with high biomass, making it a good candidate for application in phytoplankton remediation strategies (Pilon-switches and Pilon, 2002). Strong -ECS or glutathione synthetase (GS) inexpression of bacterial. Brassica juncea increased synthesis of phytoplankton chelats. This phytochelatin compound that can bind heavy metal ions through brown ties, which in turn can distributed from roots to this part of the other plants.
Research for the use of metal cadmium to induce increased phytochelatin synthetase in leaves of green mustard (Brassica juncea) has been done. (Hammer, D. and Keller, C., 2002). The results showed that when the green mustard plants were induced with 25 mM Cd, the accumulation of phytochelatin synthetase increased significantly after more than six days and the concentration of phytochelatin synthetase in leaves of three times higher than in roots.
4.4. Phytochelatin
Phytochelatin peptides are molecules with the structure (g-Glu-Cys) n-gly, (g-Glu-Cys), nb-ala, (g-Glu-Cys) n-ser, (g-Glu-Cys) n-Glu, (g-Glu-Cys) n-Gln, (g-Glu-Cys) n, where n varies between 2-11 (Grill, et.al., 1985) and was first identified in 1983 in the yeast Schizosaccharomyces pombe (Cobbett , 2000)
Phytochelatin synthesized from GSH and catalyzed by the enzyme transpeptidase, called phytochelatin-synthetase, where this enzyme has shown activity only in the presence of heavy metal ions, especially Cd, Ag, Pb, Cu, Hg, Zn, Sn, Au, and As both vivo or in vitro (Cobbett, 2000). Several studies of physiology, biochemistry and genetics have confirmed that the tri-peptide glutathione is a substrate for biosynthesis of phytochelatin.
Although -Glu-Cys)several structural variants of phytochelatin, for example: ( -Glu-Cys) n-Glu have been identified in-Glu-Cys) n-ser and (-ala, (n- several plant species, they are assumed to have an analog functions and synthesized through the same biochemical pathway essential (Rauser, 1999). In tobacco leaves, heavy metal-phytochelatin complexes are reported to accumulate in the vacuole (Vogeli-Lange and Wagner, 1990).
4.2.Metal Ion Mobilization in Plants
Acidification of the rhizosphere and carboxylate exudation are two things that are considered as potential targets for increasing the accumulation of metals (Clemens, et.al., 2002). The degree to which higher plants can attract metal ions in the soil depends on the concentration and bioavailability, modulated/regulated by the presence of organic matter, pH, redox potential, temperature and concentration other elements. Withdrawal of metal ions appear to compete with carriers of the same trans-membrane to nutrients such as K, Ca, Mg, Fe, Mn, Cu, Zn and Ni (Clarkson and Luttge, 1989). Cell membrane plays a role in metal homeostasis, prevent or reduce entry into the cell.
Apoplast of the root epidermis and cortex is permeable to solute. The cell walls of endodermal layer serves as a barrier to diffusion appoplastic into the vascular system. In general, solutes have been drawn into xymplasma roots before it can enter into the xylem (Tastet and Leigh, 2001). Due to the withdrawal of the metal into the xymplasma roots, three processes that determine the movement of metals from the root to the xylem are: metal-metal sequestration in root cells, transport simplastic into the Stele and eventually get into the xylem (Clemens, et.al. , 2002)
On the general environmental conditions, metal ions enter the first time to the roots. Metal ions easily penetrated into the roots through a network of cortical and distributed on the network of the top soil . Immediately after the metal ions into the roots, it can reach the xylem through the lane or path apoplastic and xymplastic (Salt, et al, 1995), complex compound formed by several ligands such as organic acids and / or phytochelatin (Senden, et.al ., 1992). In general, metal ion content in plant parts decreased in the order as follows: roots> stems> leaves> fruits> seeds (Blum, 1997)
4.2. Effect of Soil pH
Tri Santoso, et.al. / Chromium Extraction From … ISBN. 978-979-99314-8-1
of ground rock phosphate (Iretskaya, S.,N., et. al., 1998). However, several studies reported that the withdrawal of heavy metals by plants is influenced not only by soil pH but also by the cation exchange capacity, oxidation reduction potential and chemical composition of soil solution (Bingham, et. al., 1979). On the other hand, soil pH and other factors such as availability of nutrients may also affect root growth characteristics.
Dependence of pH on the release of cadmium, copper and lead from soil has also been observed. The results showed that with decreasing pH (range 2.9 to 7.1) the rate of release of the three metals increased, where the rate of release of cadmium> lead>copper (Sukreeyapongse,O,.et.al.,2002). For phytoextraction strategy develop ment, in addition to parameters such as type and degree of pollution, plant selection associated with the potential withdrawal and time of cleaning is needed, as well as parameters such as other forms of physical-chemical bonding of heavy metals should be considered. The various bond fractions of heavy metals can be determined through a sequential chemical extraction (Ahnstrom and Parker, 1999)
2. Method
2.4.Materials and Instruments
The materials to be used in this research is green mustard (Brassica juncea), soil, KH-2PO4 0,1 M, 0.1 M NaOH, fertilizers TSP, KCl, concentrated HNO3, H2O2 35 %, Cd(NO3)2. 2H2O, Whatman-42 filter paper, universal pH paper, distilled water, buffer solution pH 5, 6, 7.0, 7.5, 8.0.
The instruments will be used in this study is a tool commonly used glass in the laboratory, oven, hotplate, magnetic stirrer, porcelain cup, UV-Vis Spectrophotometer Genesys-10uv, furnace, desiccator, pH meters, stative and clamp, analytical balance , a number of pots of various sizes, syringe, and spoon
2.2.Procedure
2.2.4.Determination of soil volume Effect
To study the effect of soil volume, the optimum pH 7.0 to 7.5 and the optimum age of 7 weeks green mustard are implemented as follows. Plastic pots filled with 500, 1000, and 1500 grams of soil contaminated with Cr 25 ppm. Then the soil pH is set between 7.0 to 7.5 using phosphate buffer and incubated for 6 weeks before the experiment began. In the beginning of the experiment, into the pots experiment added 200, 120, 200 and 100 ppm of N, P, K and Mg as a fertilizer. Green mustard (Brassica juncea), which had been grown for 2 weeks (in the same condition) were implanted into the pot experiment and placed in a controlled room (temperature and sunlight intensity only). Every day, the plants were given the same amount of distillated water and crops harvested after 7 weeks.
Once harvested, the plants were washed with double distillated water and dried at 60 oC for 48 hours and dry weight recorded. Before analysis, dried samples of crushed and refined a number of samples (0.5 g) was dissolved in a mixture of 5 mL HNO3 (65%) and 4 mL of H2O2 (30%). Then the concentration of Cr solution was measured using UV-Vis spectrophotometer. As a control, some mustard plants grown in soil with an appropriate variation of soil pH, but the land is not contaminated with Cr.
2.2.2.Determination of Cd Induction Effect
Basically all the same treatment, only green mustard plants were induced with Cd to increase the production of phytochelatin in the mustard green, so the amount of chromium that can be drawn from the soil will multiply.
form of salt with a certain amount. Then the pH (optimum) of land be set using phosphate buffer and incubated for 4 weeks before the experiment began. At the beginning of the experiment, into the pots experiment added 200, 120, 200 and 100 ppm of N, P, K and Mg as fertilizer.
Green mustard (Brassica juncea), which had been grown for 2 weeks (in the same conditions) was induced by Cd 25 mM and planted/transplanted into experimental pots and placed in a controlled room (temperature and sunlight intensity only). Every day, the plants were given water with the same amount and plants harvested after a certain time (optimum age). As a control, we use of green mustard without Cr induction. Once harvested, the plants were washed with water and dried at 60 oC for 48 hours and dry weight recorded. Then 0.5 gram sample is dissolved in a mixture of 5 mL HNO3 (65%) and 4 mL of H2O2 (30%). Then the concentration of Cr was measured using UV-Vis Spectrometer.
Treatment: the influence of pot size and the induction of Cd ions is repetition 6 times, then the data obtained were statistically calculated.
3.Results and Discussion
3.4.Determination of soil volume effect .
Research findings in the first year, which is the optimum pH 7.0 to 7.5 and green mustard optimum age 7 weeks later, in the second year followed up to determine the the influence of soil volume. The results of the research presented in Table 1 and Table 2.
Table.4 The content of Cr (VI) in the leaves in various sizes pot experiment (n= 3)
NO Heavy of soil (Kg)
n = the number of repeat analysis
Table.2 The content of Cr (VI) in roots at different size of the pot experiment (n= 3)
Tri Santoso, et.al. / Chromium Extraction From … ISBN. 978-979-99314-8-1
mustard (Brassica juncea), which was analyzed by UV-Vis spectrophotometer. Chromium metal accumulation in leaves of green mustard with the highest variation of the pot size is 276.910 ppm in the size of the pot 1.0 kg, while the lowest was 273.065 ppm at 0.5 kg pot size. While the accumulation of chromium in the highest green mustard root is 412.287 ppm in pot size 1.0 kg and the lowest was 407.693 ppm at 2.0 kg pot size. It seems that there is no relationship between the size of the pot with chromium metal accumulation in green mustard because of the statistical analysis showed that there was no significant difference between the size of the pot (0.5 kg soil) with the other size larger. Only real difference is shown between the concentration of chromium greater in roots than in leaves.
3.2. Determination of Cd Induction Effect
At this stage, the conditions of treatment in research adapted to the conditions which have obtained the optimum at pH 7.0 to 7.5 and harvested 40 days of age, while the concentration of cadmium ions are added to the soil is 25 mM. The results in this study can be seen in Tables 3 and Table 4.
Tabel 3. The content of Cr (VI) in leaves of Cd-induced ion
. 4.Conclusions
Based on the results of experiment, observation and discussion that has been done, it can be drawn several conclusions.
1. There is no influence between the size of the pot with cadmium metal accumulation in plant mustard greens because of the statistical analysis showed that there was no significant difference among the size of the pot.
2. Trans location of chromium metal ions from soil into roots and leaves of green mustard (Brassica juncea) with the addition of the inductor metal cadmium into the soil to increase significantly which is two times greater
5.References
Ahnstrom Z.S., Parker D.R., 1999, Development and assessment of a sequential extraction procedure for the fractionation of soil cadmium, Soil Sci.Soc.Am.J.,63. 1650-1658. Alloway B.J., 1995, Heavy metals in soils, 2nd ed., Blackie Academic and Professional
Publishers, London, 368-369.
Barcelo J., Poschenrieder C., 1990, Plant-water relations as affected by heavy metal stress: A review, J.Plant Nut., 13, 1-37.
Bingham F.T., Page A.L., Mitchell G.A., Strong J.E., 1979, Effects of limiting an acid soil amended with sewage sludge enriched with Cd, Cu, Ni and Zn on yield and Cd content of wheat grain, J. Environt. Qual., 8, 202.
Blum W.H., 1997, Cd uptake by higher plants. In : Proceeding of extended abstracts from the fourth International Conference on the Biogeochemistry of Trace Elements, pp.109-110, Berkeley, USA, University of California.
Brooks R.R., Morrison R.S., Reeves R.D., Dudley T.R., Akman Y.,1979, Hyperaccumulation of nickel by Alyssum linnaeus (Cruciferae). Proceedings of the royal society (London) section B 203, 387-403.
Clarkson D.T., Luttge U., 1989, Mineral nutrition, divalent cathions, transport and compartmentalization, Prog.Bot., 51 : 93-112.
Clemens S., Palmgreen M.G., Kramer U., 2002, A long way ahead : understanding and engineering plant metal accumulation, Trends Plant Sci., 7 : 309-315.
Cobbett C.S., 2000, Phytochelatins and their roles in heavy metal detoxification , Plant Physiol. 123 : 825-832.
Eriksson J.E., 1989, The influence of pH , soil type and time on adsorption and uptake by plants of Cd added to the soil. Water Air Soil Pollut., 48, 317-335.
Grill E., Winnacker E.L., Zenk M.H., 1985, Phytochelatins : The principal heavy-metal complexing peptides of higher plants, Science 230 : 674-676.
Hammer, D. and Keller , C., 2002, Changes in the rhizosphere of metal-accumulating plants evidenced by chemical extractants, J. Einviron. Qual. 31:1561-1569.
Harter R.D., 1983, Effect of soil pH on adsorption of lead, copper, zinc and nickel, Soil sci. Soc. Am.J., 47, 47-51.
Iretskaya S.N., Chien S.H., Menon R.G.,1998, Effect of acidulation of high cadmium containing phosphate rocks on cadmium uptake by upland rice, Plant and Soil 201, 183-188. Jerald L.S., 1997, Phytoremediation, GWRTAC, 1-8.
Tri Santoso, et.al. / Chromium Extraction From … ISBN. 978-979-99314-8-1
Lasat M.M., 2000, Phytoextraction of metals from contaminated soil : A review of plant/soil/metal interaction and assessment of pertinent agronomic issues, J. Hazard.Subs.Res., 2, 5-25.
Pilon-Smits E., Pilon M., 2002, Phytoremediation of metals using transgenic plants, Crit.Rev.Plant Sci. 21: 439-456.
Rauser W.E., 1999, Structure and function of metal chelators produced by plants : The case for organic acids, amino acids, phytin and metallothioneins, Cell Biochem.Biophys. 31 : 19-48.
Salt D.E., Rauser W.E., 1995, MgATP-dependent transport of phytochelatins across the tonoplast of oat roots, Plant Physiol., 107 : 1293-1301.
Senden M.H.M.N., Van Paassen F.J.M., Van der Meer A.J.G.M., Wolterbeek H.T., 1992, Cadmium-Citric acid xylem cell wall interactions in tomato plants, Plant Cell Environ.15: 71-79.
Shanker, A.K., Cervantes, C., Tavera, H.L., Avudainayagam, S., 2005, Chromium Toxicity in Plants, J. Environment International, 31, 739-753.
Sukreeyapongse O., Holm P.E., Strobel B.W., Panichsakpatana S., Magid J., Hansen H.C.B., 2002, pH dependent release of cadmium, copper and lead from natural and sludge-Amended soils, J. Environ. Qual, 31, 1901-1909.
Taster M., Leigh R.A., 2001, Partitioning of nutrient transport process in roots, J. Exp. Bot., 52 : 445-457.
Van Assche F., Clijsters H., 1990, Effects of metal on enzyme activity in plants, Plant Cell Environ., 13, 195-206.
C-3
BIOSORPTION OF TECHNICAL DIRECT DYES BY ACTIVATED SLUDGE Dewi Yuanita Lestari and Endang Widjajanti LFX
Chemistry Education Department of UNY Abstract
This study aimed to determine the effect of adsorbent mass, adsorption time and concentration of dye on adsorption efficiency of activated sludge toward technical direct dyes and to know the effect of the adsorption process of the COD (Chemical Oxygen Demand) value in technical direct dyes solution.
The subject of this study was activated sludge. The object of this study was the activated sludge adsorption efficiency on technical direct dyes. Adsorption process was done by conditioning the variation of the mass of adsorbent, adsorption time and concentration of technical direct dyes. Technical direct dyes solution before and after adsorption were quantitatively analyzed with a COD reactor. Technical direct black dyes solution after adsorption were analyzed quantitatively by UV-Vis spectrophotometer. Adsorption efficiency expressed in terms of concentration of adsorbed dyes divided by the initial concentration of dye solution and multiplied by 100%.
The results showed that: the greater the mass of adsorbent, the higher the adsorption efficiency of activated sludge to technical direct dyes, the longer the time given to the process of adsorption, the higher the adsorption efficiency of activated sludge to technical direct dyes, adsorption efficiency decreases with increasing concentration of technical direct dyes, chemical Oxygen Demand (COD) value technical direct were decrease after adsorption process by activated sludge.
Keywords : activated sludge, technical direct, adsorption
INTRODUCTION
Direct dyes are used on cotton, paper, leather, wool, silk and nylon. Direct dyeing is normally carried out in a neutral or slightly alkaline dye bath at or near boiling point with the addition of either sodium chloride or sodium sulfate [1]
The residual Direct dyes from several industries (e,g. Textille industries, pulp and paper industries, craft industries) are considered a wide variety of pollutants introduced into the natural water resources. The discharge of dye containing effluents into environtment is undesirable because of the toxicity and visibility. Dyes are persistent in nature and strongly absorb sunlight which decrease the intensity of light absorbed by water plants and phytoplankton reducing photoshynthesis and dissolve oxygen of the aquatic ecosystem and result in increase of chemical oxygen demand (COD) [1]
Treatment of the effluent containing residual direct dyes is important for the protection of natural water resources. Biosorption technique is considered to be an effective method for lowering the concentration of direct dyes in waste water. Biosorption involves a combination of active and passive transport mechanisms starting with the diffusion of the adsorbed component to the surface of the microbial cell [2]
Dewi Yuanita Lestari et.al. / Biosorption of … ISBN. 978-979-99314-8-1
potential material to treat waste water contaning direct dyes in biosorption technique. Activated sludge is biological flok consists of microorganisms (i.e. bacteria, protozoa). More than 300 species of bacteria were found in activated sludge. The common Genus were: Zooglea, Pseudomonas,Flavobacterium,Alcaligenes,Bacillus,Achromobacter,Corynbactum,Comomonas, Brevibacterium,danAcinetobacter [3]. Activated sludge is industrial waste so using activated sludge to reduce dyes concentration in wastewater can support zero-waste principal.
RESEARCH METHOD
Batch experiment were carried out in Beakker glass containing the aqueous technical Direct dyes solution of the desired concentration and the known mount of activated sludge. The mixture was agitated for a minute using manual stirrer and allowed at contact time. The dyes solution was separated from activated sludge by centrifugation. The dyes concentration of supernatant was determinned by using uv-visible spectrophotometer. Batch experiment were performed for technical Direct Black and Blue at different contact time : 1; 1,5; 2; 3; 4; 5; and 24 hours, adsorbent mass : 1; 2; 3; 4; 5 grams, initial concentration: 500; 700, 800; 900 ppm. Chemical Oxygen Demand (COD) of direct dyes solution before and after biosorption were measured using COD reactor.
Adsorption efficiency expressed in terms of concentration of adsorbed dyes divided by the initial concentration of solution and multiplied by 100%.
Adsorption ef iciency =Co − CaCo x 100%
Co = Initial concentration of direct dyes (mg/L) Ca = concentration of adsorbed dyes (mg/L)
RESULT AND DISCUSSION
1. Biosorption of direct dyes by activated sludge
Biosorption of direct dyes solution by activated sludge consist of two steps : adsorption as non-enzyme system and followed by degradation as enzyme system [4]. In this research, biosorption was done by aerobic system using aerator as oxygen supplier for aerobic bacteria in activated sludge.Oxygen supply in biosorption process increased the lifetime of microorganisms in activated sludge. In general, steps in decolorization by aerobic bacteria were adsorption of matrix (plasma membrane) of aerobic bacteria followed by metabolite production (i.e. enzyme) by aerobic bacteria [5]. Plasma membrane of aerobic bacteria used to flow oxygen, nutrient, and waste in aerobic bacteria cell. The adsorption process could be seen by colour change of bacteria flok in activated sludge from grey to black. Aerobic bacteria used carbon and nitrogen from direct dyes solution as carbon-nitrogen source to support their life so the enzymatic decolorization occurred [6]. The process caused colour intensity and concentration of direct dyes solution decrease.
supply in aeration process very important to aerobic bacteria in activated sludge. Aerobic bacteria need oxygen to break down organic compound to get energy. The energy was used to grow and multiply cells [7]. Microorganism was able to break azo bonding (-N=N-) in direct dyes so the colour intensity of direct dyes solution was decrease.
Fig 1. Biodegradation of dye
Fig 2. (a) Technical Direct Blue solution before biosorption (b) biosorption without aeration (c) biosorption using aeration
2. Effect of Biosorbent Mass
Fig. 3 showed that adsorption efficiency increase with the increase of biosorbent mass. It occurred both in Direct Black and Direct Blue Dyes.There were correlation between biosorbent mass and number of active sites[8]. The increase in the adsorption efficiency with biosorbent mass is due to greater availability of biosorbent surface area [2] and hence more active sites. The greatest adsorption efficiency values were found in 5 grams biosorbent mass both for Direct Black and Direct Blue dyes. The adsorption efficiency values for Direct Black and Direct Blue dyes recpectively were 40% and 32 %
3. Effect of Contact Time
Contact time was time during adsorption. Fig. 4 showed that increase in contact time both for Direct Black and Direct Blue dyes solution caused the increase in adsorption efficiency. The increase of contact time caused active sites on activated sludge had longer time and also more chance to interact with adsorbate (Direct dye molecules) so the adsorption capability of activated sludge increased[9].
The increase of adsorption efficiency showed that some sites still active adsorbing direct dyes during 24 hours contact time. The greater adsorption efficiency values of Direct Black and Direct Blue solution occurred at 24 hours contact time and the values were respectively 85,51% and 98,73%
Dewi Yuanita Lestari et.al. / Biosorption of … ISBN. 978-979-99314-8-1
times the bulk solution concentrations were higher, the driving forces were the maximum, leading to maximum rates. But as the biosorption proceeds, the bulk concentration reduced approaching the equilibrium values and the rate decreased [2].
Fig 3 Effect of biosorbent mass 4. Effect of Initial Concentration
Fig 5. Showed that adsorption efficiency decreased with the increased of initial concentration of Direct Dyes solution. The increase of initial concentration cause the actives site were full of Direct dyes molecules. Insufficient number of active sites available for the value was the amount of oxygen (mg O2) needed to oxydize organic compounds in one litre aqueous sample. The higher COD value means that the environment was more polluted. Table 1 showed that COD values in 600 ppm Direct Black and Direct Blue
activated sludge were able to decrease COD value of Direct Dyes solution. Aerobic bacteria did non-enzyme and enzyme process toward direct dyes so the concentration of dyes decreased. The decrease of direct dyes concentration cause oxygen amount to oxydize Direct dye compounds was lower.
Fig. 5 Effect of Initial Concentration Table 1. COD values
Dyes COD value
Before Biosorption After Biosorption Direct blue 28656,00 mg/L 4776,00 mg/L Direct black 3184,00 mg/L. 1751,20 mg/L.
CONCLUSION AND SUGGESTION
The results showed that: the greater the mass of biosorbent, the higher the adsorption efficiency of activated sludge to technical direct dyes, the longer the time given to the process of adsorption, the higher the adsorption efficiency of activated sludge to technical direct dyes, adsorption efficiency decreases with increasing concentration of technical direct dyes, chemical Oxygen Demand (COD) value technical direct were decrease after adsorption process by activated sludge.
REFERENCES
[1] Neetu Sharma, D.P. Tiwari, S.K. Singh. (2012). Decolorization of Synthetic Dyes by Agricultural Waste-A review. IJSER. Vol 3 Issue 2
[2] Ratnamala and Brajesh. (2013). Biosorption of Remazol Navy Blue Dye from an Aqueous Solution using Pseudomonas putida. IJSET. Vol 2. No.1.
[3] (http://www.kelair.bppt.go.id/Sitpa/Artikel/ Tekstil/tekstil.html)
[4] Dewi RS. (2005). Potensi Bakteri Limbah Industri Tekstil Sebagai Agen Pendekolorisasi Pewarna Azo Sumber Pencemaran Warna Perairan. Prosiding Seminar Nasional dan Kongres Biologi XII: Yogyakarta, 19-22 April 2005
[5] Awaluddin. (2001). Biodekolorisasi. Bogor : Institut Pertanian Bogor
[6] Sharma, P., Singh, L., Dilbaghi, N. 2009. Optimization of Process Variable for Decolorization of Disperse Yellow 211 by Bacillus subtilis using Box-Behnken Design. Journal of Hazardous Materials. Vol 164. pp 1024-1029
Dewi Yuanita Lestari et.al. / Biosorption of … ISBN. 978-979-99314-8-1
[7] Hammer, Mark J. (1986). Water and Wastewater Technology. 2nd. ed. Canada: John Wiley & Sons, Inc
[8] Puvaneswari, N., Muthukrishnan, J. & Gunasekaran, P. (2006). Toxicity Assessment and Microbial Degradation of Azo Dyes. Indian Journal of Experimental Biology. Vol. 44, Hlm.: 618-626
C-EFFECT ACTIVATION OF CHEMICAL AND PHYSICAL TO STRUCTURE AND ACTIVATED CARBON QUALITY FROM CHARCOAL OBTAINED BY
PYROLYSIS OF COCONUT SHELL
Djefry Tani1*, Bambang Setiaji2, Wega Trisunaryanti2, Akhmad Syoufian2 1 Doctoral Student, Chemical Department, Gadjah Mada University, Yogyakarta 2 Chemical Department, Faculty of Mathematics and Science Gadjah Mada University
*Chemical Department, Manado State University *Phone: +6285228231954, e-mail: [email protected]
Abtract
Activation of coconut shell charcoal has been done by a combination of chemical and physical activation to determine the effect of chemical activators and activation temperature to changes in the chemical structure and the quality of activated carbon . The study was conducted on charcoal coconut shell of pyrolysis results with variation of concentration and immersion time ZnCl2 as an activator , respectively 0.5 to 2 M for 12 to 24 hours . Then proceed with the activation of physics in reactor the activation of the temperature variation of 500 to 800 oC with CO2 gas flow rate 20 mL / min . Evaluation of the chemical structure and the quality of activated carbon performed FTIR , SEM , specific surface area , total pore volume , and average pore with Brunauer - Emmett - Teller ( BET ) . The results showed the results of the analysis of SPSS through Cofficients test the concentration variables most affect to moisture content , ash content , and iodine absorption from temperature variable and time of activation . The best quality activated carbon produced at a concentration of ZnCl2 of 1.5 M, 24 hours soaking time of 24 hours , temperature 800 oC and the activation time of 120 minutes . The results as moisture content of 8.47 % , volatile matter content of 18.55 % , ash content 1.44 % , bonded carbon content of 80.01 % and iodine absorption of 769.74 mg / g . The results of FTIR analysis showed the surface of activated carbon containing CO and CH bonds , and SEM analysis showed the number and diameter of pores increased with the higher calcination temperature . Surface area ( BET ) of 359.286 m2 / g , pore volume of 1.984 x 10⁻¹ cm3 / g and pore mean of 11.46 Ǻ .
Keywords : coconut shell, activated carbon , ZnCl2 , SPSS , FTIR , SEM , BET
Introduction
Djefry Tani, et.al. / Effect Activation Of … ISBN. 978-979-99314-8-1
carbon. Most of its pore is still covered with hydrocarbon, tar and other organic compound. Its component consists of fixed carbon, ash, water, nitrogen and sulphur. Coconut shell charcoal from pyrolisis process is potential to process as active carbon (Scok et al, 2005). Active carbon product from coconut shell charcoal has many micropore, high surface area and high adsorption capacity (Keneeth, 2002; Manocha, 2003).
Process of making active carbon consists of two steps: carbonization process and activation process. Main product resulted from carbonation process is charcoal with side product of tar, liquid smoke and carbon. However, resulted carbon has low surface area and usually less active due to very small adsorption rate. So, it is necessary followed with activation process functioning to develop porosity and adding surface area (Rodenas et al, 2005; Cuhadaroglu and Uygun, 2008).
Activation method commonly used in making active carbon is physical and chemical activation. Physical activation process is charcoal activation to develop pore from active carbon with aid of hot vapor and inert activating gas in high temperature of 800 to 11000C (Teng et al, 1998; Hong et al, 2000; Lee and Lee, 2001). Activation temperature is a variable that very influence characteristic of active carbon. In high temperature condition without air will resulted high quality active carbon where volatile components will loss so fixed carbon level is high. Chemical activation is a process of cutting carbon chain from organic compound using chemical material as activator (Derbyshier et al, 1995). Some activators commonly used in making active carbon are KOH, NaOH, ZnCl2, KCl, H3PO4 HCl and so on (Sricharoenchaikul et al, 2008; Babel, 2004). However, in other side, making active carbon with only chemical activation has weakness of corrosion process, washing process and cannot regulate resulted active carbon pore (Balci et al 1994; Sricharoenchaikul, 2008; Timur et al, 2006).
This research studied activation process of coconut shell charcoal from pyrolisis process using chemical activation and physical activation using ZnCl2 as activator with CO2 activating gas. The combination method is expected to make active carbon at lower temperature, easier and at lower cost but with high commercial value. The combined method will result in high quality active carbon with greater surface area and high adsorption capacity. It will contribute to science and technology of making active carbon useful for industry in the future and it can develop optimally distribution of pore dimension according to industry desire.
Experimental electronic balance, oven, desiccator, electric furnace, magnet stirring, pH meter, laboratory glass tools.
Procedure
Preparation of coconut shell sample
Coconut shells were cleaned and their dimension were decreased to about 3 x3 cm, and weighted for 1500 gram and used as pyrolisis sample.
Carbon activation step
1. Chemical activation step
In this step coconut shell charcoal from pyrolysis that has been sieved was soaked in ZnCl2 solution with various concentration and soaking duration (0.5 – 2.0 M and 12 to 24 hours). Charcoal that have been soaked was sieved with vacuum filter and heated in oven at 1200C for 2 hours to produce dry charcoal then put into desiccator.
2. Physical activation step
Charcoal resulted from chemical step was put into tube furnace activation reactor given with glasswool at lower and upper part, then activated at various temperature (500 to 8000C) and flowed with CO2 20 ml/minute for two hours. Then, the charcoal was soaked in 1M HCl solution for 24 hours. Then the charcoal was washed with distilled water to make neutral filtrate (measurement with pH meter). It was sieved and dried in oven at 1100C for two hours. Active carbon was ready to analyze
3. Active carbon analysis
Active carbon test including physical and chemical characteristic consist of macro and micro analysis. Macro analysis includes moisture content, volatile content, ash content, fixed carbon content, and adsorption capacity iodine. Result of macro analysis is tested with coefficient test using SPSS. Analysis of micro structure include function group with FTIR, surface structure with SEM, BET surface area, total pore volume and average pore diameter.
Fourier Transform Infra red (FTIR) analysis
Active carbon sample structure of activation result was analyzed using Fourier Transform Infrared (FTIR) Shimadzu model IR-prestige-21 and made pellet KBr. It was used to identify mineral function group.
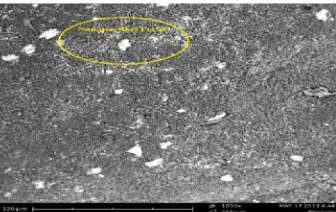
Scanning electron microscopy (SEM)
Scanning electron microscopy (SEM) was used to analyze micro structure of surface of active carbon before and after activation.
BET surface area analysis
Pore structure analysis and surface area analysis was done using surface area analyzer Nova ver 2.2. Determination of surface area was done with BET method to calculate surface area of active carbon resulted from pyrolisis of coconut shell charcoal. In addition with BET equation, total pore volume and average pore radius may be determined.
RESULT AND DISCUSSION
This research was done to identify effect of chemical treatment using ZnCl2 activator in making active carbon from coconut shell charcoal using chemical and physical activation methods.
Moisture matter of active carbon
Djefry Tani, et.al. / Effect Activation Of … ISBN. 978-979-99314-8-1
Figure 1. Effect of ZnCl2 concentration and temperature on moisture content of active carbon
Figure 1 reveals that grater concentration of activator solution used in active carbon soaking will result in higher moisture content. Soaking process with activator was done to reduce tar content, so the more concentrated activator the less tar content in carbon. In result, pore in active carbon is increasingly great and much. Greater and more pore lead to increase in its hydroscopic characteristic. It causes adsorption of water from atmosphere by active carbon will increase, which lead to increase in moisture content in the active carbon.
Coefficient test indicates three independent variables on moisture content (%) is temperature (16.159), concentration (12.110) and soaking duration (4.822) (see t count in t column t in coefficient table). Result of multiple regression test using SPSS software indicate that the three variables affect water content.
Ash content
Process of testing ash content will indicate ash of metal oxide in charcoal consisting of mineral that can evaporate in incineration process. Effect of activator concentration on ash content in active carbon is presented in figure 2.
Figure 2. Effect of ZnCl2 concentration and temperature on as content of active carbon
Figure 2 shows that ash content of all active carbon obtained in this research fulfill SII no 0258-79 (maximal 10%) because it was about 0.55-1.44. at activator concentration of 0.5-2.0 M, ash content increased. It relates to forming pores in active carbon. Ash content in active carbon also relates to raw material and its process. High activator concentration will add surface area of active carbon due to great and many pores. Active carbon consists of layers piling to each other making pore. During pore forming, there occur crystal field burning that resulting ash. The more pore made, the more ash produced.
Coefficient test indicated three independent variables affecting ash content are Dot/Lines show Means
temperature (7.296), concentration (-2.501)and soaking duration (1.096) (see t count in t column t in coefficient table).
Volatile matter content
Volatile substance in active carbon consists of water and tar residue that does not fully disappear in carbonization process. Obtained data indicated that volatile substance content in active carbon obtained in this research still comply with SII no 0259-79 (25%), as indicated in figure 3.
Figure 3. Effect of ZnCl2 concentration and temperature on volatile matter content of active carbon
Figure 3 indicated that higher concentration of activator solution will decrease volatile substance. So, higher ash content indicated lower volatile substance content in active carbon. It is due to absorbed activator will cause erosion in carbon, which reduce efficiency of heating process in activation. In other words, temperature of activation process is low. When activation was done in low temperature, then volatile substance content will increase. Then, decomposition of non carbon compound such as CO, CH4 and H2 is expected not perfectly running. The graphic indicated that various concentrations can reduce volatile substance content but their decrease is not great so did no affect the volatile matter.
Based on coefficient test, the three independent variables most influencing volatile matter content are temperature (-4.021), concentration (-3.233) and soaking period (-2.126) (see t count in t column in coefficient table).
Fixed carbon content
Fixed carbon content is carbon obtained based on deduction of all sample weight (100%) on volatile matter and ash content. Fixed carbon content in active carbon was 50%-90%. Therefore, main composer of active carbon is carbon. The data indicated that highest fixed carbon content resulted from carbon activated with 1.5M ZnCl2, with 24 hour soaking period and at 8000C. Fixed carbon content obtained with various concentration still comply with SII no 0258-79 (at least 65%). The data is presented in figure 4.
Djefry Tani, et.al. / Effect Activation Of … ISBN. 978-979-99314-8-1
Figure 4. Effect of ZnCl2 concentration and temperature on fixed carbon content of active carbon
Figure 4 indicated that increase in activator solution concentration will increase fixed carbon content. Factors influencing increase in carbon content are ash content and volatile matter content. Lower ash content and volatile matter content in active carbon indicated higher fixed carbon content. Therefore, purity of active carbon will be higher.
Based on coefficient test, the three independent variables most influencing fixed carbon content are temperature (3.418), concentration (3.400) and soaking period (2.023) (see t count in t column in coefficient table).
Iodium number
Adsorption of aqueous iodine is one of main characteristics of active carbon determining quality of active carbon. Test result indicated that active carbon having best adsorption number iodine is that in 1.5 M concentration (769.74 mg/g). The adsorption number
on iodine resulted in this research comply with SII no.0258-79 (at least 200 mg/g).
Figure 5. Effect of ZnCl2 concentration and temperature on iodine adsorption number active carbon
Figure 5 reveal high activator solution will increase adsorption number over iodine. It is cause due to tar content in active carbon increasingly decrease with increasing activator concentration at soaking, where soaking process with activator was done to reduce tar content. Therefore, more concentrated activator solution used indicates decrease in tar content in active carbon. It causes greater pores in active carbon or increase in surface area of active carbon. The grater surface area of active carbon, the higher absorption number it has.
Based on coefficient test, the three independent variables most influencing adsorption Dot/Lines show Means