Monetary Policy Review
August 2010
The Monetary Policy Review (MPR) is published monthly by Bank Indonesia after the Board of Governors’ Meeting each February, March, May, June, August, September, November, and December. This report is intended as a medium for the Board of Governors of Bank Indonesia to present to the public the latest evaluation of monetary conditions, assessment and forecast for the Indonesian economy, in addition to the Bank Indonesia monetary policy response published quarterly in the Monetary Policy Report in January, April, July, and October. Specifically, the MPR presents an evaluation of the latest developments in inflation, the exchange rate, and monetary conditions during the reporting month and decisions concerning the monetary policy response adopted by Bank Indonesia.
Board of Governors
Darmin Nasution Deputy Governor Senior
Hartadi A. Sarwono Deputy Governor
S. Budi Rochadi Deputy Governor
Muliaman D. Hadad Deputy Governor
Ardhayadi Mitroatmodjo Deputy Governor
Budi Mulya Deputy Governor
Table of Contents
I. Monetary Policy Statement ...3
II. The Economy and Monetary Policy ...6
Developments in the World Economy ...6
Economy Growth in Indonesia ...9
Inflation ...12
Rupiah Exchange Rate ...14
Monetary Policy ...15
Interest Rates ...15
Funds, Credits, and Money Supply ...17
The Stock Market ...19
Government Securities Market ...20
Mutual Funds Market ...20
Condition of the Banking System ...21
I. MONETARY POLICY STATEMENT
Global economic conditions have improved further despite risks from uncertainties in the outlook for US economic recovery and the economic slowdown in China. The ongoing improvement in global growth is supported by vibrant growth in emerging markets and renewed improvement in the economies of Europe. Key to the turnaround in the economic fortunes of Europe are rising manufactured exports and better than predicted results from European bank stress test, which relieved pressures bearing down on global financial markets. Reflecting this is more robust performance on global stock markets and steady improvement in risk perceptions. Despite this, global economic recovery remains overshadowed by uncertainties from developments in some US economic indicators in recent months that point to slowing economic expansion. US consumption continues to be dogged by a credit crunch and rising unemployment. US manufacturing activity is also slackening in response to weakened domestic consumption. Besides this, the global economic recovery faces risks from China. China’s economy is charting more modest growth as a result of government policy actions to avoid overheating.
The steady improvement in global economic conditions has had a positive effect on the domestic economy. The present recovery in the global economy is providing a boost to exports, particularly for manufactured goods. Furthermore, comparatively stable public purchasing power has kept domestic demand at buoyant levels. Growing exports and rising domestic demand have met with positive response in more robust investment. Positive developments are especially visible in non-construction investment, reflected in higher import growth for capital goods and raw materials and more vigorous commercial vehicle sales. The stronger investment growth is also supported by a conducive domestic investment climate, among others in response to changes in various investment regulations. Performance is up in almost all economic sectors in line with the improvement in global and domestic economic conditions. Key sectors reporting strong performance are manufacturing, the trade, hotels and restaurants sector, construction and the transport and communications sector.
During July 2010, inflation in the consumer price index (CPI) reached 1.57% (mtm) or 6.22% (yoy), up from the previous month’s levels of 0.97% (mtm) or 5.05% (yoy) due to uncertain seasonal conditions and disrupted production and distribution related to heavy rains. This led to significant price increases for food commodities, most importantly rice and miscellaneous seasonings due to their susceptibility to changing weather conditions. Price increases recorded in July 2010 were considerably greater than the historical averages in the foodstuffs category. In the core inflation category, inflation was more subdued due to the adequate supply-side response to rising demand and the appreciating trend in the exchange rate. Therefore, most of the factors driving inflation are seasonal, requiring action to safeguard against increased expectations of future inflation. In view of price movements as of July 2010 and the rising consumption related to the seasonal religious festivities, CPI inflation for 2010 overall is forecasted to reach the upper limit of the Bank Indonesia inflation target.
The estimated performance of the balance of payments remains solid. Rising domestic economic activity is expected to stimulate import growth leading to a modest reduction in the current account surplus. Imports are rising in both the oil and natural gas sector and non-oil and gas sector in line with the increased absorption in the domestic economy with the approach of the religious festive season. Nevertheless, the import growth is adequately offset by brisk growth in exports fuelled by conducive conditions in the global economy and the sustained high level of commodity prices. Estimates for the capital and financial account again point to a surplus spurred largely by mounting portfolio capital inflows in line with positive investor perceptions of the economic outlook for Indonesia. Following these developments, the international reserves position at 30 July 2010 reached USD78.8 billion, equivalent to 6.03 months of imports and servicing of official external debt.
capital flows that include the SBI one-month holding period introduced on 7 July 2010.
Financial markets have maintained stable performance. Reflecting this is movement in the overnight interbank rate, which continued to hover above the BI Rate level, faster M1 growth in response to mounting economic activity and upbeat developments on the stock market and government securities market. Stable macroeconomic conditions and the downward trend in external risk factors boosted prices for assets, including the composite share price index (JCI). The JCI gains during July 2010 came in response to policy decisions concerning the BI Rate and the Policy Package for Enhanced Monetary Management and Financial Market Expansion, as well as the upgrading of Indonesia’s sovereign credit rating outlook. These developments boosted the stock index by 5.3% to a new high of 3,096.8 on 29 July 2010 before closing the month at 3,069.68. The upbeat performance in the JCI was also matched by gains on the government securities market. Key factors in the performance of government securities included not only the stable exchange rate, rating upgrade and positive outlook for the economy, but also limited fiscal risk and prudent fiscal sustainability. In regard to monetary policy, the upbeat performance in government securities also came in response to the Bank Indonesia decision to hold the BI Rate at 6.5% and the introduction of the one-month SBI holding period.
Financial system stability remains strong, bolstered by the robust condition of the banking sector. The stable condition of the financial sector is supported by the strength of the banking system in addressing various risks, as well as improvement in the bank intermediation function. Indications of this include the high capital adequacy ratio (CAR) for the banking system, currently at 17.4 %, and subdued level of non-performing loans (NPLs) gross at below 5.0%. Improvement in banking intermediation is reflected in the rate of credit expansion at end-July 2010, recorded at 19.6% (yoy). This is consistent with the mounting confidence of economic actors in the improving economic outlook. Looking forward, Bank
In the Board of Governors’ Meeting convened on 4 August 2010, Bank Indonesia decided to keep the BI Rate at 6.5%. This decision was taken after a comprehensive evaluation of the latest developments and outlook for the economy, which point to steady overall improvement. Despite this, the recent inflationary surge is a matter of special concern. Bank Indonesia will pursue the necessary monetary and banking policy actions to ensure that future inflation remains on track with the established target at 5%±1% for 2010 and 2011. The Board of Governors considers the current 6.5% BI Rate adequate to safeguard future inflation expectations while closely monitoring the recent rise in inflation. In the near future, Bank Indonesia will respond with measures to tighten liquidity management without disruption to the bank intermediation function, implemented through changes in the statutory reserve requirement.
II. ECONOMY AND MONETARY POLICY
The strengthening recovery in the world economy is being driven by buoyant growth in Asia. Negative sentiment from Europe is in decline, opening the way for stock market gains across the globe. This has brought benefits to the Indonesian economy, which is charting steady improvement. However, prices underwent an inflationary surge during the month, spurred mainly by volatile foods inflation. In other developments, the solid condition of domestic economic fundamentals, the upgrading of Indonesia’s sovereign credit rating and conducive conditions on global financial markets all contributed to appreciation in the rupiah.Developments in the World Economy
hold their reference interest rates at accommodative levels. Asian stock markets also gained in line with improving perceptions of risk in emerging market assets.
In the latest developments, US economic indicators point to a risk of slowdown. Although economic recovery is moving forward, some US production and consumption indicators suggest a slowdown. Manufacturing growth has begun to taper off, as evident in the return of inventory levels to pre-crisis levels. Some industry indicators, such as the production index, capacity utilisation and the manufacturing survey, point to slowdown in line with weakening household consumption. On the demand side, pressure continued to bear down on household consumption as indicated by negative expansion in consumer lending, falling retail sales in the past two months and a slide in the consumer confidence index. High unemployment levels also continue to put brakes on household consumption. The non-farm payroll indicator of employment has resumed decline in response to public sector dismissals in the wake of the US population census programme (Graph 2.1). The Fed responded to indications of a weakening US economic outlook with a downward revision in the growth forecast from the previous 3.2%-3.7% (yoy) range in April to 3.0%-3.5% (yoy). This is consistent with the July Consensus Forecast in which the US economic growth outlook is revised downwards to 3.1% (yoy) from 3.3% (yoy) in the preceding month.
In Japan, economic recovery is moving at a limited pace. The Japanese economy is showing signs of slowdown reflected in a slide in leading economic indicators and a number of other consumption indicators. Retail sales and household spending have also progressively tightened in Japan, while unemployment is steadily rising. Nevertheless, manufacturing performance is positive, buoyed by exports.
In Europe, the economy is moving forward on strengthening exports and rising manufacturing activity. Industry growth in Europe’s two leading economies (Germany and France) has become the bulwark of Europe’s economic resilience as external demand gathers momentum. Reflecting the expansion in European industry is the surge in the PMI manufacturing and services index during July 2010, consistent with rising business sentiment in Europe (Graph 2.2). The UK economy also grew by a brisk 1.1% (qtq) in Q2/2010, the fastest rate posted since Q1/2006, mainly on the back of solid 1.3% (qtq) growth in the services sector. Even so, for the most part European consumption still faces pressure Graph 2.1 US Nonfarm Payrolls &
Unemployment
from the launching of fiscal austerity measures in some countries. High unemployment has also borne down on household consumption driving down retail sales.
Global stock markets advanced on rising sentiment following the release of the stress test results for European banks. Response to release of the stress test results by the Committee for European Banking Supervision (CEBS) on 23 July 2010 surpassed market expectations. Optimism in banking conditions and fading market scepticism over the austerity programmes launched in some countries boosted sentiment in bond sales by some European nations, with Greek and Spanish bond issues oversubscribed. Stronger investor risk appetite was also reflected in global stock market advances during July. The liquidity strain in advanced economies has begun to ease, although short of full recovery. Policies pursued by central banks in advanced economies include continuation of quantitative easing and the holding of reference rates at accommodative levels in order to ease the liquidity strain on interbank markets. For the most part, counterparty risks have begun to improve, as reflected in the comparatively stable spread between the highest-lowest interbank quoted LIBOR despite not having returned to earlier levels. Improvement in risk perceptions is reflected in reduced flight to quality, as evident from the narrowing in the 3-month Overnight Index Swap (OIS)-LIBOR spread and the 3-month TED spread. Conducive global financial market conditions alongside optimism over the outlook for Asian economies prompted renewed inflows of foreign funds into Asian stock markets in keeping with improvement in global risk indicators. Improvement is also visible in risk indicators for emerging markets, as reflected in the narrowing of the EMBIG spread and drop in credit default swaps (CDS) for Asian countries.
Global inflationary pressures remain low and stable despite rising inflation in emerging markets. The overall 2010 inflation forecast for developed nations in July edged upwards to 1.48% (yoy), while the forecast for developing economies dropped to 5.24% (yoy) in response to initial steps to normalise monetary policy. Advanced nations continue to record only moderate inflationary pressure on a downward trend. In contrast, inflationary pressure in Asia is mounting in keeping with the vibrant economic recovery in the region.
of still moderate inflationary pressure and to boost economic activity. A few central banks are expanding their quantitative easing programmes further by buying up securities, albeit in lower volume. However, a number of central banks have begun raising rates in view of mounting inflationary pressure and full recovery in economic activity. These nations include Israel (+25 bps), Canada (+25 bps), New Zealand (+25 bps) and Sweden (+25 bps).
Some developing economies, such as in Latin America and Asia, have begun normalising policy in order to curb inflationary pressure and stem asset bubbles. Among the Asian central banks that raised interest rates during July 2010 are India (+50 bps: reverse repo), South Korea (+25 bps), Malaysia (+25 bps) and Thailand (+25 bps). In Latin America, central banks announcing rate hikes include Brazil (+25 bps), Chile (+50 bps) and Peru (+25 bps).
Economic Growth in Indonesia
The Indonesian economy is predicted to chart brisk growth in Q3/2010 on the strength of rising domestic demand and robust external demand. On the demand side, economic growth is expected to rely primarily on domestic demand with a slightly reduced contribution from external demand. Household consumption is forecasted to climb at a brisk pace due to buoyant public purchasing power and the uplift from seasonal factors in advance of the Eid-ul-Fitr festive season. The accelerated investment is set to carry forward into Q3/2010 in keeping with the improvement in the global economy, a conducive investment climate and positive indications of work progressing on government-sponsored infrastructure projects. In the external sector, exports and imports are both forecasted to maintain high growth. On the supply-side, various economic indicators monitored as of June 2010 suggest that forecasted levels of sectoral growth in Q3/2010 are likely to be reached.
Household consumption in Q3/2010 is forecasted to maintain vigorous expansion. The latest developments in leading indicators for household consumption point in the direction of stronger growth in household consumption. The upward trend in household consumption is also supported by almost across the board increases in leading consumption indicators. Consumption of durables with high import content, such as cars, motorcycles and electronics, is steadily mounting Graph 2.3 Growth of Vehicle Sales
�������
�������
�������������
��� ��� ��� �� �� �� �� �� ���
���� ���� ����
� � � � � �� � � � � � �� � � �
(Graphs 2.3 and 2.4). However, other consumption indicators, such as the retail sales index and consumption goods imports underwent decline compared to Q1/2010. Despite this, household expenditures are forecasted to mount higher in keeping with preparations for the Eid-ul-Fitr festivities, a development set to boost household consumption growth in Q3/2010. In regard to financing, indications of the potential for more robust household consumption growth are evident in the upward trend in consumption lending by banks alongside soaring growth in consumer financing extended by multifinance companies (Graph 2.5). Besides this, credit card and debit card transactions maintained positive growth in May 2010 at 21.8% (yoy) and 17.9% (yoy) compared to the same period one year earlier. In early Q3/2010, consumer confidence remained buoyant despite the risk of upward pressure on prices. Consumer confidence continued to mount in Q2/2010, but slipped back slightly at the start of Q3/2010. This indication is reflected in the Consumer Tendency Index published by the Central Statistics Agency (BPS) for Q2/2010, which climbed to 106.49 from the Q1/2010 level of 102.58. The main factor driving this was consumer expectations of higher household incomes. Similarly, the Bank Indonesia Consumer Confidence Index also points to an upward consumer confidence trend during the first half of 2010 (Graph 2.6).
Investment performance is forecasted to strengthen further in Q3/2010. Key to the upbeat investment is mounting domestic demand, keen demand for exports and a conducive business climate. Positive developments are visible in non-construction investment, which began to climb in Q1/2010 and is forecasted to strengthen further in Q3/2010 (Graph 2.7). Positive indications of higher non-construction investment are reflected in rising imports of capital goods and raw materials and sales of commercial vehicles as of May 2010 (Graph 2.8). Similarly, high cement consumption in June 2010 is indicative of growing activity in implementation of construction investment and infrastructure projects. These positive conditions are consistent with strengthening household consumption, the continued downward trend in interest rates and support from rising exports since Q4/2009 (Graph 2.9). The stronger investment growth is also supported by a conducive domestic investment climate and reforms in various investment regulations. Similarly, the upbeat business sentiment in trading partner nations in early Q3/2010 is expected to drive investment during the quarter. Financing support from the banking industry and finance companies improved further, as reflected in more vigorous albeit minimal growth in investment credit and leasing (Graph 2.10).
Graph 2.4 Sales of Electronic Products
Graph 2.5 Real Credit Consumption and Real Financing
Exports maintained high growth during Q2/2010 despite some slowing in comparison to the preceding quarter. Growth slackened mainly as a result of less vigorous non-oil and gas exports during May and June 2010. In preliminary figures for Q2/2010 (April), exports were up 19% (yoy), representing a stable trend in comparison to Q1/2010 (monthly averages). Oil and natural gas exports slowed in early Q2/2010 mainly from falling oil exports, while gas exports have maintained steady growth since the beginning of the year. However, the Q2/2010 slowdown in non-oil and gas exports is explained by softer performance in resource-based exports and a decline in resource-based exports. Q2/2010 growth in non-oil and gas export volume reached 28% (yoy), well below the Q1/2010 growth recorded at 75% (yoy). Even so, export growth still forged ahead at a respectable pace in Q2/2010, fuelled by positive conditions in the global economy. These conditions are also expected to last throughout Q3/2010. The ongoing process of global economic recovery continues to generate strong export momentum. Signs of this positive trend are evident in the high volume of world trade compared to 2009 and the upward trend in production indices in key export destinations. Alongside this, the appreciating trend in the rupiah exchange rate has also contributed to export growth through competitive costs for imported raw materials. In the oil and natural gas sector, renewed improvement in oil lifting during May 2010 that continued into June and persistently high levels of oil prices spurred export performance during Q2/2010. These positive developments in oil lifting are expected to carry forward into Q3/2010.
Imports are projected to chart brisk growth in Q3/2010 on rising domestic demand. Movement in the leading import indicators also points to an ongoing expansionary phase in import growth. During the first half of 2010, imports tended to track the vigorous pace of external demand, albeit accompanied by slowing in Q2/2010. Real import growth in April 2010 (average) came to 26.8% (yoy), which compares to the same period one year before when imports plunged -15.6% (yoy). In figures for Q2/2010 (April), import growth reached 20.9% (yoy), a more modest level compared to the Q1/2010 growth at 28.7% (yoy) (monthly averages). This slowdown affected both oil and non-oil and gas imports, which began tapering off in May 2010. However, in early Q3/2010, imports appear to have been prevented from further slowing by steady expansion in consumption and investment alongside the appreciating trend in the exchange rate compared to 2009. In the oil and natural gas sector, imports have slowed due to weakening consumption of oil-based fuels and prices of oil and gas imports. Graph 2.7 Building and Non-Building
Investment Growth
Graph 2.8 Investment Indicators
In sectoral performance, growth is forecasted to gain momentum during Q3/2010. Key sectors, such as manufacturing, trade and agriculture, are expected to maintain forecasted levels of growth. The increase in electricity billing rates is a risk deserving attention, particularly in sectors in need of substantial supply of power. So far, the increases in electricity charges announced by the government remain within limits that business can absorb. Agriculture is forecasted to chart reduced growth while facing considerable future risks from the change of season, pest attacks, diminishing area of cultivated land and slowing improvement in productivity. A few sectors, such as construction and financial services, still have potential for higher than forecasted growth in view of recent developments that support continued expansion. In other sectors, higher growth in transportation is reflected in rising numbers of passengers and cargo traffic, imports of transportation equipment and rapid expansion in communications.
I n f l a t i o n
Inflationary pressure from non-fundamentals, led by volatile foods, resulted in high CPI inflation during July 2010. CPI inflation during the month under review reached 1.57% (mtm) or 6.22% (yoy), up significantly from 0.97% (mtm) and 5.05% (yoy) in the preceding month (Graph 2.11). Anomalous weather conditions disrupted production and distribution of some foodstuffs, mainly rice and miscellaneous seasonings, which boosted inflationary pressure in the volatile foods category. In contrast, administered prices sustained only mild inflationary pressure that resulted from an increase in electricity billing rates with impact not fully reflected in the inflation figure for July 2010. On the fundamentals side, core inflation in July 2010 stemmed largely from the seasonal increase in educational costs and the impending arrival of the fasting month and Eid-ul-Fitr festivities. Core inflation from externals maintained a modest trend with imported inflation at minimal levels due to the appreciating trend in the rupiah.
July 2010 inflation in administered prices reflected very subdued levels of inflationary pressure. The main contributions to inflation in this category came from vehicle registration renewals1, clove filter
Graph 2.10 Growth of Investment Credit and Leasing
Graph 2.11 Inflation
Graph 2.12 Inflation by Category of Goods and Services (%, mtm)
1 The higher index for vehicle registration renewals is based on Government Regulation No. 50 of 2010 concerning State Revenue Categories and Rates dated 26 June 2010.
cigarettes and household fuels at 0.26%, 0.01% and 0.01%. The direct impact from the 1 July increase in electricity billing rates will take effect only in August 2010. The energy conversion programme, representing another potential source of inflation, has generated only limited pressure reflected in the very thin 0.01% contribution to inflation during the month under review. This programme has progressed more slowly in 2010 compared to earlier years as a result of the minimum readiness of depots in the targeted conversion areas (mainly outside Java). Taken together, monthly inflation in administered prices category stayed at a low 1.24% (mtm) or 3.74% (yoy) in July 2010, relatively stable when compared to the preceding month’s increase of 0.19% (mtm) or 2.60% (yoy).
The volatile foods category recorded fairly high inflation as a result of turbulent foodstuff prices. Inflation in volatile foods reached 5.46% (mtm) or 16.18% (yoy) in July 2010, up from the previous month’s level of 3.70% (mtm) or 11.51% (yoy). High rainfall led to crop losses and disrupted distribution of food supplies. Commodities vulnerable to changing weather conditions, such as rice, seasonings, fruits and vegetables, underwent significant price surges during the month (Graph 2.13). However, prices mounted for some volatile food commodities relatively unaffected by weather changes, such as meats (chicken and eggs). Key to this were higher prices for day old chicks (DOC) due to rising demand from poultry farmers in advance of the fasting month and Eid-ul-Fitr festivities. Higher prices for some seasonings and rice prompted renewed price increases for processed foods using seasonings and rice as raw material inputs (Graph 2.14). Prices for rice have soared in developments attributed to crop losses in some rice-growing regions and increased production costs amid indications of speculative behaviour by merchants on the eve of the fasting month (Graph 2.15). Rice prices recorded significant increases during July, contributing 0.26% (mtm) to the inflation figure.
Core inflation remained at a subdued level in July 2010 with inflationary pressure arising from the seasonal factors of the new school year and increased prices for some processed food made from seasonings and rice. In July 2010, core inflation reached 0.49% (mtm) or 4.15% (yoy), up slightly from the previous month’s level of 0.34% (mtm) or 3.97% (yoy). Consistent with the seasonal trend, core inflation in July 2010 was fuelled by education as is customary with the start of the new academic year. An added source of rising core Graph 2.13 Raw Food Inflation
Graph 2.14 Spices and Related Commodities Inflation
Graph 2.15 Volatile Food Inflation and Rice
inflationary pressure was inflation in the processed foods category. In other areas, no significant inflation expectations were visible in response to the increase in electricity billing rates. Dominant categories and sub-categories contributing to core inflation were education, recreation and sports (0.06%) and home rentals, rice with side dishes, granulated sugar and air fares (0.02% in each sub-category). Contrasting with this was the disinflationary impact of gold (-0.04%) in line with falling international gold prices during July 2010 (Graph 2.16).
Rupiah Exchange Rate
Indonesia’s solid economic fundamentals and conducive conditions on global financial markets have bolstered the rupiah. During July, the average rate for the rupiah appreciated 1.07% to Rp 9,042 to the US dollar (Graph 2.17). At the end of July 2010, the rupiah closed at Rp 8,949 to the US dollar, having gained 1.24% (ptp) over June 2010. The July 2010 appreciation in the rupiah was accompanied by reduced volatility. In July 2010, volatility in the rupiah eased to 0.19% from 0.51% in the preceding month (Graph 2.18). Contributing to the stable movement in the rupiah were stable global conditions and the effectiveness of Bank Indonesia policy, including the new one-month holding period for SBIs launched on 7 July 2010.
Regarding externals, the improving condition of the global economy lent support for the rupiah. In keeping with the conducive conditions on global financial markets, most global exchange rates strengthened against the US dollar. Sentiment over the European debt crisis eased after the release of European economic indicators pointing to continued improvement and release of stress test results for European banks that exceeded market expectations. Conducive conditions on global financial markets rekindled global investor interest in placing funds in emerging markets, including Indonesia.
On the domestic front, the solid fundamentals of the Indonesian economy have led to improvement in investment risk indicators. At end-July 2010, the EMBIG spread narrowed to 313 bps, while the yield spread on Indonesia Global Bonds over US T-Notes dropped to 210 bps. Confidence in Indonesian debt instruments improved as reflected in the 36 bps drop in the Indonesia CDS to 153 bps at the end of the month under review (Graph 2.21). Subdued perceptions of domestic risk allowed
Graph 2.16 Domestic and International Gold Prices
Graph 2.17 Average Rupiah Exchange Rate
Graph 2.18 Rupiah Exchange Rate Volatility
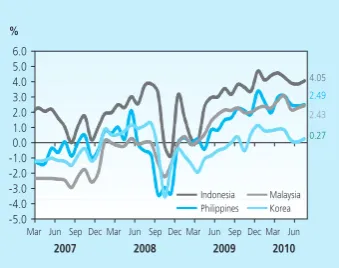
Covered Interest Parity (CIP) to climb to 4.05% (July 2010) from 3.85% (June 2010), higher than for a number of other Asian nations (Graph 2.22).
The rupiah continues to perform well in maintaining external equilibrium. In the latest data, the appreciating trend in the rupiah has not produced any adverse effect on exports (Graph 2.23). Instead, the appreciation paves the way for increased imports of raw materials essential in domestic manufacturing activity. On the regional level, Indonesian products have maintained relative levels of competitiveness. Indonesia’s competitiveness still lags behind that of Malaysia, Thailand and Korea, but is ahead of the Philippines, India and China due to the more stable rate of domestic inflation compared to those economies.
Monetary Policy
Interest Rates
Movement in interbank rates is stable. Following the widening of the interbank overnight rate corridor on 17 June 2010 from +/- 50 bps to +/-100 bps, the overnight rate has hovered at around the BI Rate level, averaging 6.17% during July 2010. Risk perceptions on the overnight interbank market were also relatively stable as reflected in average spread between the highest and lowest rates that varied little from the previous month at 30 bps. In keeping with overnight interbank rates, movement in interbank rates in longer tenors was relatively stable. The average interbank rates in above overnight tenors moved within a range of 1 bps - 3 bps, except for tenors above 27-30 days. Concerning transaction volume, average daily transaction volume on the interbank market for overnight and all tenors held relatively stable compared to one month before at Rp 6.3 trillion and Rp 9.1 trillion per day. This is explained by the still considerable excess liquidity held in the banking system.
Bank interest rates showed improvement reflected in both deposit and lending rates. During May 2010, the average deposit rate across all tenors eased by 25 bps compared to the mere 9 bps decline one month before (Table 2.1). However, the average lending rate (average of the rates for working capital credit, investment credit and consumption credit) came down 10 bps during May 2010, or the same magnitude as one month Graph 2.19 Asia’s Exchange Rate Movement
Graph 2.20 Appreciation/Depreciation of Exchange Rate (Average)
earlier. Rates for working capital credit, investment credit and consumption credit eased by 16, 3 and 11 bps in May 2010 to 13.26%, 12.59% and 15.23% (Graph 2.24). These conditions reflect the continued downward response in bank interest rates marked by further improvement in May 2010. However, the slow rate of decline in loan interest rates relative to deposit rates remains a matter of concern for Bank Indonesia. The comparatively high level of loan interest rates is expected to decline to levels that would encourage lending.
In analysis by category of bank, private banks accounted for the steepest fall in deposit rates at 52 bps in the 12 and 24 month tenors. By comparison, regional development banks, foreign and joint ventures and state-owned banks lowered deposit rates by 39 bps, 19 bps and 5 bps. As a result, the lowest time deposit rates were recorded for foreign and joint venture banks (6.94%), followed by state-owned banks (7.04%) and private banks (7.48%).
Regarding loan interest rates, the steepest declines took place at foreign and joint venture banks. Lending rates offered in this bank category came down 35 bps during July 2010. Private banks and regional development banks, on the other hand, reported more modest rate reductions at 13 bps and 7 bps. In contrast, state-owned banks boosted their loan interest rates by an average of 66 bps. As a result, the lowest lending rates in July 2010 were recorded for regional development banks (13.54%), followed by state-owned banks (13.69%) and private banks (13.9%). However, foreign and joint venture banks again charged higher loan interest rates than other bank categories at 18.9%.
Graph 2.22 CIP Indicator in Asia Countries
Graph 2.23 Exchange Rate and Non Oil & Gas Export and Import
Table 2.1
Development of Various Interest Rates
Funds, Credit, and Money Supply
Funding growth strengthened in tandem with the brisk rate of credit expansion. During June 2010, growth in depositor funds reached 14.9% (yoy), up from the previous month’s level of 12.9% (yoy) (Graph 2.25). Depositor funds mounted by Rp 82.8 trillion during June 2010 and for calendar 2010 by Rp 123.0 trillion (6.2%, ytd) to Rp 2,096 trillion. The more robust funding growth in June 2010 was reflected across all funding components, consisting of demand deposits, savings deposits and time deposits. Growth in demand deposits, savings deposits and time deposits reached 16.8%, 18.6% and 11.7% (yoy), ahead of the previous month’s levels of 9.9%, 18.1% and 11.3% (yoy). This is borne out in the steep rise in demand deposits held by non-financial private sector companies and increase in personal savings. This condition offered confirmation of improving economic activity in the real sector.
In other developments, monetary policy transmission improved through the credit channel. In June 2010, credit expansion mounted to 18.0% (yoy) from 16.6% (yoy) in the preceding month. Credit (including channelling) widened by Rp 54.6 trillion during June 2010 with expansion for calendar 2010 reaching Rp 145.0 trillion (9.9%, ytd). This surpasses the increase in lending for the same period in 2009 and is in fact on par with the brisk rate of credit expansion in 2008, a period marked by expansionary lending before the outbreak of the crisis. The accelerated rate of credit expansion was also indicated by the latest data in the Commercial Bank Daily Reports, with credit growth in July 2010 reaching as much as 19.69%2 (yoy) and 11.1% (ytd).
While the volume of credit continued to climb, credit quality also improved as demonstrated by the accelerated growth in working capital credit. In May 2010, growth in working capital credit reached 12.7% (yoy), compared to only 10.3% (yoy) in the preceding month. With working capital credit accounting for 47.9% of total credit, lending growth in this category is mounting in terms of contribution to total credit expansion. In a similar vein, growth in investment credit, accounting for 21.2% of total lending, also mounted to 25.2% (yoy) in June 2010 from the previous month’s level of 16.5% (yoy). Consumption credit growth has begun to slow, dropping to 25.0% (yoy) from 29.9% in the previous month
Graph 2.25 Development of Funds, Credit, and BI Rate
Graph 2.24 Development of Various Interest Rates
2 Commercial Bank Daily Reports for 30 July 2010.
� �
� � �� �� �� �� �� �� ��
��� ��� ��� ��� ��� ��� ��� ���
���� ���� ����
� � � � � � � ��
������ ��� �������
���� ���� ���� ���� ���� ����� ����� ����� ����� ����� �����
���� ���� ���� ���� ���� ����
(Graph 2.26). The positive developments in credit are closely linked to improvement in domestic economic conditions, in turn supported by the downward trend in loan interest rates. Furthermore, the more rapid pace of credit expansion compared to funding growth is a positive indication of improvement in the bank intermediary function in support of the real sector.
In analysis by sector, credit expansion was again driven by the other sectors. Lending to other sectors expanded by 36.1% (yoy) in June 2010, with this lending accounting for 33.8% of total loans outstanding. However, some fundamental sectors, such as trade, manufacturing and business services have showed increasingly positive developments. Credit expansion for the mining sector also strengthened to 84.8% (yoy) from 79.7% (yoy) in the preceding month.
Disaggregated by currency, rupiah credit expansion in June 2010 reached 21.5% (yoy), up from 20.5% one month earlier. By comparison, foreign currency lending increased by 5.0% (yoy) following a thin 1.1% (yoy) growth one month before. Accordingly, foreign currency lending growth increased to 16.9% (yoy) in June 2010 from 14.4% (yoy) one month earlier. The acceleration in foreign currency credit is consistent with mounting import activity, particularly for passenger cars as one form of capital goods, and also with the expansion in foreign currency-denominated bank funding.
Economic liquidity has steadily expanded alongside gains in economic activity. In July 2010, base money growth reached 14.2% (yoy), up from 12.1% (yoy) at the end of the preceding month (Graph 2.27). Base money has maintained an upward trend since the start of the year, bolstered by growing public demand for cash outside banks. Annual growth in cash outside banks during July 2010 climbed to 13.6% from 9.5% in the previous month (yoy).
M1 and M2 economic liquidity maintained stable growth. In June 2010, growth in M1 economic liquidity held steady at 12.4% (yoy) compared to the preceding month (12.6%, yoy). M2 growth widened in May 2010 to 14.5% (yoy) from the previous month’s level of 12.9% (yoy) (Graph 2.28). Since the start of the year, growth in M1 and M2 has maintained a stable trend albeit below the levels preceding the crisis. M1 growth has moved in line with GDP growth, positioning it as an early indicator of improving economic conditions.
Graph 2.26 Credit Growth by Usage
The Stock Market
The stock market maintained an upbeat track. The loose bias monetary policy, stable macroeconomic conditions and downward trend in external risks helped boost prices for assets, including the JSX Composite Index (JCI). Macroeconomic factors driving JCI performance included the stable exchange rate, low inflation and forecasts for sustained improvement in the economy. From the external perspective, these macroeconomic factors concurred with rising expectations of earnings from globally-listed companies and the “neutral (not expensive)” valuation of global assets. JCI gains in July 2010 are also explained by policy factors3 and the
upgrading of Indonesia’s sovereign credit rating outlook.4 In July 2010, the
JCI climbed 5.3% to reach an all-time high at 3,096.85 before closing at
3,069.28. This performance was also generally consistent with the positive trend in some market indices in the region during July 2010 (Graph 2.29).
At the micro level of individual stock issuers, the publication of first quarter financial statements with results received well by the market combined with positive expectations for the first semi-annual financial statements in 2010 also boosted JCI growth during July 2010. Results published in the first quarter financial statements indicated that issuer fundamentals were in good shape with earnings growth reported in almost all sectors. Buoyant performance was also reflected in the return on assets (ROA) indicator. Dividend payments by some stock issuers also offered an indication of the strength of issuer fundamentals in 2010. Furthermore, with the release of the first semi-annual financial statements for 2010, market actors were buoyed by expectations of positive results led by the banking sector.
The conducive macro and micro-economic environment encouraged inflows of foreign capital. Net foreign buying during July 2010 reached Rp 4.8 trillion, an increase of Rp 2.2 trillion over one month before. Heavy foreigner buying on the stock market kept JCI performance in positive territory. However, the surge in foreigner activity was not followed by increased volume of share trading. Share trading volume reached Rp 3.5 trillion, down slightly from the average in the previous quarter’s level of Rp 4.2 trillion per day (Graph 2.30).
3 Macro policies, including the BI Rate decisions and the six Policy Packages for Enhanced Monetary Management and Financial Market Expansion.
4 Outlook upgrade by Moody’s from stable to positive. The positive outlook applies to Indonesia’s sovereign credit rating, currently at Ba2 for both the local and foreign currency sovereign rating. Ratings were also upgraded to Ba1 for foreign currency bond ceiling and Ba3 for the foreign cur-rency deposit ceiling.
5 The all-time high was reached on 29 July 2010.
Graph 2.29 JCI and Regional Index
Government Securities Market
The loose bias monetary policy and falling external risks
transmitted well to the government securities market with yield in decline. From the macroeconomic standpoint, factors bolstering performance in government securities included the relatively stable exchange rate, low inflation, rating upgrade and positive economic growth outlook. Besides this, performance of government securities was also bolstered by the limited scale of fiscal risks and measures to safeguard fiscal sustainability. In regard to policy, the Bank Indonesia decision to hold the BI Rate at 6.5% and the planned introduction of the one-month SBI holding period were key background factors in these performance gains. In response, yield in short, medium and long tenors narrowed by 19.0 bps, 23.2 bps and 50.1 bps to produce an overall 28.3 bps decline in yield before closing at 8.0% (Graph 2.31).
Increased foreign capital inflows on the government securities market during July 2010 boosted the performance of short-term and long-term government securities. However, yield on medium-term government securities in the 8-9 year tenor followed a stable trend. For the most part, foreign buying was driven by positive perceptions of comparatively high returns offered in comparison to other countries in the region. Foreigner holdings of Indonesian government securities widened by Rp 10.1 trillion during July 2010, a more modest performance compared to one month earlier when the net purchase reached Rp 17.9 trillion.
The rise in net foreigner buying on the government securities market has not been matched by overall trading activity. Historically, increased foreigner activity has normally been followed by expanded volume of trading. Trading volume in July 2010 fell from Rp 5.5 trillion per day to Rp 3.6 trillion per day (Graph 2.32). Nevertheless, this did not reflect any deterioration in market confidence.
Mutual Funds Market
Positive performance in fixed income underlying assets boosted mutual funds growth, while equity funds sustained mild correction. Net Assets Value (NAV) reported by mutual funds in June 2010 widened by 1.15%. As a result, in 2010 (until July) mutual funds recorded 8.40% growth in NAV to Rp 122.6 trillion. In disaggregation by category of fund, equity, fixed income and mixed funds recorded growth at -4.4%, 10.8%
Graph 2.31 Yield SBN, BI Rate and 1-Month SBI
Graph 2.32 Yield SBN and Daily Trading Volume of SBN
������������ �
� � � � � ��
���� ���� ����
� � � � � � � � � ������� � � � � � � � � ������ � � � � � � � �
�� �� ��
�������������������������������������� �������������������
��� ��� ��� ��� ��� ��� ��� ��� ������ ��� ��� ��� ��� ��� ��� ��� ��� ��� ��� ��� ���
�
� � �� �� �� �� �� �� ��
���� ���� ���� ���� ���� ����
������� ��������������������� �����������
and -1.6%.6 These developments indicate that investment management
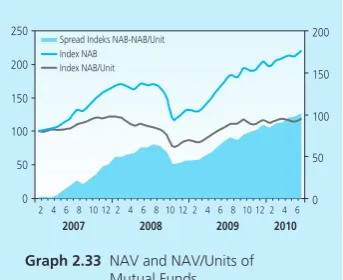
performance is not generally regarded adequate in terms of returns and risk management. In regard to returns, no investment manager has been able to outperform the benchmark (JCI), which mounted 4.2% during June 2010. However, in regard to risk, the portfolios developed by investment managers appear unable to withstand shocks and register negative growth when the overall market is on a positive growth trend. Furthermore, the rise in mutual fund NAV in recent months has been fuelled mainly by expanding holdings of fund units rather than increase in the value of managed assets (Graph 2.33).
Condition of the Banking System
Banking performance is well in positive territory. The capital adequacy ratio (CAR) during June 2010 stood at 17.4%. Healthy levels were also reported for other key indicators, such as non-performing loans (NPLs), net interest margin (NIM) and return on assets (ROA). NPLs diminished from the previous month’s level of 3.2% to 3.0% in June 2010, while return on assets and net interest margin were stable at 2.9% and 0.5% (Table 2.2). In addition to the healthy position of key indicators, steady improvement is reported in the bank intermediation function. Credit expansion in June 2010 reached Rp 54.6 trillion or 18.0% (yoy). Graph 2.33 NAV and NAV/Units of
Mutual Funds
Table 2.2
Main Indicators of Banking System
Main Indicators
Total Asset (T Rp) 2,354.3 2,331.4 2,384.6 2,388.6 2,392.7 2,439.7 2,534.1 2,501.8 2,517.0 2,563.7 2,576.3 2,604.4 2,678.3 DPK (T Rp) 1,824.3 1,806.6 1,847.0 1,857.3 1,863.5 1,897.0 1,973.0 1,948.6 1,931.6 1,982.2 1,980.5 2,013.2 2,096.0 Credit (T Rp) 1,368.9 1,370.2 1,400.4 1,399.9 1,410.4 1,430.9 1,470.8 1,435.7 1,459.7 1,485.9 1,516.0 1,561.2 1,615.8
LDR (%) 75.0 75.8 75.8 75.4 75.7 75.4 74.5 73.7 75.6 75.0 76.5 77.5 77.1
NPLs Gross* (%) 4.5 4.6 4.5 4.3 4.3 4.4 3.8 3.9 4.0 3.8 3.5 3.6 3.3
NPLs Net * (%) 1.7 1.7 1.5 1.3 1.2 1.4 0.9 1.1 1.0 1.0 0.9 1.0 0.8
CAR (%) 17.0 17.0 17.0 17.7 17.6 17.0 17.4 19.2 19.3 19.1 19.2 17.8 17.4
NIM (%) 0.5 0.5 0.5 0.4 0.5 0.5 0.5 0.5 0.5 0.5 0.5 0.5 0.5
ROA (%) 2.7 2.7 2.7 2.6 2.7 2.6 2.6 3.1 2.9 3.0 2.9 2.9 2.9
2010 2009
Jun Jul Aug Sep Oct Nov Dec Jan Feb Mar Apr May Jun
* with channeling
6 Bapepam Mutual Funds Information Centre; 1 month lag. In June 2010, the JCI sustained correction that bore negatively on equity and mixed funds as well as other products including stocks in their underlying assets.
�������������������������� ���������
��������������
� �� ��� ��� ��� ���
���� ���� ���� ����
� � � � �� �� � � � � �� �� � � � � �� �� � � � �
III. MONETARY POLICY RESPONSE
Latest Indicators
* Provisional Figures
* Using 2000 base year (BPS-Statistic Indonesia) 1) end of week
2) weighted average 3) end period closing 4) closed file
Sources : Bank Indonesia, except stock market data (BAPEPAM), CPI, export/import and GDP (BPS) FINANCIAL SECTOR
P R I C E S
EXTERNAL SECTOR
QUARTERLY INDICATOR
INTEREST RATE & STOCK One month SBI 1) Three month SBI 1) One month Deposit 2) Three month Deposit 2) One week JIBOR 2) JSX Indices 3)
MONETARY AGGREGATES (billions Rp) Base Money Quasi Money (Rupiah) Time Deposit Saving Deposit Foreign Currency Deposit Broad Money Rupiah Claim on Business Sector Credit by DMBs
CPI - monthly (%, mtm) CPI - 1 year (%, yoy)
Rp/USD (endperiod,midrate) Non oil/gas Export (f.o.b, million USD) 4) Non oil/gas Import (c$f, million USD) 4) Net International Reserve (million USD)