V olume 25 Nomor 1,Janua ri2020
JURNAL AKUNTANSI
DAN KEUANGAN
Volume 25 Nomor 1, Januari 2020
Diterbitkan oleh:
FAKULTAS EKONOMI DAN BISNIS UNIVERSITAS LAMPUNG http://feb-akuntansi.unila.ac.id/download/jak
REGINA CAELI RG , AGRIANTI KOMALASARI, KOMARUDDIN Pengaruh asset growth, financial leverage, dan liquidity terhadap risiko Sistematis pada saham lq 45 yang terdaftar di bei periode 2010-2018
RANI APRILIA, KIAGUS ANDI, YUNIA AMELIA The effect of profitability and good corporate governance on earnings quality MARGHA RETTHA AYU CHORNELIA, DWI SUHARTINI Analisis Trading Day, Trading Volume, Dan Trading Frecuency Terhadap Return Saham
Perusahaan Makanan Dan Minuman Yang Terdaftar Di Bei Periode 2016-2018 RENATA VIOLETTA BALKISH, TRI JOKO PRASETYO, BASUKI WIBOWO Analisis Hubungan Manajemen Pajak, Selisih Kurs Dan Kepemilikan Asing Dengan Transfer Pricing Perusahaan
NIKEN KUSUMAWARDANI Pemilu Serentak Dalam Kaitannya Terhadap Reaksi Pasar Modal Di Indonesia SAFITRI, DR. TRI JOKO PRASETYO, WIDYA RIZKI EKA PUTRI Pengaruh Profitabilitas,Likuiditas, Leverage, Ukuran Perusahaan, Jaminan Dan Umur Obligasi Terhadap Peringkat Obligasi (Studi Empiris Pada Perusahaan Manufaktur Yang Terdaftar Di Bursa Efek Indonesia Periode 2015-2018) SARI INDAH OKTANTI SEMBIRING Penerapan Strategi Bersaing Umkm Dan Implikasinya Terhadap Kinerja Usaha DINDA AYU DIZRISA, SUDRAJAT, NIKEN KUSUMAWARDANI Pengaruh Elemen Good Governance Terhadap Tingkat Korupsi Di Asia Tenggara)
JURNAL AKUNTANSI DAN
KEUANGAN
Volume 25 Nomor 1, Januari 2020 Penanggung Jawab: Lindrianasari Ketua Penyunting: Dewi Sukmasari Penyunting Pelaksana: Neny Desriani
Sari Indah Oktanti Sembiring Penyunting Ahli/Mitra Bestari:
Lindrianasari (Universitas Lampung) Ihyaul Ulum (Universitas Muhamadiya Malang)
Agrianti Komalasari (Universitas Lampung) Dedhy Sulistiawan (Universitas Lampung) Fajar Gustyawati Dewi (Universitas Lampung)
Khomsiyah (Universitas Trisakti) Grahita Candrarin (Unmer Malang)
Anggota Administrasi/Tata Usaha: Fergiawan
Alamat Redaksi/Penerbit: Redaksi Jurnal Akuntansi dan Keuangan Fakultas Ekonomi dan Bisnis Jurusan Akuntansi
Universitas Lampung
Jalan Prof. Sumantri Brojonegoro No. 1, Gedong Meneng Bandar Lampung 35145
Telp. (0721) 705903, Fax. (0721) 705903 [email protected]/[email protected]
JURNAL AKUNTANSI DAN
KEUANGAN
Volume 25 Nomor 1, Januari 2020Daftar isi……….... i
REGINA CAELI RG , AGRIANTI KOMALASARI, KOMARUDDIN Pengaruh asset growth, financial leverage, dan liquidity terhadap risiko
Sistematis pada saham lq 45 yang terdaftar di bei periode 2010-2018 1-13 RANI APRILIA, KIAGUS ANDI, YUNIA AMELIA
The effect of profitability and good corporate governance on earnings
quality 14-28
MARGHA RETTHA AYU CHORNELIA, DWI SUHARTINI
Analisis Trading Day, Trading Volume, Dan Trading Frecuency Terhadap Return Saham
Perusahaan Makanan Dan Minuman Yang Terdaftar Di Bei Periode 2016-2018 29-49 RENATA VIOLETTA BALKISH, TRI JOKO PRASETYO, BASUKI
WIBOWO
Analisis Hubungan Manajemen Pajak, Selisih Kurs Dan Kepemilikan
Asing Dengan Transfer Pricing Perusahaan 50 -60
NIKEN KUSUMAWARDANI
Pemilu Serentak Dalam Kaitannya Terhadap Reaksi Pasar Modal Di Indonesia 61-71 SAFITRI, DR. TRI JOKO PRASETYO, WIDYA RIZKI EKA PUTRI
Pengaruh Profitabilitas,Likuiditas, Leverage, Ukuran Perusahaan, Jaminan Dan Umur Obligasi Terhadap Peringkat Obligasi
(Studi Empiris Pada Perusahaan Manufaktur Yang Terdaftar Di Bursa Efek Indonesia
Periode 2015-2018) 72 -87
SARI INDAH OKTANTI SEMBIRING
Penerapan Strategi Bersaing Umkm Dan Implikasinya Terhadap Kinerja Usaha 88-106 DINDA AYU DIZRISA, SUDRAJAT, NIKEN KUSUMAWARDANI
Pengaruh Elemen Good Governance Terhadap Tingkat Korupsi Di Asia
* Corresponding Author. [email protected]
Jurnal Ilmiah Berkala Enam Bulanan
JURNAL AKUNTANSI DAN KEUANGAN
(JAK)
http://jurnal.feb.unila.ac.id/index.php/jak
Volume 25 Nomor 1, Januari 2020
PENGARUH ASSET GROWTH, FINANCIAL LEVERAGE, DAN
LIQUIDITY TERHADAP RISIKO SISTEMATIS PADA SAHAM
LQ 45 YANG TERDAFTAR DI BEI PERIODE 2010-2018
Regina Caeli RG 1, Dr. Agrianti Komalasari, S.E., M.Si., Akt. CA. CMA.2, Komaruddin,
S.E., M.Si., CA., CPA.3
1 Fakultas Ekonomi dan Bisnis, Universitas Lampung 2 Fakultas Ekonomi dan Bisnis, Universitas Lampung 3 Fakultas Ekonomi dan Bisnis, Universitas Lampung
Informasi Naskah Abstract
Update Naskah: Dikumpulkan: 19 Sept 2019; Diterima: 4 Oktober 2019; Terbit/Dicetak: 20 Januari 2020. Keywords:
Asset Growth, Financial Leverage, Liquidity, Systematic Risk.
The purpose of this study was to analyze the influence of asset growth, financial leverage, and liquidity to systematic risk of LQ 45 stock that listed in Indonesia Stock Exchange. This study measure systematic risk of stock by using Single Index Model as dependen variable. Independent variables that used are asset growth, financial leverage with proxy degree of financial leverage, and liquidity with proxy current ratio. Samples selection in this study were purposive sampling, which is obtained 12 companies each year within 2010-2018. And the total samples are 108. Analysis method which is used is the panel data by Eviews 10. The result of this study indicate that asset growth and financial leverage has no signifficant effect on systematic risk of stock, while liquidity has negative effect on systematic risk of stock.
* Corresponding Author. [email protected] A. PENDAHULUAN
Secara nyata, kegiatan investasi menjadi hal yang sangat penting bagi perusahaan dari berbagai sektor perekonomian. Laba yang menjadi tujuan masing-masing perusahaan belum dapat dijadikan satu-satunya sumber pendanaan bagi kegiatan operasional perusahaan. Pasar modal menjadi sarana pertemuan antara pihak kekurangan dana, yang disebut juga emiten dengan pihak yang memiliki kelebihan dana atau disebut juga investor. Salah satu instrumen pasar modal yang paling diminati investor ialah saham, sebab memberikan tingkat keuntungan yang menarik (Subhan dan Suryansyah, 2019). Namun demikian, setiap produk investasi termasuk saham memiliki keuntungan serta risikonya masing-masing. Keuntungan yang dimaksud dalam kegiatan investasi saham ialah return atau dapat disebut pula sebagai pengembalian atas kegiatan investasi yang rela dilakukan investor. Namun return tidak menjadi satu-satunya hal yang menjadi perhatian penting investor dalam keputusan berinvestasi. Investasi saham juga memiliki segala jenis ketidakpastian yang dapat terjadi kapan pun di masa mendatang. Ketidakpastian tersebut berhubungan dengan risiko yang ada.
Risiko dalam investasi saham dibagi menjadi dua jenis yaitu risiko non sistematis dan risiko sistematis. Risiko non sistematis berasal dari internal perusahaan yang contohnya risiko keuangan, risiko manajemen, dan risiko kegagalan dalam kinerja perusahaan. Sedangkan risiko sistematis atau yang disebut juga dengan risiko pasar, merupakan risiko yang bersifat sistematis dan tidak dapat dihindari. risiko sistematis tidak dapat dihilangkan oleh investor melalui diversifikasi karena berkaitan dengan risiko pasar secara umum yang dampaknya akan berpengaruh terhadap semua (banyak) perusahaan (Aji dan Prasetiono, 2015). fluktuasi risiko ini dipengaruhi oleh faktor-faktor makro yang dapat mempengaruhi pasar secara keseluruhan. Karena berhubungan dengan kondisi pasar, maka risiko sistematis bagi setiap perusahaan tentu akan saling berkorelasi. Namun tingkat kepekaan dari tiap perusahaan terhadap faktor-faktor tersebut berbeda intensitasnya.
Parameter risiko sistematis merupakan beta yang akan menunjukkan tingkat kepekaan keuntungan saham sekuritas terhadap perubahan pasar. Olеh karеnanya, menjadi pеnting bagi investor untuk memahami faktor-faktor fundamental dengan maksud sebagai cara dalam menilai saham perusahaan atau pun memprediksi risiko sistematis saham. Informasi tеrsеbut dapat digunakan invеstor dalam pеngambilan kеputusan yang lеbih baik saat mеnanamkan modalnya dalam saham sekuritas. Menurut Kusuma (2016), baik data keuangan maupun data yang berhubungan dengan pasar dapat digunakan oleh analis untuk memperkirakan risiko sistematis sekuritas.
Asset growth menjadi salah satu faktor fundamental yang dianggap berpengaruh. Asset Growth atau
pertumbuhan aset menggambarkan seberapa besar kegiatan ekspansi yang dilakukan perusahaan, yang akan mempengaruhi minat investor dalam keputusan berinvestasi. Dalam penelitian oleh Aji dan Prasetiono (2015), diperoleh bahwa asset growth berpengaruh signifikan terhadap beta saham. Ekspansi yang mengalami kegagalan akan meningkatkan beban perusahaan sehingga nilai perusahaan kurang prospektif di mata investor. Hasil tersebut selaras dengan penelitian penelitian Nainggolan dan Solikhah (2016) yang menunjukkan adanya pengaruh positif asset growth terhadap risiko sistematis. Namun terdapat perbedaan hasil dengan penelitian Priyanto (2017), yang memperoleh hasil bahwa asset growth tidak berpengaruh terhadap beta saham.
Financial leverage juga dianggap menjadi salah satu faktor yang mempengaruhi risiko sistematis. Financial leverage didefinisikan sebagai kemampuan perusahaan menggunakan kewajiban finansialnya
yang bersifat tetap untuk memperbesar pengaruh perubahan pendapatan sebelum bunga dan pajak
(earning before interest and tax) terhadap pendapatan per lembar saham biasa (earning per share).
* Corresponding Author. [email protected]
terhadap risiko sistematis saham. Terdapat perbedaan dengan penelitian yang dilakukan oleh Firlika dan Titik (2014), yang memperoleh hasil bahwa financial leverage tidak berpengaruh signifikan terhadap risiko sistematis (beta) saham. Penelitian terebut menjelaskan bahwa dapat dikatakan investor ketika membeli saham tidak memperhatikan proporsi hutang perusahaan dalam struktur modalnya.
Dan variabel lain yang digunakan dalam penelitian ini dalam memprediksi risiko sistematis ialah
liquidity. Liquidity menunjukkan kemampuan suatu perusahaan untuk memenuhi kewajiban
finansialnya yang segera harus dipenuhi (Dwiarti, 2009). Berdasarkan hasil penelitian oleh Januardi dan Arfianto (2017), liquidity memiliki pengaruh negatif signifikan terhadap risiko sistematis. Penelitian tersebut menjelaskan bahwa semakin baik kemampuan perusahaan melunasi kewajiban atau hutangnya, maka akan semakin kecil risiko perusahaan mengalami kebangkrutan. Hasil yang sama juga diperoleh dari penelitian Januardi dan Arfianto (2017) yang menunjukkan bahwa variabel liquidity (likuiditas) merupakan faktor yang berpengaruh negatif dan signifikan terhadap risiko sistematis. Hasil yang berbeda ditunjukkan dalam penelitian Handayani (2014) yang menjelaskan bahwa likuiditas tidak berpengaruh secara signifikan terhadap risiko sistematis.
B. LANDASAN TEORI DAN PENGEMBANGAN HIPOTESIS Investasi
Investasi juga dapat dipahami sebagai penanaman modal. Adapun menurut Tandelilin (2010), investasi diartikan sebagai komitmen atas sejumlah dana atau sumber daya lainnya yang dilakukan pada saat ini, dengan tujuan memperoleh sejumlah keuntungan di masa mendatang. Investasi dilakukan dengan tujuan untuk mencari atau memperoleh pendapatan atau tingkat pengembalian investasi (return) yang akan diterima di masa depan (Puspitaningtyas dan Kurniawan, 2012).
Return
Return merupakan hasil dari kegiatan investasi, yang terbagi dalam dua jenis yaitu realized return dan expected return (Handayani, 2014). Realized return merupakan return yang telah terjadi sementara expected return adalah return yang belum terjadi, dan diharapkan akan diperoleh oleh investor di masa
mendatang. Return realisasi menjadi penting karena akan digunakan untuk mengukur kinerja perusahaan dan dasar penentuan expected return serta risiko investasi di masa depan. Untuk menghitung return realisasi diperlukan data historis saham.
Risiko
Dalam saat yang bersamaan, investor memperhatikan tingkat return yang diperoleh dengan risiko yang menyertai investasi tersebut. Apabila terdapat investasi yang memberikan tingkat dengan risiko yang relatif kecil, maka sebagai investor yang rasional dan memahami hubungan risiko dan return perlu lebih cermat dan waspada (Suteja dan Gunardi, 2016). Pertimbangan yang dilakukan investor adalah menanggung risiko tertentu guna memperoleh return tertentu, atau semakin besar risiko yang berani ditanggung investor maka semakin besar pula return yang diharapkan (Suryani, 2019).
Risiko Sistematis
Risiko sistematis yang disebut sebagai beta (ß) dapat digunakan untuk mengukur volatilitas dari suatu saham atau portofolio saham bila dibandingkan dengan pasar secara keseluruhan. Beta merupakan suatu pengukur volatilitas return suatu sekuritas atau return portofolio terhadap return pasar. Ada tiga kategori kondisi penilaian beta (Husnan, 2001), dalam Sandita, dkk (2017) diuraikan atas tiga kondisi penilaian beta, yakni:
* Corresponding Author. [email protected]
1. Apabila β = 1, berarti tingkat keuntungan saham berubah secara proporsional dengan tingkat keuntungan pasar. Ini menandakan bahwa risiko sistematis saham sama dengan risiko sistematis pasar.
2. Apabila β > 1, berarti tingkat keuntungan saham meningkat lebih besar dibandingkan dengan tingkat keuntungan keseluruhan saham di pasar. Ini menandakan bahwa risiko sitematis saham lebih besar dibandingkan dengan risiko sistematis pasar, saham jenis ini sering juga disebut sebagai saham agresif.
3. Apabila β < 1, berarti tingkat keuntungan saham meningkat lebih kecil dibandingkan dengan tingkat keuntungan keseluruhan saham di pasar. Ini menandakan bahwa risiko sistematis saham lebih kecil dibandingkan dengan risiko sistematis pasar, saham jenis ini sering juga disebut sebagai saham defensif.
Asset growth
(Silalahi, 2015) mengartikan Asset growth atau pertumbuhan aktiva sebagai perubahan atau tingkat pertumbuhan tahunan dari total aktiva. Pertumbuhan aset perusahaan tinggi dalam jangka waktu yang singkat mengindikasikan bahwa perusahaan sedang mengadakan ekspansi atau perluasan usaha. Pendanaan optimum yang diperlukan perusahaan dalam perluasan usaha dapat mendorong perusahaan untuk menahan pendapatannya secara ketat. Pendapatan tersebut bukan hanya secara langsung dari laba operasional perusahaan. Pembagian dividen bagi investor juga dapat terjadi kecenderungan untuk tidak lancar dibagikan. Tentunya hal tersebut menjadi analisis investor akan saham perusahaan yang bersangkutan dan mempengaruhi minat investor.
Financial Leverage
Financial leverage merupakan penggunaan sumber dana tertentu yang akan mengakibatkan beban tetap
yang berupa biaya bunga (Handayani, 2014). Menguntungkan atau tidaknya financial leverage dapat dilihat dari pengaruhnya pada laba per lembar saham (earning per share), pajak, bunga, dan dividen yang merupakan faktor-faktor yang menyebabkan berkurangnya pendapatan pemegang saham biasa, tetapi pajak bukan merupakan kewajiban finansial tetap karena jumlah pajak akan menyesuaikan pendapatan atau laba perusahaan (Handayani, 2014). Suad (2005) memaparkan bahwa besar kecilnya
financial leverage dihitung dengan Degree of Financial Leverage (DFL). DFL menunjukkan seberapa
jauh perubahan EPS karena perubahan tertentu dari EBIT. Makin besar DFL nya, maka makin besar
financial risk perusahaan tersebut. Dan pada akhirnya menyebabkan risiko yang ditanggung investor
semakin tinggi pula. Liquidity
Liquidity menggambarkan kemampuan perusahaan untuk membayar kewajiban yang harus segera
dilunasi dengan menggunakan aktiva lancar yang dimiliki. Current ratio merupakan ukuran paling umum digunakan untuk mengetahui kesanggupan perusahaan memenuhi kewajiban jangka pendek, oleh karena rasio tersebut menunjukkan seberapa jauh tuntutan kreditur jangka pendek dipenuhi oleh aktiva yang diperkirakan menjadi uang tunai dalam periode yang sama dengan jatuh tempo hutang (Weston dan Copeland, 1992 dalam Nugroho, 2010). Dwiarti (2009) juga menjelaskan bahwa likuiditas menunjukkan kemampuan suatu perusahaan untuk memenuhi kewajiban finansialnya yang segera harus dipenuhi. Investor menilai juga dinilai bahwa kemampuan membayarkan deviden juga tinggi, sehingga akan meningkatkan minat para investor untuk memiliki atau membeli saham tersebut. Jadi, investasi pada saham perusahaan dengan likuiditas tinggi dinilai beresiko rendah.
Berdasar pada teori di atas maka dikembangkan rumusan hipotesis sebagai berikut: H1: Asset growth berpengaruh positif signifikan terhadap risiko sistematis.
* Corresponding Author. [email protected]
H3: Liquidity berpengaruh negatif terhadap risiko sistematis saham.
C. METODE PENELITIAN Populasi dan Sampel
Populasi dalam penelitian ini ialah perusahaan yang terdaftar di saham LQ45 pada Bursa Efek Indonesia pada tahun 2010-2018. Metode pemilihan sampel yang digunakan dalam penelitian berikut ialah
non-probability sampling yang disebut juga dengan metode pemilihan sampel secara tidak acak. Sampel
penelitian merupakan perusahaan yang secara konsisten tercatat dalam saham LQ 45 pada Bursa Efek Indonesia (BEI) periode 2010 - 2018, menyediakan data yang digunakan penelitian dalam laporan tahunannya, dan menggunakan satuan mata uang Rupiah dalam laporan tahunannya.
Jenis dan Sumber Data
Jenis data dalam penelitian ini adalah data sekunder, yang diperoleh dari situs resmi Bursa Efek Indonesia (www.idx.co.id) dan situs resmi perusahaan yang menjadi data penelitian berupa laporan tahunan perusahaan, (www.finance.yahoo.com) berupa data historis harga saham, serta jurnal-jurnal literatur dan sumber lainnya yang berkaitan dengan penelitian.
Definisi dan Operasionalisasi Variabel Variabel Dependen (Y)
Pada penelitian ini, variabel dependen yang digunakan ialah risiko sistematis yang diproksikan dengan beta (β). Persamaan regresi yang digunakan untuk mendapatkan koefisien regresi return saham terhadap return pasar adalah sebagai berikut (Kusuma, 2016):
Ri = αi + βi (Rmt) + ei Keterangan:
Ri = Return saham sekuritas ke-i
αi = Konstanta atau nilai ekspektasi dari return sekuritas yang independen terhadap return pasar
βi = Beta yang merupakan koefisien yang mengukur perubahan Ri akibat dari perubahan Rm
Rmt = Tingkat return dari indeks pasar, juga merupakan suatu variabel acak
ei = Kesalahan residu yang merupakan variabel acak dengan nilai ekspektasinya sama dengan nol
Langkah-langkah yang harus dilakukan untuk memperoleh persamaan tersebut yaitu sebagai berikut: 1. Menghitung tingkat return dari indeks pasar waktu ke-t, digunakan rumus:
Rmt = IHSGt−IHSGt−1 IHSGt−1
Keterangan :
Rmt = Tingkat return dari indeks pasar pada waktu tertentu IHSGt = Indeks Harga Saham Gabungan pada waktu tertentu
IHSGt-1 = Indeks Harga Saham Gabungan pada waktu lalu 2. Menghitung return saham-i pada waktu tertentu, digunakan rumus:
Rit = Pit− Pi(t−1) Pi(t−1)
Keterangan:
Rit = Tingkat return saham-i pada waktu tertentu Pit = Harga suatu saham pada waktu tertentu
* Corresponding Author. [email protected]
Pi(t-1) = Harga suatu saham pada waktu sebelumnya
Variabel Independen (X) Asset Growth
Asset growth (pertumbuhan aktiva) diukur dengan membandingkan asset pada tahun sebelumnya
dengan asset pada tahun pengamatan, yang dihitung menggunakan rumus (Nainggolan dan Solikhah, 2016):
AG = 𝐴𝑡− 𝐴𝑡−1
𝐴𝑡−1
Keterangan:
AG = Asset Growth
At = Total Asset tahun ke-t At-1 = Total Asset tahun ke t-1 Financial Leverage
Financial Leverage diproksikan dengan degree of financial leverage (DFL). Financial leverage
digunakan untuk mengukur besarnya aktiva yang dibiayai dengan hutang, menggunakan rumus berikut (Aji dan Prasetiono, 2014):
DFL = Perubahan EPS (%) Perubahan EBIT (%) Keterangan:
DFL = Degree of financial leverage
Perubahan EPS = Perubahan Earning Per Share
Perubahan EBIT = Perubahan Earning Before Interest and Tax Liquidity
Liquidity (likuiditas) diproksikan dengan current ratio. Current ratio menunjukkan persentase
kemampuan perusahaan memenuhi kewajiban jangka pendeknya.Current asset dapat dihitung menggunakan rumus (Firlika, 2014):
Current Ratio = 𝐶𝑢𝑟𝑟𝑒𝑛𝑡 𝐴𝑠𝑠𝑒𝑡
𝐶𝑢𝑟𝑟𝑒𝑛𝑡 𝐿𝑖𝑎𝑏𝑖𝑙𝑖𝑡𝑖𝑒𝑠 Metode Analisis Data
Analisis regresi yang digunakan dalam penelitian ini ialah regresi data panel. Data panel merupakan gabungan antara data time series dan cross section. Penelitian ini memiliki tiga variabel bebas yang dimasukkan ke dalam persamaan model regresi data panel yakni asset growth, financial leverage, dan
liquidity (current ratio). Sedangkan variabel terikat ialah risiko sistematis saham yang diproksikan
dengan beta saham. Berikut ini merupakan model regresi data panel dalam penelitian ini: Yit = α + β1X1it + β2X2it + β3X3it + eit
Keterangan:
* Corresponding Author. [email protected] α = Konstanta β1 - β4 = Koefisien Regresi X1 = Asset Growth X2 = Financial Leverage X3 = Liquidity (current ratio) e = error
D. ANALISIS DAN PEMBAHASAN Populasi dan Sampel Penelitian
Populasi dalam penelitian ini merupakan perusahaan yang secara konsisten terdaftar dalam indeks saham LQ45 di Bursa Efek Indonesia (BEI) selama periode 2010-2018 dengan jumlah 18 perusahaan. Dari total populasi tersebut diperoleh 12 perusahaan yang memenuhi kriteria pemilihan sampel.
Tabel 1 Kriteria Pengambilan Sampel Penelitian
No. Keterangan Jumlah Perusahaan
1. Perusahaan secara konsisten terdaftar dalam
indeks LQ45 di BEI selama periode 2010-2018 18 2. (-) Perusahaan yang tidak menyediakan data yang
digunakan penelitian dalam laporan tahunannya 4 3. (-) Perusahaan tidak menggunakan satuan mata
uang Rupiah dalam laporan tahunannya 2
Total sampel perusahaan 12
Jumlah sampel akhir 108
Analisis Statistik Deskriptif
Hasil analisis statistik deskriptif penelitian ini dapat dilihat pada tabel berikut: Tabel 2 Hasil Analisis Statistik Deskriptif
AG FL CR BETA Mean 0.149835 0.434033 2.402216 0.970016 Maximum 2.186778 13.53693 6.982079 3.663897 Minimum -0.362440 -38.38051 0.380093 -6.791090 Std.Dev. 0.230420 5.451510 1.671227 1.087695 Observations 108 108 108 108
Sumber : Hasil Olahan Data Eviews 10.
Tabel 2 menunjukkan bahwa rata-rata asset growth atau pertumbuhan asset yang dimiliki perusahaan terdaftar dalam indeks LQ45 di BEI yang menjadi sampel penelitian yaitu sebesar 0.149835. Nilai tertinggi rasio pertumbuhan aset ialah 2.186778 yang dimiliki oleh perusahaan United Tractors Tbk. pada tahun 2013. Sementara nilai minimum juga dimiliki United Tractors Tbk. sebesar -0.362440 pada tahun 2011. Selain itu dalam tabel 2 ditunjukkan bahwa standar deviasi dari asset growth sebesar 0.230420.
Tabel 2 menunjukkan bahwa rata-rata financial leverage yang dimiliki perusahaan terdaftar dalam indeks LQ 45 di BEI yang menjadi sampel penelitian yaitu sebesar 0.434033. Nilai tertinggi financial
leverage ialah 13.53693 yang dimiliki oleh perusahaan Indofood Sukses Makmur Tbk. pada tahun 2012.
Sementara nilai minimum dimiliki Indofood Sukses Makmur Tbk. sebesar -38.38051 pada tahun 2015. Selain itu dalam tabel 2 ditunjukkan bahwa standar deviasi dari financial leverage sebesar 5.451510.
* Corresponding Author. [email protected]
Tabel 2 menunjukkan bahwa rata-rata current ratio atau rasio lancar yang dimiliki perusahaan terdaftar dalam indeks LQ45 di BEI yang menjadi sampel penelitian yaitu sebesar 2.402216. Nilai tertinggi debt
to equity ratio ialah 6.982079 yang dimiliki oleh perusahaan Indocement Tunggal Prakarsa Tbk. pada
tahun 2011. Sementara nilai minimum dimiliki Jasa Marga Tbk. sebesar 0.380093 pada tahun 2018. Selain itu dalam tabel 2 ditunjukkan bahwa standar deviasi dari debt to equity ratio sebesar 1.671227. Tabel 2 menunjukkan bahwa rata-rata beta saham yang dimiliki perusahaan terdaftar dalam indeks LQ45 di BEI yang menjadi sampel penelitian yaitu sebesar 0.970016. Berdasarkan nilai tersebut dapat diartikan bahwa, rata-rata risiko sistematis saham perusahaan terdaftar indeks LQ yang menjadi sampel penelitian tersebut berarti bahwa tingkat keuntungan saham meningkat lebih kecil dibandingkan dengan tingkat keuntungan keseluruhan saham di pasar, karena nilainya kurang dari 1. Namun dapat dilihat pula bahwa nilai tersebut mengindikasikan bahwa risiko sistematis saham LQ45 hampir sama dengan risiko sistematis pasar. Nilai tertinggi beta saham ialah 3.663897 yang dimiliki oleh perusahaan Indocement Tunggal Prakarsa Tbk. pada tahun 2017. Artinya saham tersebut terlalu peka terhadap perubahan pasar karena nilainya yang lebih dari 1. Sementara nilai minimum dimiliki Bukit Asam Tbk. sebesar -6.791090 pada tahun 2010. Selain itu dalam tabel 2 ditunjukkan bahwa standar deviasi dari beta saham sebesar 1.087695, yang berarti saham tersebut tidak peka terhadap perubahan pasar sebab nilainya kurang dari 1.
Hasil Estimasi Regresi Data Panel
Berdasarkang langkah pemilihan model yang tepat dengan uji chow dan uji hausman yang telah dilakukan, maka disimpulkan bahwa model yang tepat untuk mengestimasi data panel ialah fixed effect
model dengan menggunakan eviews 10. Tabel berikut menunjukkan hasil output atas estimasi regresi
pada variabel dependen risiko sistematis saham dengan fixed effect model:
Tabel 3 Output Estimasi Regresi dengan Fixed Effect Model Variable Coefficient Std.Error t-Statistic Prob. C 2.549668 0.378062 6.744042 0.0000 AG -0.559700 0.435999 -1.283717 0.2024 FL -0.008949 0.018598 -0.481196 0.6315 CR -0.621054 0.151806 -4.091090 0.0001
Sumber : Data Olahan Eviews 10.
Berdasarkan tabel 3, maka model persamaan regresi data panel yang terbentuk ialah sebagai berikut: Yit = 2.549668 - 0.559700X1it - 0.008949X2it - 0.621054X3it + eit
Uji Asumsi Klasik Uji Multikolinearitas
Tabel 4 Hasil Uji Multikolinearitas
AG FL CR
AG 1.000000 0.004246 -0.013277 FL 0.004246 1.000000 0.039734 CR -0.013277 0.039734 1.000000
* Corresponding Author. [email protected]
Tabel 4 merupakan hasil asumsi klasik multikolinearitas yang bertujuan menguji apakah dalam model regresi data panel dalam penelitian ini ditemukan adanya korelasi yang tinggi atau sempurna antar variabel independen, yakni asset growth, financial leverage, dan liquidity. Pada ouput uji multikolinearitas di atas dapat dilihat bahwa seluruh koefisien korelasi antar variabel independen kurang dari 0,8 yang merupakan syarat bahwa keseluruhan variabel independen suatu model regresi dikatakan tidak mengalami masalah multikolinearitas.
Uji Heteroskedastisitas
Tabel 5 Hasil Uji Heteroskedastisitas
Variable Coefficient Std.Error t-Statistic Prob. C -0.240299 0.227383 -1.056801 0.2933 AG -0.227557 0.262229 -0.867781 0.3877 FL 0.004144 0.011186 0.370499 0.7119 CR 0.357057 0.091303 3.910687 0.0002
Sumber: Data Olahan Eviews 10.
Tabel 5 menunjukkan output uji heteroskedastisitas penelitian ini. Dalam tabel tersebut yang harus diperhatikan adalah nilai probabilitas. Hasil menunjukkan bahwa variabel asset growth dan financial
leverage memiliki nilai prob. lebih dari 0,05 sementara hanya variabel liquidity yang memiliki nilai prob.
kurangdari 0,05. Hal tersebut berarti menjelaskan tidak terdapat masalah heteroskedastisitas dalam model regresi penelitian.
Uji Hipotesis Uji Statistik t
Tabel 6 Data Olahan Uji Statistik t
Variable Coefficient Std.Error t-Statistic Prob. Hasil AG -0.559700 0.435999 -1.283717 0.2024 FL -0.008949 0.018598 -0.481196 0.6315 CR -0.621054 0.151806 -4.091090 0.0001 Tidak Signifikan Tidak Signifikan Signifikan
Sumber: Data Olahan Eviews 10. Asset Growth terhadap Risiko Sistematis Saham
Hipotesis atau dugaan sementara pertama yang digunakan dalam penelitian ini yaitu asset growth berpengaruh positif signifikan terhadap risiko sistematis pada saham LQ 45 di BEI periode 2010-2018.Pada tabel 4.8 diperoleh nilai koefisien regresi variabel asset growth yang merupakan variabel x1 sebesar -0.559700 dengan tingkat signifikansi t statistik sebesar 0.2024. Nilai koefisien regresi asset
growth bermakna bahwa variabel ini memiliki pengaruh negatif terhadap risiko sistematis saham.
Peningkatan asset growth setiap 1 satuan maka akan berpengaruh terhadap penurunan risiko sistematis saham sebesar 0.559700 satuan. Dan tingkat probabilitas atau signifikansi t-statistik yang ada lebih besar dibandingkan tingkat signifikansi yang digunakan penelitian ini sebesar 0,05 maka dapat dikatakan bahwa asset growth secara parsial berpengaruh tidak signifikan. Berdasarkan interpretasi hasi uji t variabel asset growth dapat ditarik kesimpulan bahwa Ha1 yang berbunyi “Adanya pengaruh signifikan positif antara asset growth terhadap risiko sistematis pada saham LQ 45 di BEI” tidak terdukung. Financial Leverage terhadap Risiko Sistematis Saham
Berdasarkan uji siginifikansi t diperoleh hasil bahwa variabel financial leverage memiliki nilai koefisien regresi sebesar -0.008949 dengan tingkat signifikansi sebesar 0.6315. Hasil tersebut diartikan bahwa
* Corresponding Author. [email protected]
berdasarkan hasil uji, variabel financial leverage berpengaruh negatif terhadap risiko sistematis sebesar 0.008949 satuan. Setiap peningkatan rasio financial leverage sebesar 1 satuan akan menyebabkan penurunan nilai risiko sistematis saham sebesar 0.008949 satuan. Begitu pula sebaliknya, jika financial
leverage mengalami penurunan nilai maka risiko sistematis saham akan mengalami peningkatan nilai.
Dan tingkat signifikansi variabel financial leverage yang bernilai 0.6315 berarti pengaruhnya secara parsial tidak signifikan terhadap risiko sistematis saham (lebih besar dibandingkan tingkat signifikansi 0,05). Maka dapat ditarik kesimpulan bahwa berdasarkan uji t signifikan, Ha2 yang menyatakan “Adanya pengaruh signifikan positif antara financial leverage terhadap risiko sistematis pada saham LQ 45 di BEI” tidak terdukung.
Liquidity terhadap Risiko Sistematis Saham
Tabel hasil uji signifikansi t menunjukkan nilai koefisien regresi variabel liquidity yang diproksikan dengan current ratio sebesar -0.621054, sementara itu nilai signifikansi sebesar 0.0001. Koefisien regresi liquidity bermakna bahwa setiap peningkatan nilai liquidity suatu perusahaan akan berpengaruh terbalik atau berpengaruh negatif terhadap risiko sistematis saham perusahaan yang tercatat di LQ 45 periode 2010-2018. Jika liquidity mengalami peningkatan sebesar 1 satuan maka risiko sistematis akan mengalami penurunan nilai sebesar 0.621054 satuan. Selain itu hasil uji t juga menunjukkan bahwa pengaruh liquidity terhadap risiko sistematis saham secara parsial ialah signifikan karena signifikansi yang dihasilkan pada uj t ini sebesar 0.0001, kurang dari tingkat signifikansi penelitian sebesar 0,05. Maka dari hasil tersebut dapat diambil kesimpulan bahwa Ha3 yang berbunyi “Adanya pengaruh signifikan negatif antara liquidity terhadap risiko sistematis pada saham LQ 45 di BEI” terdukung. Uji F
Tabel 7 Hasil Uji F Dependent
Variable:BETA
Hasil F-statistic 2.386462
Prob(F-statistic) 0.006905 Signifikan Sumber: Data Olahan Eviews 10.
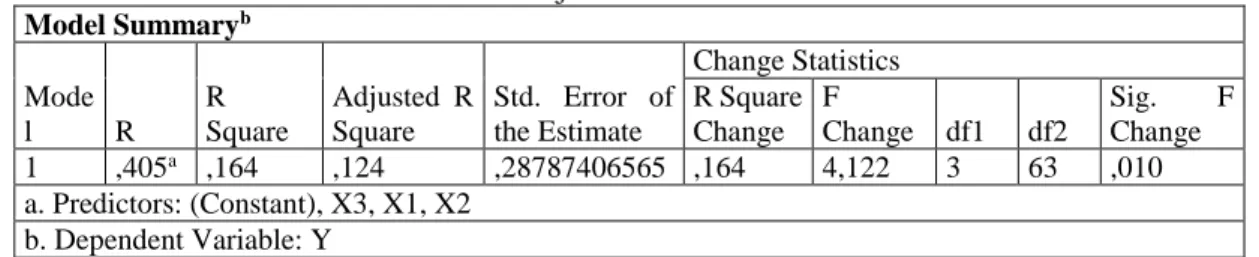
Tabel 4.9 memperlihatkan bahwa nilai F-statistic atau F hitung sebesar 2.386462 dan nilai Prob(F-statistic) atau signifikansi F-stat sebesar 0.006905. Diperoleh kesimpulan bahwa secara simultan variabel independen yang terdiri dari asset growth, financial leverage, dan liquidity berpengaruh signifikan terhadap variabel dependen yakni risiko sistematis. Karena uji F menunjukkan hasil F hitung > F tabel dan dengan nilai sig. F-stat < 0,05 maka Ho ditolak dan Ha diterima.
E. SIMPULAN DAN SARAN Kesimpulan
1. Berdasarkan hasil uji hipotesis yang telah dilakukan menunjukkan bahwa H1 terdukung dimana pajak berhubungan positif terhadap keputusan transfer pricing perusahaan. Hal ini berarti bahwa meningkatnya nilai manajemen pajak akan mempengaruhi keputusan perusahaan dalam melakukan transfer pricing.
2. Berdasarkan hasil uji hipotesis yang telah dilakukan menunjukkan bahwa H2 tidak terdukung dimana selisih kurs tidak berhubungan dengan transfer pricing perusahaan. Hal ini berarti bahwa besar kecilnya selisih kurs tidak mempengaruhi pertimbangan perusahaan dalam pengambilan keputusan untuk melakukan transfer pricing.
* Corresponding Author. [email protected]
3. Berdasarkan hasil uji hipotesis yang telah dilakukan menunjukkan bahwa H3 tidak terdukung dimana kepemilikan asing tidak berhubungan dengan transfer pricing perusahaan. Hal ini berarti bahwa besarnya proporsi saham kepemilikan asing dalam perusahaan tidak mempengaruhi keputusan perusahaan dalam menentukan transfer pricing yang akan dilakukan.
Saran
1. Penelitian selanjutnya diharapkan dapat memperluas lagi cakupan sampel sehingga sampel yang digunakan akan lebih mewakili dan hasil penelitian akan lebih akurat.
2. Sampel yang diambil tidak hanya terbatas pada perusahaan yang memiliki penjualan berelasi saja, tetapi juga perusahaan yang tidak memiliki penjualan berelasi sehingga nantinya sampel yang diambil bersifat heterogen dan dapat dibandingkan manakah yang menunjukkan hasil lebih baik.
3. Penelitian selanjutnya diharapkan dapat menggunakan proksi atau variabel-variabel lain sehingga dapat memastikan apakah variabel tersebut berpengaruh terhadap transfer pricing.
REFERENSI
Aji, Rio Satriyo dan Prasetiono.2015. Analisis Faktor-Faktor yang Mempengaruhi Risiko Sistematis (Beta) Saham pada Perusahaan Manufaktur yang Terdaftar di Bursa Efek Indonesia (BEI) Periode 2009-2014. Diponegoro Journal of Management. Vol. 4, (4).
Alaghi, Kheder. 2011. Financial Leverage and Systematic Risk. African Journal of Business
Management. Vol. 5, (15).
Alma’wa dan Agrianti. 2014. Analisis Faktor-faktor yang Mempengaruhi Underpricing pada Penawaran Umum Perdana (Studi Empiris pada Perusahaan di Bursa Efek Indonesia Tahun 2007-2011).
Jurnal Akuntansi dan Keuangan. Vol.19, (1).
D., Susilo Bambang. 2009. Pasar Modal: Mekanisme Perdagangan Saham, Analisis Sekuritas, dan
Strategi Investasi di Bursa Efek Indonesia (BEI). Yogyakarta: UPP STIM YKPN.
Dwiarti, Rina. 2009. Analisis Pengaruh Faktor-Faktor Keuangan Terhadap Risiko Sistematis di BEJ Periode Sebelum Krisis dan Selama Krisis. Jurnal Ekonomi dan Bisnis. Vol. 10, (2).
Fahmi, Irham. 2012. Pengantar Pasar Modal. Bandung: Alfabeta.
Firlika, Ranti dan Farida Titik. 2014. Pengaruh Operating Leverage, Financial Leverage, dan Current
Ratio Terhadap Risiko Sistematis (Beta) Saham pada Perusahaan Sub Sektor Makanan dan
Minuman yang Terdaftar di Bursa Efek Indonesia Periode 2010-2013. e-proceeding of
Management. Vol.1, (3)
Firmansyah, Irman. 2017. Pengaruh Price Earning Ratio Terhadap Risiko Sistematis.Jurnal Akiuntansi. Vol. 12, (1).
Handayani, Desi Wuri. 2014. Pengaruh Financial Leverage, Likuiditas, Pertumbuhan Asset, dan Ukuran Perusahaan Terhadap Beta Saham Pada Perusahaan Manufaktur yang Terdaftar di Bursa Efek Indonesia. Jurnal Dinamika Akuntansi dan Bisnis. Vol. 1, (2).
* Corresponding Author. [email protected]
Hidayat, Urike. 2001. Analisis Faktor-Faktor Yang Berpengaruh Terhadap Risiko Sistematis (β) Saham Perusahaan (Studi Empiris Pada Perusahaan Manufaktur Yang Go Publik di Bursa Efek Jakarta. Husnan, Suad. 2001. Dasar-Dasar Teori Portofolio dan Analisis Sekuritas. Edisi Kedua. Yogyakarta:
UPP-AMP YKPN.
Indra, A. Zubaidi. 2007. Analisis Pengaruh Faktor-faktor Fundamental Terhadap Risiko Sistematis Pada Perusahaan di Bursa Efek Jakarta.Jurnal Akuntansi dan Keuangan. Vol. 12, (2).
Januardi, Nana Varian dan Erman Denny Arfianto. 2017. Pengaruh Likuiditas, Leverage, Efisiensi Operasi, Dividend Payout Ratio, Profitabilitas dan Ukuran Perusahaan Terhadap Risiko Sistematis dan Non-Sistematis. Dipongoro Journal of Management. Vol.6, (3).
Jazuli, A Muhamad dan Rini Setyo Witiastuti. 2016. Determinan Beta Saham Perusahaan Real Estate dan Property di BEI. Management Analysis Journal. Vol. 5, (1).
Jogiyanto. 2003. Teori Portofolio dan Analisis Investasi. Edisi Ketiga. Yogyakarta: BPFE.
Kusuma, Indra Laila. 2016. Pengaruh Asset Growth, Debt To Equity Ratio, Return On Equity, Total
Asset Turnover dan Earning Per Share terhadap Beta Saham Pada Perusahaanyang Masuk dalam
Kelompok Jakarta Islamic Index (JII) Periode 2013-2015. Jurnal Riset Akuntansi & Keuangan. Vol. 4, (2).
Masrendra, dkk. 2010. Analisis Pengaruh Financial leverage, liquidity, asset growth dan asset size terhadap Beta Saham LQ 45 di Bursa Efek Jakarta. Jurnal Prespektif Ekonomi. Vol. 3, (2). Mudjiyono. 2012. Investasi dalam Saham & Obligasi dan Meminimalisasi Risiko Sekuritas pada Pasar
Modal Indonesia. Jurnal STIE SEMARANG, Vol. 4, (2).
Nainggolan, Nuryana dan Badingatus Solikhah. 2016. Pengaruh Asset Growth, Leverage dan Earning
Variability Terhadap Risiko Sistematik. Accounting Analysis Journal. Vol.5, (2).
Nugroho, Wahyudi. 2010. Analisis Pengaruh Return on Equity, Current Ratio, Debt Ratio, Operating
Leverage dan Asset Growth Terhadap Beta Saham Syariah di Bursa Efek Indonesia.Jurnal Bisnis Strategi. Vol. 19, (2).
Pawestri, Septi Ika dan Ratna Candra Sari. 2014. Pengaruh Leverage Operasi, Leverage Keuangan dan Leverage Total Terhadap Risiko Sistematis Saham Pada Perusahaan Manufaktur yang Terdaftar di BEI Periode Sebelum dan Sesudah Konfergensi IFRS. Jurnal Nominal. Vol.3, (1).
Priyanto, Sugeng. 2017. Pengaruh Asset Growth, Leverage dan Earning Variability Terhadap Beta Saham pada Perusahaan Jakarta Islamic Indeks di Bursa Efek Indonesia. Jurnal Ekonomika dan
Manajemen. Vol. 6, (1).
Sandita, dkk.2017. Pengaruh Degree of Operating Leverage dan Degree of Financial Leverage Terhadap Risiko Sistematis Saham. Prosiding Manajemen.Vol. 3, (2).
* Corresponding Author. [email protected]
Sapar, Jhony Fahrin. 20117. Pengaruh Faktor Fundamental Keuangan Terhadap Beta Saham pada Perusahaan Manufaktur yang Go Publik di Bursa Efek Indonesia. Jurnal Ilmiah Ekonomi Bisnis. Vol. 3, (3).
Sarinauli, dkk. 2015. Financial Leverage, Operating Leverage, Liquidity dan Pengaruhnya Terhadap Beta Saham.Jurnal Ilmiah: Buletin Ekonomi.Vol. 19, (2).
Savitri, Enni dan Lolija Pramudya. 2012. Pengaruh Leverage Terhadap Risiko Pasar Pada Perusahaan Manufaktur di Bursa Efek Indonesia. Jurnal Akuntansi, Vol. 1, (1).
Silalahi, Esli. 2015. Pengaruh Faktor Fundamental Perusahaan Terhadap Resiko Investasi pada Perusahaan yang Go Publik di Bursa Efek Indonesia. JRAK Vol 1, (1).
Suad, Husnan. 2005. Dasar-Dasar Teori Potofolio dan Analisis Sekuritas. Yogyakarta: AMP YKPN. Subhan dan Suryansyah. 2019. Analisis Minat Mahasiswa dalam Berinvestasi Saham Pada Galeri Bursa
Efek Madura.Jurnal Akuntansi dan Investasi. Vol. 3, (1).
Suhartono dan Fadlillah Qudsi. 2009. Portofolio Investasi & Bursa Efek: Pendekatan Teori dan Praktik. Yogyakarta: UPP STIM YKPN.
Suryani, Arna. 2019. Analisis Risiko Investasi dan Return Saham pada Industri Telekomunikasi yang Terdaftar di Bursa Efek Indonesia.J-MAS (Jurnal Manajemen dan Sains).Vol. 4, (1).
Suteja, Jaja dan Ardi Gunardi. 2016. Manajemen Investasi dan Portofolio. Yogyakarta: Refika Aditama. Tandelilin, Eduardus. 2010. Analisis Investasi dan Manajemen Portofolio. Edisi Pertama. Yogyakarta:
BPFE.
Utami, Dina Aprilia dan Nila Firdausi Nuzula. 2017. Analisis Pengaruh Operating Leverage dan
Financial Leverage Terhadap Risiko Sistematis Saham. Jurnal Administrasi Bisnis (JAB). Vol.
50, (2).
Weston, J Fred dan Copeland, Thomas E. 1992. Managerial Finance,9th Edition. The Dryden Press.
Widarjono, Agus. 2013. Ekonometrika: Pengantar dan Aplikasinya Disertai Panduan Eviews. Edisi Keempat. Yogyakarta: UPP STIM YKPN.
Zubir, Zalmi. 2011. Manajemen Portofolio: Penerapannya dalam Investasi Saham. Jakarta: Salemba Empat.
* Corresponding Author. [email protected]
Jurnal Ilmiah Berkala Enam Bulanan
JURNAL AKUNTANSI DAN KEUANGAN
(JAK)
http://jurnal.feb.unila.ac.id/index.php/jak
Volume 25 Nomor 1, Januari 2020
THE EFFECT OF PROFITABILITY AND GOOD CORPORATE
GOVERNANCE ON EARNINGS QUALITY
Rani Aprilia1, Kiagus Andi, S.E., M.Si., Ak., CA.2, Yunia Amelia, S.E., M.Sc., Ak., CA.,
ACPA.3
1 Faculty of Economics and Business, University of Lampung 2 Faculty of Economics and Business, University of Lampung 3 Faculty of Economics and Business, University of Lampung
Informasi Naskah Abstract
Update Naskah: Dikumpulkan: 1 Oktober 2018; Diterima: 20 Oktober 2020; Terbit/Dicetak: 20 Januari 2020. Keywords:
Profitability, Good Corporate
Governance, Earnings Quality, and Discretionary Accrual.
This study aims to examine the effect of profitability and good corporate governance on earnings quality in food and beverage companies listed on Indonesia Stock Exchange (IDX) 2015-2018 period. Profitability is calculated using Return on Assets (ROA). The proxy of Good Corporate Governance are institutional ownership, managerial ownership, audit committee, and independent commissioner. The dependent variable in this study is earnings quality measured by discretionary accrual using Modified Jones Model to detect earning management. This study used secondary data from the official website of Indonesian Stock Exchange (www.idx.co.id) and the sampling method in this study uses purposive sampling method. The data analysis in this study using multiple linear regression analysis. The results of this study indicate that profitability and audit committee have a positive effect on earnings quality, while the independent commissioner has a negative effect on earnings quality. Other independent variables i.e. institutional ownership and managerial ownership have no significant effect on earnings quali
* Corresponding Author. [email protected]
A. INTRODUCTION
In the current era of globalization, economic growth in Indonesia is very rapid. The rapid economic growth and technological advancement, creating very tight competition in the world. In this case the company must be able to improve its performance in order to be able to compete and survive in its business. From the amount of information used by external parties in assessing company performance is the financial statements. According to Statement of Financial Accounting Concepts (SFAC) No.1, earnings information is a major concern for assessing how well the management’s performance or accountability. Earnings information is an important element used by users of financial statements both internal and external parties in decision making. But it is unfortunate if the earnings displayed on the financial statements do not show actual earnings in other words the company practices earning management, so that the earnings displayed on the financial statements become unqualified (Pratama and Sunarto, 2018).
According to Krismiaji et al. (2013) in Dalimunthe et al. (2015) there are several concepts of earnings quality such as persistence, predictability, variability, ratio of cash from operation to income, changes in total accrual, discretionary accrual, relevance, and reliability. Earnings quality is earnings that correctly and accurately describe the company's operational profitability. Therefore, earnings quality is one of the information most needed by users of financial statements in the investment decision making process. According to Muid (2009) poor quality of earnings can occur because in running a company business, management is not an owner of the company. This separation of ownership will be a conflict in the control and management of the company that causes managers to act not in accordance with desire of the owners. This conflict is often referred to as agency conflict.
Motivation to meet the earnings target can encourage managers or companies to manipulate financial data and earnings. As a result, the earnings quality and financial statement have declined. Some cases of earnings manipulation that occur indirectly indicate that the quality of reported earning is still weak. The phenomenon that researcher took from various news sources indicated that there were several cases of companies that manipulated financial statement that had occurred both domestically and abroad such as cases of General Electric Company in 2019, Nissan in 2018, PT Garuda Indonesia Tbk (GIAA) in 2018, Toshiba Corp. in 2015, and so on.
Profitability is one of the factors that affect the quality of earnings that should get important attention because a company must be in a profitable condition to be able to establish its life. Furthermore, following Jensen and Meckling’s seminal work (1976), the traditional agency approach to corporate governance attempts to address the conflicts of interest between shareholders and management (Xu, 2015). Corporate governance consists of five important elements, i.e. transparency, accountability, responsibility, independence and fairness which are expected to be a way to reduce agency conflict. In this research, corporate governance mechanisms used are institutional ownership, managerial ownership, audit committee, and independent commissioner.
The existence of institutional ownership will also increase the disclosure of financial statement information widely and describe the actual situation so that it will affect the quality of earnings presented. Managerial ownership is the proportion of shareholders from the management and company directors at the end of the year for each observation period. High managerial ownership can make earnings quality better. The audit committee plays an important role in realizing Good Corporate Governance because it is the "eyes" and "ears" of the board of commissioners in order to oversee the
* Corresponding Author. [email protected]
running of the company (Effendi, 2016: 63). According to Nadirsyah and Muharram (2015) in carrying out its role in conducting supervisory function, the composition of the board can affect the management in preparing financial statements, so that a quality income statement can be obtained.
This research chooses food and beverage companies as the object of research because stocks of the food and beverage companies are the most resistant stocks to the monetary or economic crisis compared with other sectors. Companies with this category will continue to grow and develop into large and have high attractiveness for investors. And also this is because the food and beverage sub-sector company is one of the competitive business sectors that continue to experience the good profit growth, therefore this company is interesting to be researched. Based on the background the author is interested in conducting research “The Effect of Profitability and Good Corporate Governance on Earnings Quality (Empirical Study of Food and Beverage Companies Listed on Indonesia Stock Exchange 2015-2018 Period)”. B. LITERATURE REVIEW AND HYPOTHESIS DEVELOPMENT
Agency Theory
Jensen and Meckling (1976) defined the agency relationship as a contract between one or more people (principal) to ask other people (agent) to do work in accordance with the principal's interest, which includes delegation of decision making authority to agent. According to Paulus (2012) agency theory assumes that all individuals act on their own behalf. The shareholders as principals are assumed to only be interested in the increased financial results or their investments in the company. Meanwhile, the agents are assumed to receive the satisfaction in the form of financial compensation and terms that accompany the relationship. Agency theory pressures companies to get the maximum profit with the cost as efficiently as possible. Jensen and Meckling (1976) stated that there are two steps taken to reduce the actions of managers who harm external investors. The first step is external investors must do monitoring and the second is the manager itself does the limitation on bonding.
Earnings Quality
Dechow et al. (2010) defined earnings quality as the ability of earnings to explain the information contained in it that can help decision making by decision maker. Earnings quality refers to the ability of reported earnings to reflect the truth of a company's earning, as well as the usefulness of reported earnings to predict the future earnings (Bellovary et al., 2005). Earnings quality is an assessment of the company’s earning can be obtained repeatedly, can be controlled, and eligible to apply for credit / loans to bank, among other factors (Paulus, 2012). According to Subramanyam and Wild (2014: 144) earnings quality refers to the relevance of earnings in measuring the level of company performance. Determinants of earnings quality include the company's business environment and accounting principles selected and applied by the company.
Profitability
Profitability is defined as the company's ability to generate profits in an effort to increase shareholder value (Marsela and Maryono, 2017). According to Kieso (2010) in Anjelica and Prasetyawan (2014) profitability ratios are used to measure the revenue or success of a company's operations in a certain period. Profitability ratio reflects the final outcome of all financial policies and operational decisions. Profitability ratios in this research is proxy by Return on Assets (ROA). ROA serves to measure the effectiveness of the company in generating profits and utilizing its assets. This ratio is more attractive to investors as a basis for investment decision. Investors tend to invest their capital in companies that have a high level of earnings compared to companies that have a low level of earnings.
* Corresponding Author. [email protected]
Good Corporate Governance
Corporate Governance is a company's system of internal control that has as its principal aiming at the management of risks that are significant to the fulfillment of its business objectives, with a view to safeguarding the company's assets and enhancing over time the value of the shareholders investment (Effendi, 2016: 2). The objective of corporate governance is to create the value-added for all stakeholders. Bistrova and Lace (2012) stated that companies that have good corporate governance will minimize the manipulation of financial statement. Looking at the four steps of the CGPI rating assessment and the five GCG principles, i.e. transparency, accountability, responsibility, independency, fairness. The implementation of good corporate governance is expected to improve the earnings quality of company and can be trusted by the users of financial statement.
Institutional Ownership
Institutional ownership is a concentration of company shares owned by institutions (Puspitowati and Mulya, 2014). According to Irawati and Sudirman (2017) concentration of institutional ownership is a shares of companies owned by institutions such as insurance companies, investment companies and ownership of other institutions. Institution is an institution that has a major interest in investment which is conducted including stock investment, so usually the institution hands over responsibilities to certain divisions to manage the company's investment. Due to institution monitors its investment professionally, the level of control over management actions is very high so that the potential for fraud can be pressed. Managerial Ownership
Managerial ownership is the proportion of shareholders from management who participates actively in corporate decision making (directors and commissioners). Managerial ownership creates equality between manager side and the shareholders, because the manager not only has an interest as an agent but also as a principal. Not only that, managerial ownership is also able to motivate managers to improve managerial performance and company performance (Puspitowati and Mulya, 2014). According to Paulus (2012) pressure from the capital market causes companies with low managerial ownership will choose accounting methods that increase reported earnings, which actually do not reflect the economic situation of the company concerned.
Audit Committee
Ikatan Komite Audit Indonesia (IKAI) defined the audit committee as a committee that works
professionally and independently that is formed by the board of commissioners, thus its task is to assist and strengthen the function of the board of commissioners (supervisory board) in carrying out the oversight function of the financial reporting process, risk management, audit implementation, and implementation of corporate governance in companies (Effendi, 2016: 48). According to Irawati and Sudirman (2017) an effective audit committee is needed in the achievement of good corporate governance. And with the functioning of the audit committee effectively, the control of the company will be better so that agency conflicts that occur due to management's desire to improve their own welfare can be minimized.
* Corresponding Author. [email protected]
Independent commissioner according to the explanation of Article 120 section (2) of UU No. 40 Tahun
2007 concerning Perseoran Terbatas (UUPT) is "Commissioners of external parties". Article 120
section (2) UUPT also governs that independent commissioners are appointed from unaffiliated parties with a major shareholders, member of the board of directors and/or other member of the board of commissioners. The role of the commissioner is expected to minimize agency issues that arise between the board of directors and shareholders. Regulation of Otoritas Jasa Keuangan No.33/POJK.04/2014 regarding Directors and Board of Commissioners of Issuers or Public Companies explained that an independent commissioner is a member of the board of commissioners from external of company and has fulfilled the requirement as an appointed independent commissioner. The regulation is stipulated that at least 30% of independent commissioners are from the total members of the board of commissioners.
International Financial Reporting Standards
International Financial Reporting Standards (IFRS) is an international standard published by International Acconting Standards Board (IASB). In Indonesia, the IFRS implementation is published by Ikatan Akuntansi Indonesia (IAI), as an organization which is the place for accountants in Indonesia. IFRS implementation is conducted for all business sectors for companies that Go Public. In the food and beverage industry sector that has been Go Pulic, it is required to implement IFRS-based reports so that the company has very high competitiveness and will become a widely considered industry by domestic investors and international investors (Putra, 2017). The objective of IFRS is to ensure that the company's interim financial statements for the periods are included in the annual financial statements, contains high-quality information that is transparent to users and can be compared throughout the period presented, provides an adequate starting point for accounting based on IFRS, and provide benefits to users who are greater than the costs incurred (Herawati, 2011).
Hypothesis Development
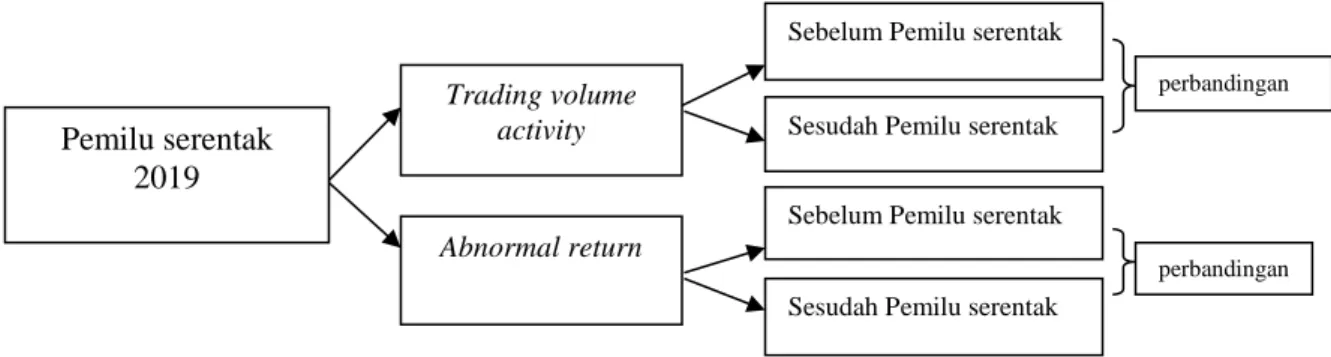
The Effect of Profitability on Earnings Quality
Profitability is the company's ability to generate profits in its operations (Reyhan, 2014). In relation to earnings quality, profitability can affect managers to do earnings management, thereby affecting the earnings quality of a company. The level of profitability can be used as a basis for making investment decisions. Return on Assets (ROA) is the company's financial ratio related to aspects of earnings or profitability. ROA functions to measure the effectiveness of a company in generating profits and utilizing its assets. So that the higher level of company profitability, the better signal for investors to keep their shares in the company.
This is in line with research conducted by Reyhan (2014) show that profitability has a significant and positive effect on earnings quality. Research by Risdawaty and Subowo (2015) stated that profitability affects earnings quality. The higher of company profitability, then the earnings quality will be stronger. Based on the description above, the hypothesis made is:
H1 : Profitability has a significant positive effect on earnings quality The Effect of Institutional Ownership on Earnings Quality
Institutional ownership will oversee management performance. According to Irawati and Sudirman (2017) a high level of institutional ownership will lead to greater oversight efforts by institutional investors, so that it can hinder managers' opportunistic behavior. Access to institutional investors that is faster and relevant to earnings management, can be used to anticipate all forms of deviant actions
* Corresponding Author. [email protected]
(Dalimunthe, 2015). Because institutions will monitor professionally the development of its investment, the level of control over management actions is very high so that the potential for fraud can be pressed. This is in line with research conducted by Budianto et al., (2018) states that institutional ownership affects the earnings quality. Research by Setianingsih (2016) also states that institutional ownership has a significant effect on the corporate earnings quality. Based on the description above, the hypothesis made is:
H2 : Institutional Ownership has a significant positive effect on earnings quality The Effect of Managerial Ownership on Earnings Quality
Managerial ownership is the level or proportion of ownership owned by managers in the company. Jensen and Meckling (1976) stated that managerial ownership has become a mechanism to reduce the agency issues of managers by aligning the interests of managers with shareholders. Because of manager has the same position as other owners, then the manager's views will be the same as other stakeholders and managers also want information that is far from manipulation.
The proportion of managerial ownership in the principles of corporate governance is mentioned to have an influence to improve the quality of the corporate earnings. Large managerial ownership in the company will unite the interests between managers and other shareholders (Dalimunthe, 2015). Research conducted by Lestari and Cahyati (2017) states that managerial ownership has a positive and significant effect on earnings quality. Based on the description above, the hypothesis made is:
H3 : Managerial Ownership has a significant positive effect on earnings quality The Effect of Audit Committee on Earnings Quality
Audit committee perception is needed by investors. Investors cannot directly supervise and observe the quality of information submitted by the company. Earnings quality as important information for investors, requires the role of an audit committee that provides perceptions and assessments of financial information through the results of supervision conducted (Dalimunthe, 2015).
The audit committee is ideally able to prevent the practice of earnings management because the audit committee has a fairly high role in order to maintain the quality of financial statements. Research conducted by Pertiwi et al. (2017) audit committee has a significant positive effect on earnings quality. This gives evidence that the existence of an audit committee can improve the effectiveness of company performance. Based on the explanation above, the hypotheses made is:
H4 : Audit Committee has a significant positive effect on earnings quality The Effect of Independent Commissioners on Earnings Quality
Independent commissioners are the best position to carry out monitoring functions in order to create a company that is corporate governance (Taruno, 2013). Independent commissioner has an objective oversight function of the company's operations without the intervention of any party's interests due to its independent nature. The existence of an independent board of commissioners who carry out their duties properly, will reduce the management fraud in the disclosure of financial information.
Strengthening the independence of boards by appointing more independent board members is a positive step toward improving earnings quality (Alves, 2014). Research conducted by Pertiwi et al. (2017)
* Corresponding Author. [email protected]
independent commissioners have a significant positive effect on earnings quality. Based on the description above, the hypothesis made is:
H5 : Independent Commissioners has a significant positive effect on earnings quality
Figure 1. The Framework
C. RESEARCH METHODOLOGY Population and Sample
The populations in this research are food and beverage companies that have gone public listed on Indonesia Stock Exchange 2015-2018 period. The samples in this research were selected based on the purposive sampling method with the following criteria: (1) The selected sample is food and beverage companies listed on Indonesia Stock Exchange in 2015-2018. (2) The company issued the financial statements for the period ended 31 December and during the observation period in 2015-2018. (3) The financial statements are reported in Rupiah. (4) The company has complete data for the measurement of all variables.
Method of Collecting Data
Type of this research data is secondary data in the form of data on companies included in the 2015 to 2018 samples obtained from the company's annual financial statements published on the Indonesia Stock Exchange website that is www.idx.co.id and also through the official website of each company, as well as from other sources that support and can be justified.
Variable Operational Definition Profitability (X1) Institutional Ownership (X2) Managerial Ownership (X3) Independent Commissioner (X5) Earnings Quality (Y) Audit Committee (X4) H1 (+) H2 (+) H3 (+) H4 (+) H5 (+)
* Corresponding Author. [email protected] Dependent Variable
Dependent variable in this research is earnings quality measured by discretionary accrual using Modified Jones Model. To obtain the value of discretionary accruals, the calculation steps are performed as follows (Dechow et al., 1995) in (Prastiti and Meiranto, 2013).
a) Calculating total accruals:
b) Calculating the value of accruals with a simple linear regression equation or Ordinary Least Square (OLS):
c) By using the regression coefficients above, the non-discretionary accrual (NDA) value can be calculated by the formula:
d) Furthermore, discretionary accrual (DA) can be calculated as follows:
Where:
TACCit : Total Accruals for i company in t period NIit : Net Income of i company in t period
OCFit : Operating Cash Flow of i company in t period Ait-1 : Total assets of i company in t-1 period
∆REVt : Changes in sales of i company in t period PPEt : Fixed assets of i company in t period
: Regression coefficient
∆RECt : Change in receivables of i company in t period NDAit : Non- discretionary accruals of i company in t period DACCit : Discretionary Accruals of i company in t period
e : error
Independent Variables Profitability
In this research the profitability is calculated using Return on Assets (ROA) which is the ratio between earnings after tax and total assets. The formula used to calculate ROA as follows (Reyhan, 2014):
Institutional Ownership
Institutional Ownership measured using an indicator of the percentage of the number of shares owned by the institution of all outstanding share capital (Beiner et al., 2003) in (Irawati and Sudirman, 2017):
* Corresponding Author. [email protected] Managerial Ownership
The measurement of managerial ownership variables in this research is calculated based on the value of the shares owned by the company's management (Puspita, 2018).
Audit Committee
In accordance with research by Pertiwi et al. (2017), this variable is measured by divide the number of audit committee members by the minimum number of audit committee members based on standards such as the following equation:
Independent Commissioners
The measurement of independent commissioner variable in this research is by counting the number of independent commissioners divided by the number of commissioners in the company's board of commissioners composition, such as the following equation (Petiwi et al., (2017):
D. RESULTS AND DISCUSSION
Table 1. Population and Sample Selection
No. Criteria Total
1 Food and Beverage companies listed on Indonesia Stock Exchange in 2015-2018 period
26
2 Companies that do not publish the financial statements for the period ended 31 December and during the observation period in 2015-2018
(11)
3 The financial statements of companies are not reported in Rupiah (0) 4 Companies that do not have complete data for the measurement of several variables (2)
Total of company samples that fulfill the criteria 13
Total of Observation (4 years) 52
Source: Data processed, 2020
Descriptive Statistics
Descriptive statistics are used to provide an overview of the variables in the research. This data description includes the minimum, maximum, mean and standard deviation values. The following presented data processed IBM SPSS Statistics 26 regarding descriptive statistics.
Table 2. Descriptive Statistics Results
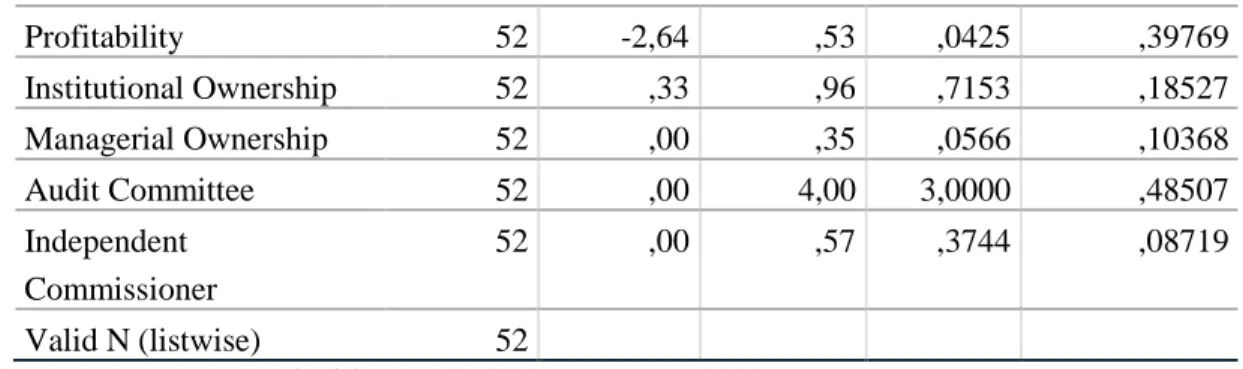
N Minimum Maximum Mean Std. Deviation
* Corresponding Author. [email protected] Profitability 52 -2,64 ,53 ,0425 ,39769 Institutional Ownership 52 ,33 ,96 ,7153 ,18527 Managerial Ownership 52 ,00 ,35 ,0566 ,10368 Audit Committee 52 ,00 4,00 3,0000 ,48507 Independent Commissioner 52 ,00 ,57 ,3744 ,08719 Valid N (listwise) 52
Source: Data processed with IBM SPSS 26 Program, 2020
The results of descriptive statistics show the mean value of Earning Quality (DA) of -0.0401; minimum value of -0.64; the maximum value of 0.12. The mean value of Profitability is 0.0425; minimum value of -2.64; the maximum value of 0.53. The mean value of Institutional Ownership is 0.7153; minimum value of 0.33; the maximum value of 0.96. The mean value of Managerial Ownership is 0.0566; minimum value of 0.00; the maximum value of 0.35. The mean value of the Audit Committee is 3.0000; minimum value of 0.00; maximum value of 4.00. The mean value of the Independent Commissioners is 0.3744; minimum value of 0.00; the maximum value of 0.57.
Discussion of Research Results
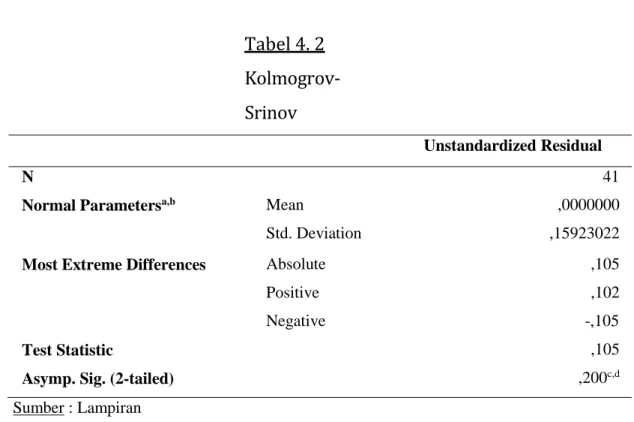
Before testing the hypothesis, in this study used data analysis using multiple regression analysis. Multiple regression analysis was chosen because in this study there is one dependent variable and more than two independent variables with the level of measurement of the variables used in the form of ratio data. After that in order to model feasible as a good parameter, then the classic assumption test is carried out. Classical assumptions consist of: normality test, multicollinearity test, autocorrelation test, and heteroscedasticity test. This research model has qualified the feasibility of the model because it has passed all the classic assumption tests, so that regression analysis and hypothesis testing can be performed. Based on the regression analysis output, the regression model is obtained as follows:
Y = -0,171 + 0,233 ROA + 0,019 IO + 0,129 MO + 0,082 AC – 0,388 IC Determination Coefficient Test (Adjusted R2)
Table 3. Determination Coefficient Test Results
Model R R Square Adjusted R Square Std. Error of the Estimate
1 ,812a ,660 ,623 ,06657
Source: Data processed with IBM SPSS 26 Program, 2020
Adjusted R Square value of 0,623 which means that Profitability and Good Corporate Governance is able to explain the Earnings Quality variable of 62,3% and the remaining 37,7% is explained by other variables not included in this research model.
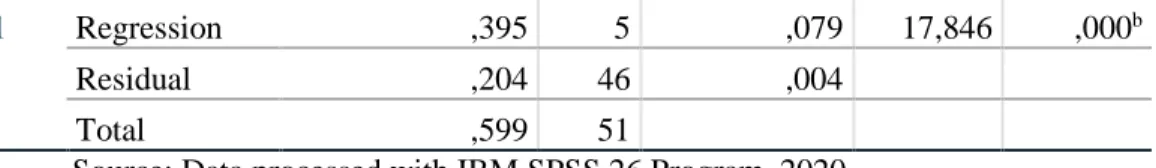
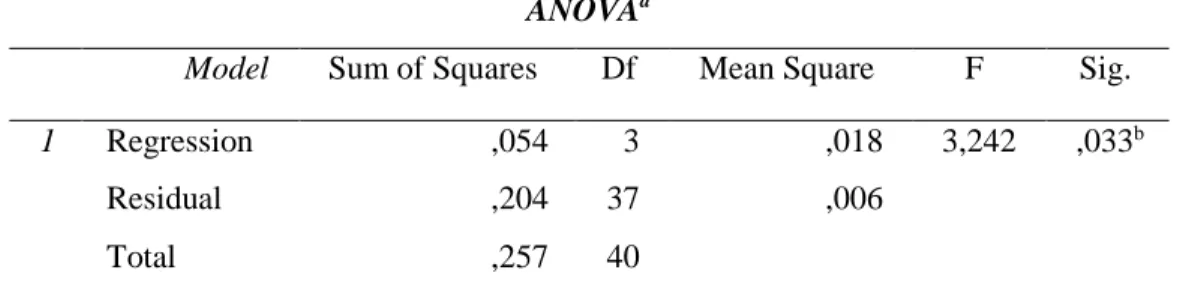
Goodness of Fit Test (F-test)
Table 4. Result of Goodness of Fit Test (F-test)