First Semester Examination 2017/2018 Academic Session January 2018
MSG460 - Survival Analysis
[Analisis Kemandirian]
Duration : 3 hours [Masa : 3 jam]Please check that this examination paper consists of FIFTEEN (15) pages of printed material before you begin the examination.
[Sila pastikan bahawa kertas peperiksaan ini mengandungi LIMA BELAS (15) muka surat yang bercetak sebelum anda memulakan peperiksaan ini.]
Instructions: Answer all four (4) questions. [Arahan: Jawab semua empat (4) soalan.]
In the event of any discrepancies, the English version shall be used.
[Sekiranya terdapat sebarang percanggahan pada soalan peperiksaan, versi Bahasa Inggeris hendaklah diguna pakai].
…2/- SULIT
Question 1
(a) In survival analysis, understanding the nature of survival data is crucial. Give two examples and reasoning for the special nature of survival data.
(b) In survival data analysis, once the definition of a survival event is in place, you have to determine what data is important to fully describe the survival event. Provide a list and description of critical information that is important to collect for any survival event.
(c) When we examine survival as a function of time, this leads us to the definition of survival rate.
(i) How would you define survival rate?
(ii) What sort of curve would represent a time-dependent survival rate?
(iii) How does the curve in (ii) reveal the behaviour of survival rates with time? (iv) Is the curve in (ii) still valid in our digital age? If no, explain why not? Is
there another curve which will better represent the survival rate?
[ 100 marks ]
Soalan 1
(a) Dalam analisis kemandirian, pemahaman ciri data kemandirian adalah sangat penting. Berikan dua contoh dan penjelasan untuk keistimewaan ciri data kemandirian.
(b) Dalam analisis data kemandirian, setelah definisi peristiwa kemandirian ditentukan, anda perlu menentukan data apa adalah penting untuk menggambarkan sepenuhnya peristiwa kemandirian. Sediakan suatu senarai dan perihalan maklumat kritikal yang penting untuk mengumpul sebarang peristiwa kemandirian.
(c) Apabila kita memeriksa kemandirian sebagai fungsi masa, ianya membawa kita kepada takrif kadar kemandirian.
(i) Bagaimana anda akan mendefinisikan kadar kemandirian?
(ii) Apakah jenis lengkungan yang akan mewakili kadar kemandirian yang bergantung kepada masa?
(iii) Bagaimanakah lengkungan dalam (ii) mendedahkan tingkah laku kadar kemandirian dengan masa?
(iv) Adakah lengkungan dalam (ii) masih sah dalam zaman digital kita? Jika tidak, jelaskan mengapa tidak? Adakah terdapat satu lagi lengkungan yang akan mewakili kadar kemandirian dengan lebih baik?
Question 2
(a) A component has a constant failure rate of λ=0.02per hour.
(i) What is the probability that it will fail during the first 10 hours of operation?
(ii) Suppose that the component has successfully operated for 100 hours. What is the probability that it will fail during the next 10 hours of operation? (b) Given a Weibull survival distribution with a shape parameter of 1/3 and a scale
parameter of 16,000, completely characterize the survival process. (i) What is the survival function of this process?
(ii) How does the shape parameter provide insight into the behaviour of this survival process?
(iii) Compute the MTTF. If the distribution is highly skewed, how would you represent a better average time to survival? Then compute the better alternative.
[ 100 marks ] Soalan 2
(a) Suatu komponen mempunyai kadar kegagalan malar λ=0.02 setiap jam.
(i) Apakah kebarangkalian bahawa ia akan gagal dalam operasi pada 10 jam pertama?
(ii) Katakan bahawa komponen telah berjaya beroperasi selama 100 jam. Apakah kebarangkalian bahawa ia akan gagal dalam operasi 10 jam seterusnya?
(b) Diberi taburan kemandirian Weibull dengan parameter bentuk 1/3 dan parameter skala 16,000, mencirikan proses kemandirian dengan sepenuhnya.
(i) Apakah fungsi kemandirian proses ini?
(ii) Bagaimanakah parameter bentuk memberi penjelasan ke atas tingkah laku proses kemandirian ini?
(iii) Kirakan MTTF. Jika taburan adalah sangat pencong, bagaimana anda akan mewakili suatu purata masa kemandirian yang lebih baik? Seterusnya, kira alternatif yang lebih baik.
[ 100 markah ]
…4/- SULIT
Question 3
(a) Suppose that you follow thirteen patients for survival and observe the following times (in months) :
5, 12, 25, 26, 27, 28, 32+, 33+, 34+, 37, 39, 40+, 42+
(The notation ‘+’ denotes ‘censoring’.)
(i) Calculate the Kaplan-Meier survival estimates for the thirteen patients. (ii) Interpret the Kaplan-Meier survival function for the thirteen patients. (iii) Find S(36) where S is the survival function.
(iv) Obtain the actuarial life table taking intervals of width six months. (v) Find the estimated hazard at the midpoint of each interval.
(vi) Discuss the strengths and weaknesses of using the product limit method and the actuarial method.
(b) The data in Table 1 gives the remission times (in weeks) for patients subjected to two different treatments. Twenty patients were assigned to each of the two treatments; ‘+’ denotes ‘right censoring’.
Table 1. Remission times (in weeks) for twenty patients
Treatment A Treatment B
1 3 3 6 7 7 10 12 14 15 18 19 22 26 28+ 29 34 40 48+ 49+
1 1 2 2 3 4 5 8 8 9 11 12 14 16 18 21 27+ 31 38+ 44
(i) Compare the survival prospects of the two groups by interpreting the graphs of their survival functions.
(ii) Obtain estimates of the probability of survival beyond 12 weeks. (iii) What is your conclusion based on the insight from parts (i) and (ii)?
Soalan 3
(a) Andaikan bahawa anda mengikuti hayat hidup tiga belas orang pesakit dan memerhatikan masa berikut (dalam bulan):
5, 12, 25, 26, 27, 28, 32 +, 33 +, 34 +, 37, 39, 40 +, 42 +
(Catatan '+' menandakan 'tapisan'.)
(i) Kirakan anggaran kemandirian Kaplan-Meier bagi 13 orang pesakit. (ii) Tafsirkan fungsi kemandirian Kaplan-Meier bagi 13 orang pesakit. (iii) Cari S (36) di mana S adalah fungsi kemandirian.
(iv) Dapatkan jadual jangka hayat aktuari dengan selang lebar enam bulan. (v) Cari anggaran bahaya di titik tengah setiap selang.
(vi) Bincangkan kekuatan dan kelemahan menggunakan kaedah had produk dan kaedah aktuari.
(b) Data dalam Jadual 1 memberikan masa remitan (dalam minggu) untuk pesakit yang diberi dua rawatan yang berbeza. Dua puluh pesakit telah ditugaskan untuk setiap dua rawatan; '+' menandakan ‘tapisan kanan’.
Jadual 1. Masa remitan (dalam minggu) untuk dua puluh pesakit
Rawatan A Rawatan B
1 3 3 6 7 7 10 12 14 15 18 19 22 26 28+ 29 34 40 48+ 49+
1 1 2 2 3 4 5 8 8 9 11 12 14 16 18 21 27+ 31 38+ 44
(i) Bandingkan prospek kemandirian kedua-dua kumpulan dengan mentafsir graf fungsi hayat mereka.
(ii) Dapatkan anggaran kebarangkalian kemandirian melebihi 12 minggu. (iii) Apakah kesimpulan anda berdasarkan pandangan dari bahagian (i) dan
(ii)?
[ 100 markah ]
…6/- SULIT
Question 4
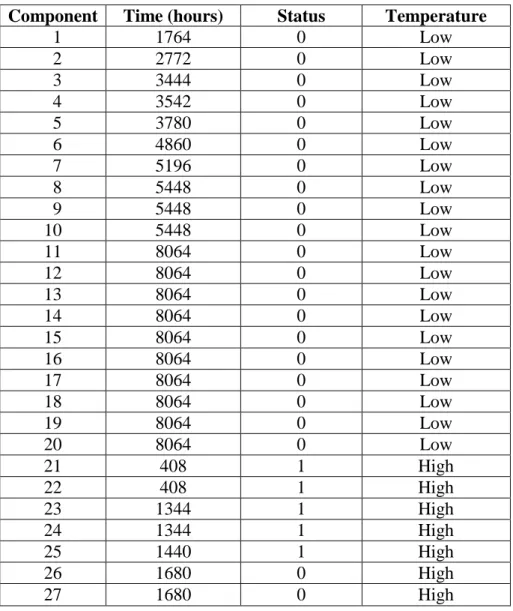
(a) The data set given in Table 2 was obtained by Nelson & Hahn (1972). Hours to failure of components are given as a function of operating temperatures (classified as Low and High). There is severe censoring (0 = censored, 1 = uncensored) with only 17 out of 40 components failing. The experiment is conducted at higher temperatures to speed up failure time.
(i) Find the distribution which provides the best fit to the failure data in Table 2.
(ii) Apply a suitable model which takes into account the accelerated process. Interpret the application of this model.
(iii) Use your favourite statistical package to obtain the acceleration factor for the components to fail.
(iv) What is your overall conclusion?
Table 2. Hours to failure of forty components.
Component Time (hours) Status Temperature
1 1764 0 Low 2 2772 0 Low 3 3444 0 Low 4 3542 0 Low 5 3780 0 Low 6 4860 0 Low 7 5196 0 Low 8 5448 0 Low 9 5448 0 Low 10 5448 0 Low 11 8064 0 Low 12 8064 0 Low 13 8064 0 Low 14 8064 0 Low 15 8064 0 Low 16 8064 0 Low 17 8064 0 Low 18 8064 0 Low 19 8064 0 Low 20 8064 0 Low 21 408 1 High 22 408 1 High 23 1344 1 High 24 1344 1 High 25 1440 1 High 26 1680 0 High 27 1680 0 High
28 1680 0 High 29 1680 0 High 30 1680 0 High 31 408 1 High 32 408 1 High 33 504 1 High 34 504 1 High 35 504 1 High 36 528 0 High 37 528 0 High 38 528 0 High 39 528 0 High 40 528 0 High
(b) One hundred and forty-nine diabetic patients were followed for 17 years (a subset of data from Lee et al., 1988). Table 3 (only 5 cases are displayed) gives the survival time from baseline examination, survival status, and several potential prognostic factors at baseline: age (years), body mass index (BMI), age at diagnosis of diabetes (years), smoking status (0=No, 1=Ex-smoker, 2=Current), systolic blood pressure (SBP), diastolic blood pressure (DBP), electrocardiogram reading (ECG) (1=Normal, 2=Borderline, 3=Abnormal), and whether the patient had any coronary heart disease (CHD) (0=No, 1=Yes).
(i) Determine the questions you ought to ask in the analysis of the data in Table 3.
(ii) Perform an appropriate analysis of the data in Table 3 (use the data file provided).
(iii) Interpret the results obtained in (ii). What can you conclude? Table 3. Data of 149 diabetic patients (first 5 cases displayed)
Patient Status Sur-vival Time (yrs) Age (yrs) BMI Age at Diagnosis (yrs) Smoking Status SBP (mmHg) DPB (mmHg) ECG CHD 1 0 12.4 44 34.2 41 0 132 96 1 0 2 0 12.4 49 32.6 48 2 130 72 1 0 3 0 9.6 49 22.0 35 2 108 58 1 1 4 0 7.2 47 37.9 45 0 128 76 2 1 5 0 14.1 43 42.2 42 2 142 80 1 0 Note that:
Status (0 = alive, 1 = dead)
Smoking status (0 = no, 1 = ex-smoker, 2 = current) ECG (1 = normal, 2 = borderline, 3 = abnormal) CHD (0 = no, 1 = yes)
[ 100 marks ] …8/- SULIT
Soalan 4
(a) Set data yang diberikan dalam Jadual 2 telah diperoleh oleh Nelson & Hahn (1972). Waktu kegagalan komponen diberikan sebagai fungsi suhu operasi (diklasifikasikan sebagai Rendah dan Tinggi). Terdapat ‘censoring’ teruk (0 = ‘censored’, 1 = ‘uncensored’) dengan hanya 17 daripada 40 komponen gagal. Eksperimen dijalankan pada suhu yang lebih tinggi untuk mempercepatkan masa kegagalan.
(i) Cari taburan yang menyediakan penyuaian terbaik untuk data kegagalan dalam Jadual 2.
(ii) Aplikasikan model yang sesuai yang mengambil kira proses dipercepatkan. Tafsirkan aplikasi model ini.
(iii) Gunakan pakej statistik kegemaran anda untuk mendapatkan faktor pecutan bagi komponen gagal.
(iv) Apakah kesimpulan anda secara keseluruhan?
Jadual 2. Jam untuk kegagalan empat puluh komponen.
Komponen Masa (jam) Status Suhu
1 1764 0 Rendah 2 2772 0 Rendah 3 3444 0 Rendah 4 3542 0 Rendah 5 3780 0 Rendah 6 4860 0 Rendah 7 5196 0 Rendah 8 5448 0 Rendah 9 5448 0 Rendah 10 5448 0 Rendah 11 8064 0 Rendah 12 8064 0 Rendah 13 8064 0 Rendah 14 8064 0 Rendah 15 8064 0 Rendah 16 8064 0 Rendah 17 8064 0 Rendah 18 8064 0 Rendah 19 8064 0 Rendah 20 8064 0 Rendah 21 408 1 Tinggi 22 408 1 Tinggi 23 1344 1 Tinggi 24 1344 1 Tinggi 25 1440 1 Tinggi 26 1680 0 Tinggi 27 1680 0 Tinggi
28 1680 0 Tinggi 29 1680 0 Tinggi 30 1680 0 Tinggi 31 408 1 Tinggi 32 408 1 Tinggi 33 504 1 Tinggi 34 504 1 Tinggi 35 504 1 Tinggi 36 528 0 Tinggi 37 528 0 Tinggi 38 528 0 Tinggi 39 528 0 Tinggi 40 528 0 Tinggi
(b) Seratus dan empat puluh sembilan pesakit kencing manis telah diikuti selama 17 tahun (subset data daripada Lee et al., 1988). Jadual 3 (hanya 5 kes dipaparkan) memberikan masa kemandirian daripada pemeriksaan asas, status hidup, dan beberapa faktor ramalan potensi pada asas: umur (tahun), indeks jisim badan (BMI), umur semasa diagnosis diabetes (tahun), status merokok (0 = Tidak, 1 = Bekas-perokok, 2 = Semasa), tekanan darah sistolik (SBP), tekanan darah diastolik (DBP), bacaan elektrokardiogram (ECG) (1 = Normal, 2 = Sempadan, 3 = Tidak Normal), dan sama ada pesakit mempunyai sebarang penyakit jantung koronari (CHD) (0 = Tiada, 1 = Ya).
(i) Tentukan soalan yang anda harus bertanya dalam analisis data dalam Jadual 3.
(ii) Lakukan analisis yang sesuai pada data dalam Jadual 3 (menggunakan fail data yang disediakan).
(iii) Tafsirkan keputusan yang diperoleh dalam (ii). Apa yang anda boleh simpulkan?
Jadual 3. Data 149 pesakit kencing manis (5 kes pertama dipaparkan)
Pesakit Status Masa Hayat (tahun)
Umur (tahun)
BMI Umur semasa Diagnosis (tahun) Status Merokok SBP (mmHg) DPB (mm Hg) ECG CHD 1 0 12.4 44 34.2 41 0 132 96 1 0 2 0 12.4 49 32.6 48 2 130 72 1 0 3 0 9.6 49 22.0 35 2 108 58 1 1 4 0 7.2 47 37.9 45 0 128 76 2 1 5 0 14.1 43 42.2 42 2 142 80 1 0 Perhatikan bahawa:
Status (0 = hidup 1, = mati)
Status merokok (0 = tidak, 1 = bekas perokok, 2 = semasa) ECG (1 = normal, 2 = sempadan, 3 = tidak normal) CHD (0 = tidak, 1 = ya)
[ 100 markah ] …10/- SULIT
APPENDIX
Summary of Reliability Formulae
0 0 ( ) 0 0 ( ) ( ) ( ) 1 ( ) ( ) ( ) ( ) ( ) ( ) ( ) ( ) ( ) ( ) ( ) ln ( ) ( ) ( ) t t H t F t f t dt R t F t dF t dR t f t dt dt f t h t R t H t h t dt R t e H t R t MTTF tf t dt R t dt − ∞ ∞ = = − = = − = = = = − = =
∫
∫
∫
∫
APPENDIKS
Ringkasan Rumus-Rumus Kebolehpercayaan
0 0 ( ) 0 0 ( ) ( ) ( ) 1 ( ) ( ) ( ) ( ) ( ) ( ) ( ) ( ) ( ) ( ) ( ) ln ( ) ( ) ( ) t t H t F t f t dt R t F t dF t dR t f t dt dt f t h t R t H t h t dt R t e H t R t MTTF tf t dt R t dt − ∞ ∞ = = − = = − = = = = − = =
∫
∫
∫
∫
…12/- SULITAPPENDIX (contd)
Summary of Reliability Formulae (contd) Lifetime following an Exponential Distribution:
( ) ( ) 1 ( ) ( ) ( ) 1 t t t f t e F t e R t e h t H t t MTTF λ λ λ λ λ λ λ − − − = = − = = = =
Lifetime following a Weibull Distribution:
1 1 1/ ( ) exp ( ) 1 ( ) ( ) ( ) 1 1 Design Life ( ln ) t t R t f t t F t e R t e h t t t H t MTTF t R β β β β β α α β β β β βα α βα α α β α − − − − − − = − = − = = = = Γ + = = − …13/-
APPENDIKS (sambung)
Ringkasan Rumus-Rumus Kebolehpercayaan (sambung) Masahayat mengikut Taburan Eksponen:
( ) ( ) 1 ( ) ( ) ( ) 1 t t t f t e F t e R t e h t H t t MTTF λ λ λ λ λ λ λ − − − = = − = = = =
Masahayat mengikut Taburan Weibull:
1 1 1/ ( ) exp ( ) 1 ( ) ( ) ( ) 1 1 Design Life ( ln ) t t R t f t t F t e R t e h t t t H t MTTF t R β β β β β α α β β β β βα α βα α α β α − − − − − − = − = − = = = = Γ + = = − …14/- SULIT
APPENDIX (contd)
Summary of Reliability Formulae (contd) Lifetime following a Normal Distribution:
2 2 1 1 ( ) ( ) exp 2 2 ( ) ( ) 1 ( ) ( ) 1 t f t t F t t R t f t h t t µ σ pσ µ σ µ σ µ σ − = − − = F − = − F = − − F
Lifetime following a Lognormal Distribution:
(
)
2 2 2 1 1 1 ( ) exp ln 2 2 1 ( ) ln 1 ( ) 1 ln exp 2 exp median median median median R median R t f t s t st t F t s t t R t s t s MTTF t t t sz p − = − = F = − F = =APPENDIKS (sambung)
Ringkasan Rumus-Rumus Kebolehpercayaan (sambung) Masahayat mengikut Taburan Normal:
2 2 1 1 ( ) ( ) exp 2 2 ( ) ( ) 1 ( ) ( ) 1 t f t t F t t R t f t h t t µ σ pσ µ σ µ σ µ σ − = − − = F − = − F = − − F
Masahayat mengikut Taburan Lognormal: