www.elsevier.comrlocaterapplanim
A laser-based method for measuring thermal
nociception of cattle
Isabelle Veissier
a,), Jeffrey Rushen
b,1, Doug Colwell
c,2,
Anne Marie de Passille
´
b,1 aINRA, Centre de Recherches de Clermont-Ferrand — Theix, Unite de Recherches sur les Herbi´ Õores, 63122
Saint Genes Champanelle, France`
b
Dairy and Swine Research and DeÕelopment Centre, Agriculture and Agri-Food Canada, LennoxÕille,
Quebec J1M 1Z3, Canada
c
Lethbridge Research Centre, Agriculture and Agri-Food Canada, Lethbridge, Alberta T1J 4B1, Canada
Accepted 17 September 1999
Abstract
We describe a method for measuring nociception in cattle using a CO2 laser aimed at the caudal aspect of the metatarsi. In Experiment 1, infrared thermography showed that calves responded by lifting their legs when skin temperatures reached 45–558C. In Experiment 2a, the validity of the method was tested by comparing the response latencies of 14 calves to two power
Ž .
settings 2.25 W vs. 4.5 W with each setting being applied six times. We found that both leg-lift latencies and tail-flick latencies were lower at the higher power setting, and the calves were more likely to respond by kicking than by simply moving the leg. The standard deviations between and within calves were smaller at the higher power setting, and the large within-calf variation means that at least three tests were required to obtain reliable measures that could differentiate between
Ž
calves. In Experiment 2b, application of the laser at a range of power settings 2.0, 3.0, 4.0, 4.5,
.
5.0 and 5.5 W on 16 calves showed that response latencies decreased as power increased up to 4.5 W, after which no further change occurred. In Experiment 3, the repeatability of the method
Ž .
was evaluated on nine measures with the high power setting 4.5 W . The coefficient of variation associated with repetition of the measures was 36%. In general, we found little change in response latencies with repeated use of the laser, except that responses on the second test tended to be shorter. Experiment 4 showed that ambient temperatures between 168C and 278C did not affect
)Corresponding author. Tel.:q33-473-624098; fax:q33-473-624118.
Ž . Ž .
E-mail addresses: [email protected] I. Veissier , [email protected] J. Rushen ,
Ž .
[email protected] D. Colwell .
1
Tel.:q1-819-5659174; fax:q1-819-5645507.
2
Fax:q1-403-3823156.
0168-1591r00r$ - see front matterq2000 Elsevier Science B.V. All rights reserved.
Ž .
response latencies, but these were longer at temperatures of 78C. We suggest that the method is a useful way of measuring cattle’s sensitivity to nociception as the animals need not be restrained and the distance to the animal need not be closely controlled. However, to obtain accurate, valid
Ž .
and reliable measures it is necessary to use a high power setting 4.5 W and take at least three consecutive measures of the response latency.q2000 Elsevier Science B.V. All rights reserved.
Keywords: Cattle; Welfare; Pain sensitivity; Nociception
1. Introduction
Aversive events are known to produce a variety of behavioural and physiological responses, generally referred to as ‘‘stress responses’’. Among these, a reduced sensitiv-ity to pain, known as ‘‘stress-induced analgesia’’, has been repeatedly found,
particu-Ž
larly in rats submitted to acute stressors, such as electric shocks or restraint Fanselow,
.
1984; Maier and Watkins, 1991; Gamaro et al., 1998 . This analgesia is dependent not only upon the physical characteristics of the aversive events, but also upon psychologi-cal components such as conditioned fear, mental representations of an aversive event
Ž
and learned helplessness Tazi et al., 1987; Fanselow et al., 1991; Maier and Watkins,
.
1991 . The effects of stress on pain sensitivity suggest that measures of nociceptive responses may be useful to assess the degree of stress that farm animals are under, and stress-induced analgesia has been recently examined in farm animals as a potential
Ž
method of assessing their responses to stress Rushen and Ladewig, 1991; Rushen et al.,
.
1999; Cook et al., 1996; Jarvis et al., 1997 .
Measures of nociception threshold of farm animals are also needed to test the efficacy
Ž
of analgesics or anaesthetics Detweiler et al., 1993; Kyles et al., 1993; Lin et al., 1994;
.
Main et al., 1995, 1997; Grant et al., 1996 , and to measure chronic pain by examining
Ž . Ž
decreased nociceptive thresholds hyperalgesia Ley et al., 1989, 1995, 1996; Whay et
.
al., 1997 .
In animals, nociception responses are usually assessed by applying a painful stimulus to the animal and measuring the animal’s latency to respond and the nature of its reaction. Nociceptive responses have been measured most often in sheep, and the
Ž
measures have been based on withdrawal responses to electrical Lin et al., 1994; Cook
. Ž
et al., 1996 , thermal Nolan et al., 1987; Ley et al., 1989; Main et al., 1995, 1997; Cook
. Ž
et al., 1996 and mechanical stimulation Detweiler et al., 1993; Kyles et al., 1993; Chambers et al., 1994; Welsh and Nolan, 1995; Cook et al., 1996; Grant et al., 1996;
.
Main et al., 1997 . Cattle’s nociceptive responses has not been measured as often.
Ž .
Pinheiro Machado et al. 1997, 1998 measured leg withdrawal responses to a hand-held
Ž .
source of radiant thermal energy, while Whay et al. 1997 recorded ear or head-flick responses to a thermal resistor attached to the ear, and leg-lift responses to mechanical pressure applied to the foreleg.
The methods used so far to measure nociceptive thresholds in farm animals suffer from a number of problems. Often the animals need to be restrained, and a device must be attached to the animal or a person must touch or be very close to the animal to
Ž .
response as handling and restraint can be stressful. In addition, the repeatability and the validity of the measures often have not been tested.
Behavioural responses to pain are diverse and include reflexive behaviours, such as limb withdrawal, as well as organised complex behaviours, such as paw licking,
Ž .
vocalisations and writhing Chapman et al., 1985, Dubner, 1994 . Reflex behaviours are
Ž
most often used to assess pain sensitivity Ley et al., 1989, 1995; Whay et al., 1997;
. Ž .
Pinheiro Machado et al., 1998 . However, as pointed by Chapman et al. 1985 , there is a number of limitations on the use of reflexes to score pain sensitivity. In particular, since reflex responses do not necessarily reflect higher nervous system functioning, other behaviours that are more complex and appear more purposive should be recorded
Ž .
as well in order to assess pain perception Dubner, 1994 .
Lasers have been used as a source of thermal energy to examine nociception in
Ž .
humans e.g., Arendt-Nielsen and Bjerring, 1988; Pertovaara et al., 1988 and a number
Ž .
of animal species e.g., Fan et al., 1995; Treede et al., 1995; Jarvis et al., 1997 . Lasers have the advantage that the light source is coherent and so the size of the beam is constant and does not vary with the distance between the animal and the energy source. In addition, the time of laser onset and offset can be precisely controlled, giving precise
Ž .
temporal and spatial boundaries to the stimulation Fan et al., 1995 . Finally, the neural basis of the nociceptive response to thermal energy is reasonably well understood
ŽTreede et al., 1995; Towell et al., 1996 . Previously, Schwartzkopf-Genswein et al.. Ž1997 and Rushen et al. 1999 described a laser-based method for measuring nocicep-. Ž .
tion in cattle which does not require the animals to be restrained. In this paper, we report the results of four experiments done to test the repeatability and validity of this method. We also attempt to take into account not only reflex responses but other behaviours that can be related to nociception.
2. General procedures
All experimental procedures were approved by the Institutional Animal Care Com-mittee at the Lennoxville Research Centre, itself monitored by the Canadian Council for Animal Care.
2.1. Description of the laser and its use
Calves’ nociceptive response was assessed by examining their reactions to a laser applied to the skin on the caudal aspect of the metatarsal. A 10-W computer-controlled
Ž .
CO laser 10600 nm, far infrared was used as the heat source, and this was attached to2
Ž
a visible, cold, helium laser, which was used to aim the CO2 laser MPB Lamsor,
.
Dorval, QC, Canada . The diameter of the CO laser beam was 5 mm. Its power, which2
Ž . Ž .
could be controlled manually, ranged from 0 laser off to 10 W maximum power .
Ž .
According to Svensson et al. 1991 who analysed verbal reports of people subjected to nociception tests, the sensory threshold of a laser stimulation corresponds to warmth while the pain threshold corresponds to a feeling of pinprick. Black body calibration
Ž
.
provided by MPB Lamsor . However, since direct measurement of skin temperature during the test would have interfered with the procedure, we report, following Fan et al.
Ž1995 , the actual energy supplied by the laser and the latency to respond rather than.
skin temperature at the time of response.
The laser was placed on a tripod approximately 2–3 m from the animal. Animals were prepared by shaving the hair off the hind legs between the dew claws and the hock the day before the experiment. The laser was aimed at the shaved area and turned on until the animal responded, immediately after which the laser was turned off. The response involved the animal moving the foot on which the laser was aimed, either by kicking, lifting the leg or simply moving the foot. The laser was also turned automati-cally off within 20 s even if the animal did not respond. Tests were interrupted and redone if the calf defecated, urinated, walked away or moved its body in response to disturbances. Testing was conducted by two persons, one acting as the laser operator, the second as an observer. Examination of the animals’ legs throughout the experiment showed no signs of blistering or skin damage for any of the animals.
2.2. Animals and housing
A total of 60 male Holstein calves were used. In experiments 1 and 4, we used castrated calves, 6–8 months of age, which were held in individual crates, 2.5 m=1.0 m, in a controlled environment facility. Water was available ad libitum to each animal,
Ž
through an automatic water dispenser. Cubed alfalfa was presented twice daily 0800
.
and 1500 h according to NRC guidelines for the age and class of animal. In experiments 2 and 3, we used uncastrated calves between 3 and 5 months of age, which were housed individually either in 1.8 m=2.0 m pens, or 0.9 m=2.0 m pens. The size of the pen was found to have no effect on the measures discussed here, and so this is not discussed in this paper. In experiment 2b, the calves were bucket-fed a commercially available milk replacer following the recommended concentrations and volumes between 0700 and 0900 and between 1500 and 1700 h. Hay was available ad libitum. In experiments 2a and 3, the calves were fed grain ad libitum and were bucket-fed a commercially available milk replacer following the recommended concentrations and volumes between 1500 and 1700 h. Hay was available ad libitum. In all experiments, the calves were kept in the same room throughout testing.
3. Experiment 1
The aim of experiment 1 was to estimate the skin surface temperature at the area of laser contact and to establish the relationship between duration of exposure and skin temperature.
3.1. Materials and methods
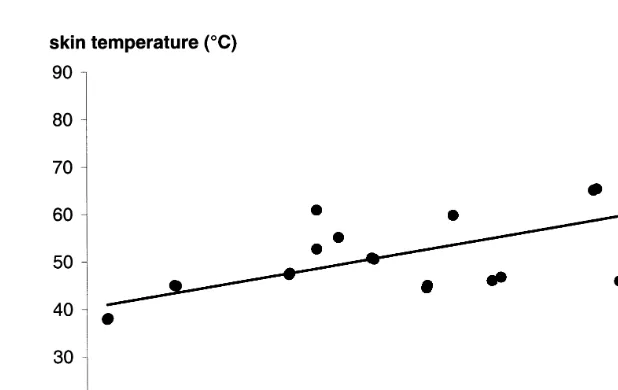
Fig. 1. Relation between skin temperature and duration of exposure to the laser. Each point is the result of one test. The best-fit regression line is shown.
1100 h. For each test the laser was set at 4.5 W and focussed on a single site and
Ž .
allowed to run for a specified time ranging from 1.25 to 10.51 s Fig. 1 .
Temperature measurement of the skin at the focus site and the immediate surrounding
Ž
tissue was done using an AGA Thermovision Model 782 thermography system AGEMA
.
Infrared Systems, Burlington, ON . Analogue images were captured on video tape, converted to digital images, and the temperature was determined using DISCO Software,
Ž .
Version 3.0 GESOTEC, Danderyd, Sweden . The AGA Thermovision system is
Ž .
accurate to 0.18C plus or minus 2% .
3.2. Results
Final skin temperatures ranged from 37.98C to 77.98C with laser exposure ranging from 1.25 to 10.51 s, although there was considerable variation from animal to animal
ŽFig. 1 . Despite this variation, there was a linear relationship between exposure time.
Ž 2 Ž . .
and skin temperature which was significant r s0.703, F 1,11 s26.089, p-0.0001 .
4. Experiment 2
The aim of experiment 2 was to test the validity of the measures by examining the effect of various power settings of the laser on the animal’s responses.
4.1. Animals and procedure
settings. A ‘‘high’’ power setting of 4.5 W was used while the ‘‘low’’ setting was 2.25 W. Each calf was tested at both settings during 1 day, following a balanced order, with at least 30 min between the two sets of tests. At each power setting, we did six tests, alternating between the left and right legs, with a pause of 15 s between subsequent
Ž . Ž .
tests. According to Svensson et al. 1991 , Zaric et al. 1996 , and Jacobson et al.
Ž1985 , this delay is sufficient to avoid habituation to the stimulus, at least when verbal.
reports and behavioural observation are considered. All six tests were completed during a period of between 1.5 and 5 min. All tests were carried out between 1200 and 1430 h. At each application of the laser, we noted the latency to move the leg and the latency to flick the tail, which usually preceded the movement of the leg. However, since the laser was turned off as soon as the leg response occurred, we could not measure tail-flick latencies if this occurred after the movement of the leg. Thus, we also report the latency of the first response to occur, regardless of whether this was the leg or the tail, as well as the latency of the leg response and the tail-flick response. We also
Ž
recorded the type of leg movement, which was scored as kicking, lifting the leg a
. Ž
vertical movement judged to be of at least 5 cm , or other leg movement which usually
.
involved the animal taking a single step . If the laser turned off automatically once the threshold of 20 s was reached, we continued to observe the calves’ behaviour for a further 5 s. Thus, the maximum latency was 25 s. We also noted the occurrence of unsuccessful tests, that is, whenever the procedure had to be interrupted because the calf walked away, urinated, defecated, or moved in response to disturbances. In addition, after the animal had responded on each test, and before the next test began, we recorded whenever the animal licked its leg, licked another part of its body, jumped, kicked, or flicked its tail. We continued to observe the animal’s behaviour until the sixth successful laser test had been finished.
In experiment 2b, the 16 remaining calves were submitted to a wider range of power settings: 2.0, 3.0, 4.0, 4.5, 5.0, and 5.5 W. At each setting, the calves were tested three times on one leg, with a delay of about 30 s between each test. At least 1 min lapsed between each setting. Half of the calves were tested by increasing the power settings, while the other half were tested with the power settings in decreasing order. On each test, we recorded only the latency of the leg response.
4.2. Statistics
After having checked that the data corresponded to a Gaussian distribution and that
Ž
variances were homogeneous, we used the GLM procedure of SAS SAS Institute,
.
1988 to analyse the latency to react to the laser. We used the following model:
Latencysb0qb1aiqb2bjqb3ckqb4dlqb5emrj
qb6 fi jqb7gi mqb8hi lqb9 jli q´i jk l m
where a , b , c , d , ei j k l mrj represent differences due to the power setting, to the order
Ž .
Ž .
which the laser was applied right vs. left, experiment 2a only , to the number of the test
Žrepetition , and to the calf nested in power order and taken as a random factor , and. Ž .
where f , g , h , ii j i m i l jl represent the interactions between the power setting and the order of the power settings, between the power setting and the calf, between the power setting and the number of the test, and between the order of the power setting and the number
Ž .
of the test experiment 2b .
We used the same GLM model to analyse the relative frequency of responses during the test that consisted of kicks, leg lifts, or other movements, and the frequency of the
Ž .
different behavioural patterns that occurred between the tests experiment 2a . However,
Ž .
the factors associated with the leg on which the laser was applied right vs. left and the test number were removed. The frequency of behaviours that occurred between the tests were expressed as a frequency per minute, since the intervals between tests were not
Ž
constant. Pearson correlations were calculated between the response to the tests based on the mean response latency and the proportion of responses that involved kicks during
.
the six tests and the behaviour between tests.
4.3. Results
4.3.1. Experiment 2a
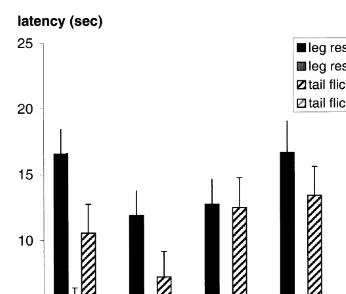
For the 14 calves submitted to the high vs. low power settings, both leg-response
Ž Ž .
latency and tail-flick latency were significantly affected by the power setting F 1,12 s
.
116 and 64 respectively; P-0.0001 in both cases ; latencies with the low power setting
Ž .
were about three times longer than with the high power setting Fig. 2 . On the low power setting, the calf did not respond within the 25 s allowed on 12% of the tests, while on the high power setting this occurred only on 1.2% of the tests. The latency to
Ž
move the leg or the tail was not significantly affected by the number of the test i.e., the
. Ž . Ž .
repetition Fig. 2 , the side on which the laser was applied right vs. left leg , or with
Ž . Ž .
the order of the power settings high then low vs. low then high P)0.10 . The power setting also had an effect on the nature of the leg response, with more kicks and fewer
Ž
other leg movements occurring with the high power setting means"SE, kicks:
. Ž
1.79"0.43; other movements: 2.14"0.52 than with the low power setting kicks:
. Ž Ž . .
0.21"0.16; other movements: 4.57"0.50 F 1,12 s10 in both cases, P-0.01 .
There was no significant difference in the frequency of leg lifts.
Ž Ž .
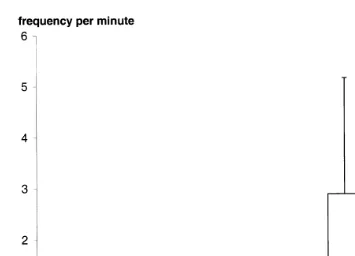
The power setting had an effect on the frequency of kicking between tests F 1,2 s
. Ž .
5.1, Ps0.05 , with more kicking occurring at the higher power setting Fig. 3 . Neither frequency of licking, of tail flicking nor of jumping between tests were affected by the
Ž . Ž .
power setting P)0.10 Fig. 3 .
Large variation was observed between calves during the test; this was significant for
Ž Ž . . Ž Ž .
the tail-flick response F 12,10 s3.7, P-0.05 but not the leg response F 12,12 s
.
1.8, P)0.10 . However, the standard deviations within calves were always greater than
Ž .
the standard deviations between calves Table 1 both for the latency of the leg response,
Ž
and for the latency of the first response which could be either the leg response or the
.
Ž .
Fig. 2. Mean"standard error of latencies of the leg response and the tail flick at a high 4.5 W and a low
Ž2.25 W power setting of the laser, when calves were tested six times at each power setting..
Significant variation was observed between calves also in the frequency of licking the
Ž Ž . .
leg between tests F 12,10 s4.6, P-0.01 but not in the frequency of the other behaviours that occurred between tests. The behaviour that occurred between tests was related to that during tests. There were positive correlations between the frequency of
Ž .
kicking during tests and the frequency of kicking rs0.70, P-0.01 and licking of the
Ž .
body rs0.57, P-0.01 between the tests. Furthermore, there was a negative correla-tion between the latency of the leg response during the tests and the amount of kicking
Ž .
between tests rs y0.56, P-0.01 . No other correlations were significant.
There was no significant effect of any factor on the frequency of interruptions of the
Ž
procedure, although this tended to be higher at the low power setting 1.6 and 0.8
.
interruptions at the low and the high power setting respectively .
4.3.2. Experiment 2b
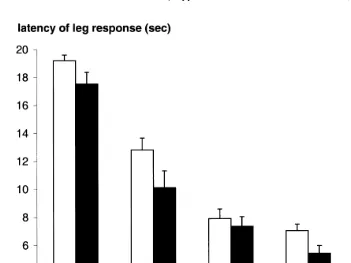
For the 16 calves submitted to a wide range of power settings, the latency to react
Ž Ž . .
Fig. 3. Mean"standard error of frequency of each behaviour that occurred between the laser tests at a high
Ž4.5 W and a low 2.25 W power setting.. Ž .
Ž .
power setting up to a setting of 4.5 W, after which it did not decrease further Fig. 4 . The order of the power setting tended to have an effect, with calves tending to react
Ž
more quickly when subjected to decreasing power settings decreasing vs. increasing
Ž . .
power settings: 8.6"0.6 s vs. 9.9"0.3 s, F 1,14 s3.6, Ps0.08 . There was no interaction between the power setting and the order with which the power settings were used and no difference between the three repetitions of the test at each power setting
Table 1
Variability within and between calves for response latency at two power settings
Mean Within calves Between calves
Ž . Ž .
SD CV % SD CV %
Leg response latency power
2.25 W 15.1 11.9 75 3.6 24
4.5 W 5.3 2.7 51 1.5 28
First response latency power
2.25 W 10.9 6.8 64 3.4 31
Fig. 4. Mean"standard error of latency of the leg response at a range of power setting of the laser.
ŽP)0.10 . There were significant differences between calves. Ž ŽF 14,70.s3.4, P
-.
0.001 .
5. Experiment 3
The objective of experiment 3 was to assess the repeatability of the calves’ responses by examining differences between tests, between days and between legs.
5.1. Animals and procedure
5.2. Statistics
Statistical analyses were similar to those used in experiment 2. The following GLM model was used:
Latencysb0qb1airnqb2bjqb3ckqb4dlqb5emrjqb6 nj qb7kn mrj
qb8 k ll qb9 jli q´k l m n
Ž
where airn, b , c , d , e , j represent differences due to the series of tests nested inj k l m n
. Ž . Ž
day , the order of the legs right leg tested first vs. left leg tested first , the side right vs.
. Ž
left leg , the number of the test, the calf identity nested in leg order and taken as a
. Ž .
random factor , and the day day 1 vs. day 2 , while kn mrj and lk l represent the interactions between the day and the calf and between the side and the test number. To
Ž .
examine the repeatability of the measure across the nine tests , we calculated the coefficient of variance associated with the repetition of the test using the MIXED
Ž .
procedure of SAS, taking all factors except the number of the test as random factors.
5.3. Results
Significant variations in the latency to respond were observed between calves
Ž ŽF 22,16.s2.26, Ps0.05 but not between the legs P. Ž )0.10 . Within each series of. Ž
tests, calves reacted more quickly on the second than on the first and third test test 1, 2
Ž .
and 3: 7.0, 5.4 and 6.5 s, F 2,162 s10.3, P-0.001, Bonferonni post hoc
compar-. Ž
isons . There was no significant difference between the 2 days day 1: 6.5"1.6 s and
.
day 2: 5.9"1.6 s, P)0.10 and latencies on day 1 were positively correlated with
Ž .
those on day 2 rs0.43, Ps0.04 .
The coefficient of variation associated to the repetitions of the test was 36%.
6. Experiment 4
The objective of experiment 4 was to examine the effect of ambient temperature on response latencies.
6.1. Animals and procedure
Ž .
Four calves were kept at four ambient temperatures, 7, 16, 20 and 268C "2.08C , the order of which was randomised. Calves were allowed 24 h to acclimatise before tests
Ž .
6.2. Results
Analysis of variance indicated that mean response latencies differed significantly
Ž ŽF 3,44.s6.846, P-0.001 . Mean response latencies. Ž"SE were 11.0. "1.1, 7.8" 0.7, 5.9"0.6 and 6.9"0.9 s for the respective ambient temperatures of 7, 16, 20 and 278C. Bonferroni post hoc comparisons showed no significant differences in response latencies between the three higher temperatures, while the response latencies at the
Ž .
lowest temperature 78C were significantly longer than at the other three temperatures.
7. Discussion
In this paper, we describe a laser-based system that provides a reliable, valid and sensitive method of measuring nociceptive responses in cattle.
The laser-based system for assessing nociception has several advantages. First, the laser does not need time to heat up or cool down and so the stimulation is constant and can be turned on and off immediately, which increases the precision of the test and reduces the risk of burning the animal. As a matter of fact, we found no signs of burning or blistering in any of these animals. Second, the animals need not be restrained. In addition the power is independent of the distance from the laser to the animal. Thus, people do not have to be close to the animals, which improves operator safety, and the distance does not have to be closely controlled. This greatly increases the range of circumstances in which nociceptive responses can be measured without disturbing the behaviour of the animal. Finally, it is not necessary to attach anything to the animal, which reduces the chance of injury to the animal and of mechanical failure. Mechanical difficulties are a particular problem with electrical resistors that are attached to the
Ž .
animal’s ear: Whay et al. 1997 report that one-third of their tests could not be completed because the resistor could not be attached to the animal’s ear.
The main disadvantages is that the animal must stand still long enough to show a clear response, although this is usually only a few seconds. We had to repeat between 12% and 20% of the tests because of interruptions due to the animal moving before a clear response was shown. Furthermore, the area of the leg to be heated must be shaved and must be kept in view of the laser.
We tested the validity of the measure by examining how the power setting of the laser affected the animal’s responses. At the higher power setting, there was a lower latency for both the leg response and the tail-flick response. When we examined a range of power settings, it was clear that the relationship with response latency was not linear: response latencies decreased as the power was increased up to 4.5 W, after which there
Ž .
was little or no further reduction in response latency experiment 2b . A nonlinear
Ž
relationship between response latency and laser setting was also noted in rats Fan et al.,
.
A number of mammalian species so far tested for responses to thermal stimulation
Ž
show behavioural responses when skin temperatures reach about 508C e.g., pigs: Rushen et al., 1990, cats: Rice and Kenshalo, 1962, sheep: Nolan et al., 1987; Ley et al.,
.
1989 . In primates, two types of A-fibre nociceptors have been identified that respond when skin temperature is at 468C and 538C respectively, while C-fibre nociceptors
Ž .
respond when skin temperature is 418C Treede et al., 1995 . Although, we could not directly measure skin temperature on the leg during the response itself, our measures of skin temperature of the thoracic region suggest a similar threshold for calves: the leg lift responses with the laser set at 4.5 W occurred between 4–7 s, when infrared
thermogra-Ž .
phy showed that skin temperatures would be between 45–658C experiment 1 . Pinheiro
Ž .
Machado et al. 1997 estimate the thermal threshold for cattle to be between 608C and 708C. In our study, there was considerable variation between animals in the relationship between exposure duration and skin temperature, which may account for this slight discrepancy. This variation could reflect factors such as colour and thickness of skin
ŽArendt-Nielsen and Bjerring, 1988 , as well as the amount of hair left after shaving..
This limits the sensitivity of the laser test to examine differences between animals in nociceptive responses.
The power setting used also affected the nature of the response: at a high power setting the calf was more likely to react by kicking than by simply moving the foot and
Ž . Ž .
more kicks occurred between tests experiment 2b . Fan et al. 1995 noted a similar change in rats in the nature of the response as the energy of the laser increased. They suggest that this indicates that the pain motor system consists of a hierarchically organised pool of motor responses, each response with different thresholds. We agree
Ž .
with Fan et al. 1995 that it is important to describe the range of behaviours that animals make in response to nociception rather than relying on the latency of a single reflexive response. However, in our laser tests, the type of leg movement the calves made to withdraw from the laser stimulus was related to the occurrence of kicking and licking between tests. Thus, the leg withdrawal response, despite it most likely being a simple reflex response, can be used as an accurate index of pain sensitivity because it predicts more complex behavioural responses. An increase in the amount of kicking is a practical advantage since it makes the response clearer, which is an advantage in using a higher power setting.
In experiment 2a, we recorded two responses of the calf, the tail flick and the movement of the leg. Generally, the tail flick preceded the leg movement by a few
Ž .
seconds, and so might be considered a more sensitive response. In rats, Fan et al. 1995 reported that a composite index based on multiple responses provided a more sensitive measure of nociception. However, in our tests, the tail flick sometimes did not occur
Žabout 20% of tests and often occurred in response to other disturbances, such as flies..
Nevertheless, we took, as an additional measure to the leg response, the latency of the
Ž
first response shown which was the latency of the tail flick when this occurred, and the
.
latency of the leg response when the tail flick did not occur . However, in experiment 2a, we did not find that this measure was noticeably better at differentiating the two power settings than the leg response alone.
and between calf standard deviation for the latency to respond were lower when a higher power setting was used. At the higher power setting, we found no difference between the latency of the leg response or that of the first response in either the within-calf or the between-calf standard deviation. We conclude that the measures are more reliable at a high power setting and that there is no advantage to take into account the tail-flick latency. In experiment 2b, with a total of nine measures taken over 2 days at a high power setting, we found a coefficient of variation of 36% associated with the repetition of the test, suggesting a reasonable degree of repeatability.
Our results suggest that, at the high power setting, at least three measures per calf would be needed in order that the standard error of the mean response latency for each calf is equal to or less than the standard deviation between calves. Indeed, we found that three measures per calf were sufficient to detect differences between the different power settings.
Responses to thermal energy are based on different types of nociceptors, each of which shows either sensitisation or habituation to repeated or prolonged stimulation
ŽTreede et al., 1995 . However, in experiment 2a, we found no significant changes in leg.
response latency over six consecutive tests, which suggests that neither habituation nor
Ž .
sensitisation occurred. Nolan et al. 1987 also found that thermal stimulation could be applied to the ear of sheep without any consistent changes in response latency. However, in experiment 3, we did find some significant changes with repeated use of the laser. In
Ž
a series of three tests, response latencies to the second test were slightly shorter 1–1.5
.
s than those on the first and third tests. A nonsignificant tendency in this direction was also noted in experiment 2a, suggesting that more than two measures should be taken. Further, there was no variation between series of tests, suggesting that calves can be repeatedly tested without substantial changes occurring in their responses. However,
Ž .
using a mechanical stimulus, Chambers et al. 1994 observed that horses repeatedly tested over several weeks learned to respond as soon as they felt the stimulus, that is, before it started to be painful. This suggests that some learning may occur with the laser method if animals are extensively tested.
Ž .
For other species, there is some controversy about the effect of initial pretest skin
Ž .
temperature on response latencies to thermal stimuli. Berge et al. 1988 and Tjolsen et
Ž .
al. 1989 reported a correlation between tail-skin temperature and response latency in
Ž .
rats, while Lichtman et al. 1993 found that response latency was independent of initial skin temperature. Although we did not directly measure initial skin temperatures, we found that ambient temperature could vary from 278C to 168C without affecting response latencies. However, response latencies were increased when ambient
tempera-Ž .
ture dropped to 78C, which is in accordance with Chambers et al. 1994 who found that sheep were less sensitive to a mechanical stimulus when air temperature fell below 88C. Thus, ambient temperatures do not need to be closely controlled as long as they fall within the range indicated.
In conclusion, we suggest that to obtain reliable measures of thermal nociception in
Ž .
cattle, it is best to use a high power setting of the laser 4.5 W , and to record the latency
Ž
to move the leg that is stimulated by taking at least three consecutive measures with a
.
as to whether the animal moves due to a disturbance outside of the test, and to recommence once this likely disturbance has disappeared. Recording the tail-flick latency, or more complex behaviours between the tests, does not improve either the validity or the reliability of the test. Finally, we recommend controlling the room temperature when running a laser test since extreme temperatures may affect the response.
Acknowledgements
We would like to thank the staff of MPB Lamsor for their help in modifying the laser to meet our specifications, and for responding to our requests for information on the laser. We also thank Martin Kavaliers, for helpful and stimulating discussions, Marjo-laine St. Louis, Christine Himsl-Rayner and Dawn Gray for excellent technical help and Ch. Durier for her very helpful advice on statistics
References
Arendt-Nielsen, L., Bjerring, P., 1988. Sensory and pain threshold characteristics to laser stimuli. J. Neurol. Neurosurgery. Psychiatr. 51, 35–42.
Berge, O.-G., Garcia-Cabrera, I., Hole, K., 1988. Response latencies in the tail-flick test depend on tail skin temperature. Neurosci. Lett. 86, 284–288.
Chambers, J.P., Waterman, A.E., Livingston, A., 1994. Further development of equipment to measure nociceptive thresholds in large animals. J. Vet. Anaesth. 21, 66–72.
Chapman, C.R., Casey, K.L., Dubner, R., Foley, K.M., Gracely, R.H., Reading, A.E., 1985. Pain measure-ment: an overview. Pain 22, 1–31.
Cook, C.J., Maasland, S.A., Devine, C.E., 1996. Social behaviour in sheep relates to behaviour and neurotransmitter responses to nociceptive stimuli. Physiol. Behav. 60, 741–751.
Detweiler, D.J., Eisenach, J.C., Tong, C., Jackson, C., 1993. A cholinergic interaction in alpha2 adrenoceptor-mediated antinociception in sheep. J. Pharmacol. Exp. Ther. 265, 536–542.
Ž .
Dubner, R., 1994. Methods of assessing pain in animals. In: Wall, P.D., Melzac, R. Eds. , Textbook of Pain. pp. 293–302.
Fan, R.J., Shyu, B.C., Hsiao, S., 1995. Analysis of nocifensive behavior induced in rats by CO laser pulse2
stimulation. Physiol. Behav. 57, 1131–1137.
Grant, C., Upton, R.N., Kuchel, T.R., 1996. Efficacy of intra-muscular analgesics for acute pain in sheep. Aust. Vet. J. 73, 129–132.
Jacobson, R.C., Chapman, C.R., Gerlach, R., 1985. Stimulus intensity and inter-stimulus interval effects on pain-related cerebral potentials. Electroencephalogr. Clin. Neurophysiol. 62, 352–363.
Jarvis, S., McLean, K.A., Chirnside, J., Deans, L.A., Calvert, S.K., Molony, V., Lawrence, A.B., 1997. Opioid-mediated changes in nociceptive threshold during pregnancy and parturition in the sow. Pain 72
Ž1–2 , 153–159..
Kyles, A.E., Waterman, A.E., Livingston, A., Vetmed, B., 1993. Antinociceptive effects of combining low doses of neuroleptic drugs and fentanyl in sheep. Am. J. Vet. Res. 54, 1483–1487.
Ley, S.J., Livingston, A., Waterman, A.E., 1989. The effect of chronic clinical pain on thermal and mechanical thresholds in sheep. Pain 39, 353–357.
Ley, S.J., Waterman, A.E., Livingston, A., 1995. A field study of the effect of lameness on mechanical nociceptive thresholds in sheep. Vet. Rec. 137, 88–88.
Lichtman, A.H., Smih, F.L., Martin, B.R., 1993. Evidence that the antinociceptive tail-flick response is produced independently from changes in either tail-skin temperature or core temperature. Pain 55, 283–295.
Lin, H.C., Wallace, S.S., Tyler, J.W., Robbins, R.L., Thurmon, J.C., Wolfe, D.F., 1994. Comparison of tiletamine–zolazepam–ketamine and tiletamine–zolazepam–ketamine–xylazine anaesthesia in sheep. Aust. Vet. J. 71, 239–242.
Main, D.C.J., Waterman, A.E., Kilpatrick, I.C., 1995. Behavioural analysis of changes in nociceptive thresholds produced by remoxipride in sheep and rats. Eur. J. Pharmacol. 287, 221–231.
Main, D.C.J., Waterman, A.E., Kilpatrick, I.C., Jones, A., 1997. An assessment of the peripheral antinocicep-tive potential of remoxipride, clonidine and fentanyl in sheep using the forelimb tourniquet. J. Vet. Pharmacol. Ther. 20, 220–228.
Nolan, A., Livingston, A., Morris, R., Waterman, A., 1987. Techniques for comparison of thermal and mechanical nociceptive stimuli in the sheep. J. Pharmacol. Methods 17, 39–49.
Pertovaara, A., Morrow, T.J., Casey, K.L., 1988. Cutaneous pain and detection thresholds to short CO laser2
pulses in humans: evidence on afferent mechanisms and the influence of varying stimulus conditions. Pain 34, 261–269.
Pinheiro Machado, F.L.C., Hurnik, J.F., Burton, J.H., 1997. The effect of amniotic fluid ingestion on the nociception of cows. Physiol. Behav. 62, 1339–1344.
Pinheiro Machado, F.L.C., Hurnik, J.F., Ewing, K.K., 1998. A thermal threshold assay to measure the nociceptive response to morphine sulphate in cattle. Can. J. Vet. Res. 62, 218–223.
Rice, C.E., Kenshalo, D.R., 1962. Nociceptive threshold measurements in the cat. J. Appl. Physiol. 17, 1009–1012.
Rushen, J., Ladewig, J., 1991. Stress-induced hypoalgesia and opioid inhibition of pigs’ responses to restraint. Physiol. Behav. 50, 1093–1096.
Rushen, J., de Passille, A.M., Schouten, W., 1990. Stereotypic behavior, endogenous opioids, and postfeeding´
hypoalgesia in pigs. Physiol. Behav. 48, 91–96.
Rushen, J., Boissy, A., Terlouw, C., de Passille, A.M.B., 1999. Opioid peptides and dairy cows: behavioral´
and physiological responses to social isolation in unfamiliar surroundings. J. Anim. Sci., in press. SAS Institute, 1988. SASrSTATIM User’s guide, Release 6.03 edn. SAS Institute, Cary, NC, 1028 pp. Schwartzkopf-Genswein, K.S., Stookey, J.M., de Passille, A.M., Rushen, J., 1997. Comparison of hot-iron and´
freeze branding on cortisol levels and pain sensitivity in beef cattle. Can. J. Anim. Sci. 77, 369–374. Svensson, P., Bjerring, P., Arendt-Nielsen, L., Nielsen, J.C., Kaaber, S., 1991. Comparison of four laser types
for experimental pain stimulation on oral mucosa and hairy skin. Lasers Surg. Med. 11, 313–324. Tjolsen, A., Lund, A., Berge, O.-G., Hole, K., 1989. An improved method for tail-flick testing with adjustment
for tail-skin temperature. J. Neurosci. Methods 26, 259–265.
Towell, A.D., Purves, A.M., Boyd, S.G., 1996. CO2 laser activation of nociceptive and non-nociceptive thermal afferents from hairy and glabrous skin. Pain 66, 79–86.
Treede, R.D., Meyer, R.A., Raja, S.N., Campbell, J.N., 1995. Evidence for two different heat transduction mechanisms in nociceptive primary afferents innervating monkey skin. J. Physiol. 482, 747–758. Welsh, E.M., Nolan, A.M., 1995. Effect of flunixin meglumine on the thresholds to mechanical stimulation in
healthy and lame sheep. Res. Vet. Sci. 58, 61–66.
Whay, H.R., Waterman, A.E., Webster, A.J.F., 1997. Association between locomotion, claw lesions and nociceptive threshold in dairy heifers during the peri-partum period. Vet. J. 154, 155–161.