Efficiency of research investments in the presence of international
spillovers: wheat research in developing countries
qMywish K. Maredia
a,∗, Derek Byerlee
baDepartment of Agricultural Economics, Michigan State University East Lansing, MI 48824-1039, USA bRural Development Department, The World Bank 1818 H St. N.W., Washington, D.C. 20433, USA
Received 5 January 1998; received in revised form 3 May 1999; accepted 10 August 1999
Abstract
Expenditures on agricultural research in the public sector, including the International Agricultural Research Centers (IARCs) have stagnated and in some cases, declined sharply in recent years. This has focused attention on issues of efficiency of agricultural research systems, especially the number, size, scope, type, and locations of their programs. This paper examines the issue of research efficiency through a case study of wheat improvement research in developing countries. The basic premise of this study is that the optimal level of research investment should be determined in a global model that incorporates direct research spill-ins. An analytical framework is developed to determine the threshold levels of crop production in a country (or a region within a country) needed to justify crop improvement research programs of different sizes in the presence of spill-ins from abroad. Spill-in coefficients are estimated from yield performance of varieties of different origins grown across a range of environments. The model is then applied to analyze the efficiency of current investments in 69 wheat improvement research programs in 35 developing countries. A major conclusion of the paper is that given the magnitude of potential spill-ins from the international research system, many wheat research programs could significantly increase the efficiency of resource use by reducing the size of their wheat research programs and focusing on the screening of varieties developed elsewhere. ©2000 Elsevier Science B.V. All rights reserved.
Keywords:Research spillovers; Wheat breeding research; Developing countries; CIMMYT; Investment efficiency
1. Introduction
The importance of technological spillovers has been widely recognized in the literature on the economics of agricultural research. The international agricultural research centers (IARCs) established in the 1960s and 1970s were specifically designed to generate spillovers
qResearch for this paper was supported by the International Maize and Wheat Improvement Center (CIMMYT), Mexico. Views expressed in this paper are those of the authors and are not to be attributed to CIMMYT, Michigan State University or the World Bank.
∗Corresponding author. Fax: +1-517-432-1800
in developing countries and thus increase the effi-ciency of the global research effort. Initially the IARCs were seen as being able to substitute for weaknesses in national agricultural research systems (NARSs) in developing countries by providing ‘finished’ technolo-gies, especially improved varieties ready for release to farmers. However, given the assumed location speci-ficity of biological technologies it was felt that with the development of local research capacity, NARSs would eventually have an advantage in developing fin-ished technologies. IARCs would then increasingly complement NARSs by providing intermediate prod-ucts that could reduce the cost to NARSs of
ing finished technologies for their own ecological and socio-economic niches (Hardin and Collins, 1974).
Investment in NARSs did indeed rise rapidly un-til the early 1980s resulting in a quadrupling of the number of scientists engaged by NARSs, as well as a sharp rise in the number of research programs, the size of those programs and the number of research stations (Pardey et al., 1991). However, the funding situation has changed markedly in the late 1980s and early 1990s. Expenditures on agricultural research in the public sector, including the IARCs have stagnated and in some cases, declined sharply. This has focused attention on issues of efficiency of agricultural re-search systems, especially the number, size, scope, type, and locations of their programs, as well as the relative role of IARCs and NARSs in technology generation.
This paper examines the issue of research efficiency through a case study of wheat improvement research in developing countries. Wheat is the second most important cereal crop in the developing world, wheat research has produced rapid and widespread impacts in the Green Revolution (Dalrymple, 1986), continu-ing in the post-Green Revolution period (Byerlee and Traxler, 1995), and as with other crops, budgets for wheat research have fallen sharply in the past decade in many NARSs and at the International Maize and Wheat Research Center or CIMMYT (the IARC re-sponsible for wheat research). The basic premise of this study is that the optimal level of research invest-ment should be determined in a global model that incorporates direct research spill-ins. An analytical framework is developed to determine the threshold levels of crop production in a country (or a region within a country) needed to justify crop improvement research programs of different sizes in the presence of spill-ins from abroad. Spill-in coefficients are esti-mated from yield performance of varieties of differ-ent origins grown across a range of environmdiffer-ents. The model is then applied to analyze the efficiency of cur-rent investments in 69 wheat improvement research programs in 35 developing countries. A major conclu-sion of the paper is that given the magnitude of po-tential spill-ins from the international research system, many wheat research programs could significantly in-crease the efficiency of resource use by reducing the size of their wheat research programs and focusing on the screening of varieties developed elsewhere.
2. Research resource allocation in the presence of spill-ins: the framework
Evenson and Binswanger (1978) develop a resource allocation framework that incorporates research spill-ins (or spillover)1 as an integral component of research program design. They lay out three general research options for a country to improve productivity through adoption of improved technology direct tech-nology transfer, adaptive research and comprehensive research. Under thedirect transferoption, a country screens technologies from other sources without con-ducting further research to modify the technology. Alternatively a country may undertake adaptive re-searchto modify or redesign technologies from other sources to better suit its own resource endowments. Finally, a country may undertake a comprehensive researchprogram by screening and adapting not only technologies from abroad but also importing scientific knowledge in order to produce its own technologies. The size and complexity of the local research pro-gram increases as a country moves from the direct transfer or screening option to the comprehensive research option, although the magnitude of resource differences for these alternative research options is an empirical question.
Many have argued that spill-ins of biological tech-nologies are limited by environmental specificity and, therefore, there is a strong case for a country to in-crease resources allocated to agricultural research, es-pecially adaptive and comprehensive research (Even-son and Kislev, 1975; Jarrett, 1982; Englander, 1991; Evenson, 1994). On the other hand, research spill-ins in the form of direct technology transfer can substi-tute for local research (Evenson and da Cruz, 1992). To the extent that such substitution is possible, a case can be made to consolidate and reduce the size of lo-cal research programs by opting for the direct transfer option (Davis, 1994).
The efficient choice among alternative options of direct transfer, adaptive research and comprehen-sive research will differ greatly across commodities, types of research and countries, depending on the
1 The words ‘spill-ins’ and ‘spillovers’ are used interchangeably
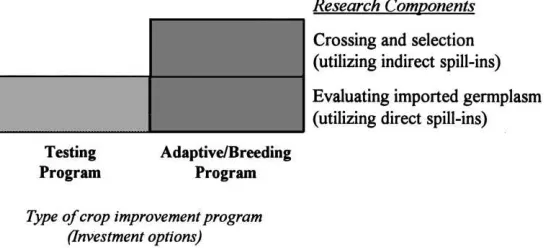
Fig. 1. Research components in a testing and adaptive/breeding programs.
size of the commodity sector, physical environment, resource costs and lags, economies of size and scope in research, and the potential for research spill-ins (Binswanger, 1974; Evenson and Binswanger, 1978). Hence, Binswanger argues that ‘the correct choice of [options]. . .and the optimal allocation of research resources requires a large amount of cost-benefit anal-ysis which takes into account the above mentioned information’ (Binswanger, 1974, p. 153). The extent that it is efficient to invest in local research capacity to create technology will depend on the importance of economies of size in research versus the marginal ben-efits from finer tailoring of technologies through more location-specific research. According to Evenson and Binswanger, ‘. . .technologies in certain sectors are such that the majority of developed or developing countries will always depend on direct transfer rather than on one of the research options’ (Evenson and Binswanger, 1978, p. 167). These sectors are charac-terized by high fixed costs to establish local research capacity and relatively little location specificity of technology (e.g. much molecular biology research). For other sectors with highly location-specific techno-logical needs and few economies of size in research, decentralized research systems will be more appro-priate.
In the specific case of crop improvement research examined in this paper, the possibilities of direct spill-ins to a given target area in the form of varieties developed by research programs outside the target area that perform well in the target area, may permit a NARS to invest in a testing program (direct transfer option) instead of a more costly adaptive breeding program (adaptive research). Likewise, the availability
from other programs of improved germplasm resis-tant to a disease may eliminate the need for extensive disease screening facilities (comprehensive research); the resistant germplasm could be directly used in the adaptive breeding program as parent material. We es-timate and use the evidence of wheat research spill-ins from other NARSs and from the IARCs responsible for wheat improvement research to illustrate the ex-tent of poex-tential direct spill-ins. We then compare the cost of adaptive research to the ‘value added’ gained by developing more location-specific technology.
3. The model
To account for the differential impacts of direct and indirect spill-ins, resource allocation decisions in a crop improvement research program are viewed here in terms of research options. For the purposes of this paper, two options are considered -- whether to invest in a (1) testing program or (2) an adaptive breeding program.
germplasm (evaluation component) to release the best adapted lines or varieties. However, it also creates new varieties by crossing local and/or imported germplasm and making selections for the best adapted materials. Thus, it utilizes both direct and indirect spill-ins from other research programs.
The difference between the yield gains from im-ported varieties and those developed from local cross-ing and selection process (refered to as ‘the yield ad-vantage’) determines the benefits of the additional in-vestments in ‘crossing and selection’ capability. The investment decision problem addressed in this paper is as follow: For a given level of yield advantage of lo-cally developed varieties, whether a crop improvement research program should invest in a testing program that relies solely on direct spillins or in an adaptive breeding program that utilizes both direct and indirect spillins.
3.1. Defining research benefits and costs
Returns from research (B) in a given time period (T) are defined as:
Bf T =PTQoKf T (1)
where,fdenotes type of research program (testing or breeding), P the per unit price of wheat ($/tonne),
Qothe total wheat production in the mandate region
without a local research program (tonnes), andKis the research-induced cumulative percentage shift in wheat production.
The estimation of research benefits Eq. (1) is based on a simplified approach to measuring economic sur-plus. The simplification stems from a number of re-strictive assumptions which are worth noting here. First, it assumes a perfectly elastic demand curve so that changes in wheat production due to research will not affect world wheat prices. While this is obviously a simplification, it seems to be a reasonable assump-tion in this study, where individual research programs are analyzed and also since the model is applied to wheat, which is a tradeable good in most developing countries. This assumption also implies that all the benefits are appropriated by producers, which is not critical in this study since it is not concerned with the distribution of economic surplus among consumers and producers but only with total surplus. Second it
assumes that outward shifts in the supply curve are due to increasing yields rather than area. To the ex-tent that new technology leads to an increase in the area planted to the researched crop, research benefits are underestimated. Third, it involves the assumpion of parallel shifts in the supply curve. Thus, it will pro-vide an overestimate of the benefits if the true shifts are pivotal or divergent rather than parallel. The ap-proach used has the advantage however, in the sense that the benefits are the same whether the result of research is seen as a fixed percentage cost reduction or a fixed yield increase in the form of a percentage increase in output.
The annual shift in aggregate production due to crop improvement research,Kf T, is defined as the sum of
research-induced cumulative yield gains due to release of new varieties,gf , weighted by the percentage of
production attributed to varieties released in current and preceding years,wTi (Appendix A).
Kf T = T X
i=1
(gfi)wiT (2)
such that, the rate of yield gain is an increasing func-tion of resources invested in research (Cf) and
re-search spill-ins (R). In other words,
gf =F (R, Cf) (3)
If we assignf= 1 for a testing program and f= 2 for a breeding program, then for a given level of direct spill-ins,R, the yield gains of a breeding program are greater than those of a testing program (i.e.g2>g1)
and so are the resources invested (i.e. C2>C1 ).
The difference (g2−g1) reflects marginal gains from
developing more location-specific varieties through adaptive breeding.
Given the available data on the total costs per scientist-year in plant breeding programs, the cost function used is:
Cf =CsSf (4)
whereCf is the total cost for a given type of a research
program;Csis the average total cost per scientist-year, including overhead costs; and Sf is the number of
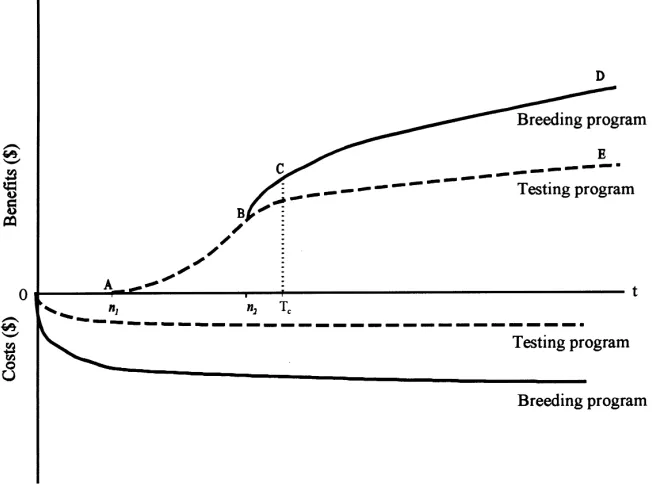
Fig. 2. Time pattern of undiscounted costs and benefits of a testing a breeding program.
fewer researchers) and an adaptive breeding program (requiring more researchers)2.
3.2. Time pattern of research benefits and costs
Adaptive crop improvement research is a contin-uous process, characterized by a flow of annual ex-penditures and a subsequent flow of annual returns as depicted in Fig. 2. The research costs are mod-eled as an annual stream of costs starting from Year 1 and related to a flow of returns after an expenditures-to-returns lag of n1 years (lag between
the initiation of research and release of first variety) for each type of program. Thus, the (undiscounted) benefit stream of a testing program is depicted by the curve ABE, and that of an adaptive breeding program is depicted by the curve ABCD.
2In a given program, the marginal cost of an additional scientist
will differ by size of the program, and therefore average costs may not accurately capture the marginal costs. However, until additional data are available to clarify this issue, this study assumes that the marginal cost is closely approximated by the average cost.
Then1andn2in Fig. 2, represent the
expenditures-to-returns lags (including the research lag and seed production lag), with subscript 1 representing a test-ing program and 2 representtest-ing an adaptive breedtest-ing program. Since, an adaptive breeding program will re-lease locally tested varieties in the initial years, the benefit stream includes two components: (1) the bene-fits of tested varieties (with yield gains =g1) from pe-riodn1ton2, and (2) the benefits of locally developed varieties (with yield gains =g2) from yearn2+ 1.
The S-shaped benefit curves for both the testing and breeding programs from yearn1toTcreflect the shape
of the logistic diffusion rate of new varieties in the mandate region, with the diffusion reaching it’s peak in the yearTc.
NPV. when discounted at the opportunity cost of cap-ital (Gittinger, 1982). Thus, the decision to establish an adaptive breeding program in a given environment is negatively related to direct spill-ins from other pro-grams,g1(which positively determines the NPV of a
testing program). This is an important and distinctive feature of this framework since it makes resource al-location decisions a function of direct spill-ins, which are assumed to be available to a program free of cost and with complete certainty.
We use the cost-benefit model discussed above for two purposes: (1) to develop a baseline for a ‘median’ wheat improvement program, using median values of key parameters in developing countries, in order to es-timate ex-ante the threshold levels of wheat produc-tion needed to justify a testing and adaptive breeding programs at different levels of spill-ins; and (2) to an-alyze the efficiency of 69 specific wheat improvement programs spread across 35 developing countries us-ing, as far as possible, country- and program-specific data. Both these analyses are based on the following assumptions: (1) past research costs, including the hu-man capital investments are sunk costs that is, benefits of past research are not accounted for in the years be-fore current research starts yielding benefits, (2) the size of wheat area, number of researchers and real costs per researcher in each program are assumed to remain constant over the period of analysis, (3) lo-cally developed varieties are assumed to enjoy yield increments higher than imported ones throughout the period of analysis, (4) research managers make deci-sions independently, assuming that they will not affect the global technology transfer pool, and (5) certainty in the continuation of research spill-ins is assumed.
4. Estimation of model parameters
The value ofg1that measures spill-ins is very crit-ical in the model. The following section describes the estimation of the potential for research spill-ins, fol-lowed by the estimation of other model parameters.
4.1. Estimation of the potential for research spill-ins
The estimation of the potential for research spill-ins is based on Maredia et al. (1996), estimate of a global wheat improvement research spillover matrix
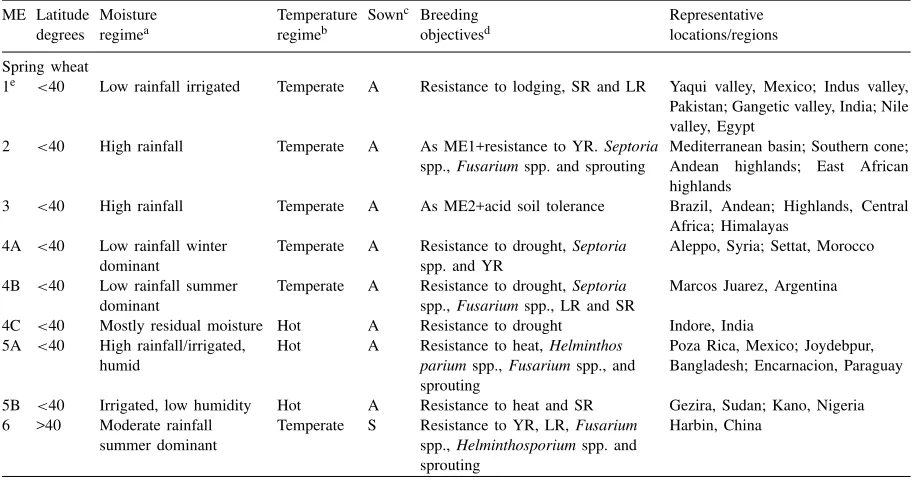
calculated using CIMMYT’s international Spring Wheat Yield trial data (Table 1). The elements of the spillover matrix measure the relative yields of NARSs’ varieties of different environmental origins, and ‘CIMMYT varieties’3 when tested in each of the seven mega-environments. CIMMYT defines mega-environments in terms of areas of similar biotic and abiotic stresses, cropping system requirements, and consumer preferences for types of wheat (Ra-jaram et al., 1993) (Table 2).
CIMMYT’s mandate is to provide improved germplasm to national programs that can be used either as parent materials in crossing program or re-leased after local screening and testing. ‘CIMMYT variety’ as used in this paper is a short for ‘advanced breeding line developed by CIMMYT, and screened, tested and released by national programs.’ Testing and screening of varieties are performed by NARSs. In fact, the national programs in aggregate devote more than CIMMYT to release varieties based on CIMMYT crosses (Maredia and Byerlee, 1996). By contributing both human and financial resources, NARS play an important role in realizing research spill-ins generated by CIMMYT.
It is clear from Table 1 that with the exception of CIMMYT varieties, the highest yields in a given mega-environment are obtained by varieties originat-ing in that mega-environment (i.e. the elements in the off-diagonal elements of the table are nearly always less than 1.00). This is consistent with the hypothesis of location specificity of biological technology. CIM-MYT, because it develops widely adapted materials through multi-locational testing in collaboration with national research systems, produces materials that per-form well in several mega-environments4.
3 Science CIMMYT is located in Mexico (although it is
in-dependent from the Mexican national wheat research program), CIMMYT varieties were grouped into two origin groups those re-leased in Mexico and those rere-leased elsewhere or not rere-leased by any national program.
4 This can be seen by the large positive yield advantages of
Table 1
Estimated spillover matrix for wheat improvement research at the global mega-environment-leveld
Mega-environments where varieties are testeda
Origin of ME1 Irrigated ME2 High ME3 Acidsoils ME4 AWinter ME4B Early ME5A High ME6 High
variety rainfall drought drought temperature latitude
ME1 Irrigated 1.00 0.95 0.84 0.90 0.88 1.02 0.94
ME2 High rainfall 0.95 1.00 0.81 0.92 0.90 0.89 0.96
ME3 Acid soils 0.89 0.96 1.00 0.85 0.90 0.98 1.00
ME4A Winter drought 0.99 0.94 0.78 1.00 0.83 0.91 0.93
ME4B Early drought 0.90 0.97 0.89 0.91 1.00 0.90 0.99
MR5A High temperature 0.88 0.86 0.92 0.82 0.89 1.00 0.92
ME6 High lattitude 0.88 0.89 0.84 0.87 0.91 0.84 1.00
CIM1 CIMMYT/Mexicob 1.11 1.13 0.99 1.01 1.07 1.01 0.98
CIM2 CIMMYT/Otherc 1.05 1.06 0.95 0.97 1.01 1.00 0.97
aYield expressed relative to the yield of cultivars originating in that mega-environment (=1.00). bVarieties derived from CIMMYT crosses and released in Mexico.
cVarieties derived from CIMMYT crosses and not released in Mexico. dSource: Maredia et al.(1995) (Table 2).
Table 2
Classification of mega-environments (Mes) used by the CIMMYT Wheat Program
ME Latitude Moisture Temperature Sownc Breeding Representative
degrees regimea regimeb objectivesd locations/regions
Spring wheat
1e <40 Low rainfall irrigated Temperate A Resistance to lodging, SR and LR Yaqui valley, Mexico; Indus valley,
Pakistan; Gangetic valley, India; Nile valley, Egypt
2 <40 High rainfall Temperate A As ME1+resistance to YR.Septoria
spp.,Fusariumspp. and sprouting
Mediterranean basin; Southern cone; Andean highlands; East African highlands
3 <40 High rainfall Temperate A As ME2+acid soil tolerance Brazil, Andean; Highlands, Central Africa; Himalayas
4A <40 Low rainfall winter dominant
Temperate A Resistance to drought,Septoria
spp. and YR
Aleppo, Syria; Settat, Morocco 4B <40 Low rainfall summer
dominant
Temperate A Resistance to drought,Septoria
spp.,Fusariumspp., LR and SR
Marcos Juarez, Argentina 4C <40 Mostly residual moisture Hot A Resistance to drought Indore, India
5A <40 High rainfall/irrigated, humid
Hot A Resistance to heat,Helminthos pariumspp.,Fusariumspp., and sprouting
Poza Rica, Mexico; Joydebpur, Bangladesh; Encarnacion, Paraguay 5B <40 Irrigated, low humidity Hot A Resistance to heat and SR Gezira, Sudan; Kano, Nigeria 6 >40 Moderate rainfall
summer dominant
Temperate S Resistance to YR, LR,Fusarium
spp.,Helminthosporiumspp. and sprouting
Harbin, China
aRainfall refers to just before and during the crop cycle. High = > 500 mm, low =<500 mm. bHot = mean temperature of the coolest month > 17.5◦C; cold =<5.0◦C.
cA = Autumn; S = Spring.
dFactors additional to yield and industrial quality. SR = stem rust, LR = leaf rust, YR = yellow (stripe) rust.
eFurther subdivided into: (1) optimum growing conditions, (2) presence of Karnal bunt, (3) late planted, and (4) problems of salinity
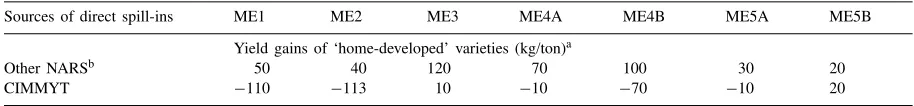
Table 3
Yield gains of ‘home-developed’ NARS varieties in different mega-environments under two scenarios of sources of direct spill-insc
Sources of direct spill-ins ME1 ME2 ME3 ME4A ME4B ME5A ME5B
Yield gains of ‘home-developed’ varieties (kg/ton)a
Other NARSb 50 40 120 70 100 30 20
CIMMYT −110 −113 10 −10 −70 −10 20
aRounded to the closest zero.
bAverage yield advantage of varieties developed by local breeding programs in a test megaenvironment compared to those developed
by NARS in other three closest megaenvironments.
cSource: Table 1.
The results in Table 1 can be viewed under two scenarios with CIMMYT as a potential source of direct spill-ins, and without CIMMYT. Without CIM-MYT as a potential source of direct spill-ins, the average yield advantage of varieties developed by local breeding programs in a test mega-environment compared to those developed by NARS in other three closest mega-environments ranges from 20 kg/tonne to 120 kg/tonne with an overall average of about 60 kg/tonne (Table 3). Certainly with CIMMYT as the potential source of spill-ins, the overarching re-sult of the regression analyses is that NARS cultivars developed for local environments have no or mini-mal advantage over CIMMYT cultivars. Byerlee and Moya (1993), provide empirical evidence on the ori-gin of varieties released in developing countries that supports these results of the spillover analyses. They report that more than 50% of the total wheat varietal releases in developing countries in the 1980s were directly transferred CIMMYT varieties. Moreover, 10 out of 36 countries surveyed by CIMMYT, re-port 100% of all the wheat varieties released in the period 1965–1990 as based on direct transfers from CIMMYT (Maredia, 1993). Even a large wheat pro-ducing country such as Pakistan, reports 80% of all the varieties released in the Punjab region (for nor-mal planting date) in the 1980s as CIMMYT-origin (Byerlee and Moya, 1993).
The largest gain with CIMMYT as a source of spill-ins is 20 kg/tonne, which is considered as a more realistic estimate of the maximum advantage of a local breeding program. However, we recognize that the coverage of environments in the ISWYN data is incomplete and that there are undoubtedly areas where locally developed cultivars give significant yield advantage. Hence, we use the estimated yield advantage under both the scenarios (ranging from
20 kg/tonne to 60 kg/tonne) to estimate the parameter
g1in kg/tonne/year.
4.2. Estimation of model parameters
For the market price of wheat, the long-term trend price was determined based on the average of real import price (C.I.F. Rotterdam) and export price (F.O.B. U.S. gulf) of wheat from 1964 to 19935. The country-specific costs per researcher, Cs, were esti-mated at the official exchange rate (expressed in US$ 1992) using Pardey and Roseboom (1989) data on ex-penditures per researcher 6. In the general analysis,
the cost parameterCs is based on the median cost per
researcher in developing countries estimated at US$ 20,000 (expressed in US$ 1992 at the official ex-change rate) (Bohn et al., 1997). The median number of researchers, Sf, for a wheat testing and adaptive
5 C.I.F. and F.O.B. prices for wheat from 1964 to 1993 were
deflated by the US producer price index to obtain real-price series in 1992 dollars. A long-linear trend was fitted to these price series to obtain the trend equations, which were used to calculate the trend prices for the years 1994–2042 in 1992 dollars.
6 Pardey et al. (1991) express the 1981–1985 estimates in 1980
breeding program was estimated to be 2.0 and 5.0 full-time equivalent (FTE) scientists, respectively, based on a survey of wheat improvement research programs in developing countries (Bohn et al., 1997). Since most wheat varieties are selected after devel-oping advanced lines of F9 or F10 generation (i.e., lines that are selected for 9 or 10 generations consec-utively) and require 2 years for release (seed certifica-tion and produccertifica-tion), a research lag of 12 years for an adaptive breeding program (n2) and an average lag of 5 years for a testing program (3 years for testing and 2 years for release procedures) (n1) was used 7.
It is assumed that the research program releases a new variety every year after the first release. The typ-ical adoption pattern of a single variety (wi) is
as-sumed to follow a logistic growth curve in its adoption phase and a reverse growth curve in its dis-adoption phase (i.e. a bell-shaped curve) (See Appendix A for a detailed illustration). Brennan and Byerlee (1991), estimate that the number of years for a variety to reach peak (95%) adoption compares with the average weighted age of varieties. Based on the data collected in a 1990 survey of wheat varieties released in devel-oping countries (Byerlee and Moya, 1993), the aver-age weighted aver-age of wheat varieties was found to be 11 years. However, according to Brennan and Byerlee (1991) estimates the number of years for a wheat va-riety to reach peak adoption in some of the matured wheat research programs of developing and developed countries is about 5 years.
To test the sensitivity of the results, we use adoption parameters that reflect these two observed adoption patterns (5 and 11 years). Assuming that it takes an equal number of years for a variety to dis-adopt as it
7The costs of the breeding and testing program in the first
breed-ing and testbreed-ing cycle were adjusted usbreed-ing the cost per generation estimates of Brennan (1988). For a breeding program, we assume that generations 1 and 7 (imported lines) are planted in Year 1; that two additional generations are added in Year 2, etc., until all the 10 generations become active in Year 6. Therefore, Year 1 costs for a breeding program are 27% of the cost of the mature program (with all the 10 generations), Year 2 costs are 42%, Year 3 are 63%, Year 4 are 68%, and Year 5 are 77%. Similarly, for a test-ing program, we assume that Generation 7 (from imported lines) are planted in year 1 and one additional generation is planted in Year 2, etc., until Generation 10 materials are planted in Year 4, when a testing program becomes active. The Year 1 costs of test-ing program are 74% of a mature testtest-ing program, Year 2 costs are 87% and Year 3 costs are 94%.
takes to reach peak adoption, in the base model, the life of a variety is estimated to be 10 years (5 years for a single variety to reach peak adoption and 5 years to dis-adopt) (i.e.wi= 0, fori> 11), and the diffusion
(or cumulative adoption) of new varieties is assumed to reach 100% in the 11th year after the first release of a wheat variety (i.e.Tc=n1+ 11). In the alternative
scenario, the life of a variety and the diffusion lag are estimated to be 22 years (11 years for a single variety to reach peak adoption and 11 years to dis-adopt). The discount rate was assumed to be 12% per annum.
The average rate of yield gains of 10 kg/tonne/year (i.e. 1%/year) for an adaptive breeding program (g2)
was based on Byerlee and Moya (1993) estimates of the varietal component of yield gains for the well-watered environment in a number of countries. This estimate for g2 and the estimate of spill-ins
from the previous section are used to estimate the parameterg1as follows:
We assume that in 15 years after the first release of a locally bred variety (i.e. in less than two breeding cy-cles), a local adaptive breeding program will achieve a cumulative yield advantage (from genetic improve-ment) ranging from 60 kg/tonne to 20 kg/tonne, that was observed in the analysis of ISWYN trial data (Table 3). Given the time pattern of research benefits (Fig. 2), it was calculated that in order to achieve a 60 kg/tonne cumulative yield advantage for an adap-tive program that adds 10 kg/tonne every year(after the yearn2), the genetic progress of imported varieties
would be 4.0 kg/tonne/year less than for an adaptive breeding program (or g1= 6.0 kg/tonne/year).
Simi-larly, to achieve a 20 kg/tonne cumulative yield advan-tage, the progress in imported varieties from a testing program would be 1.4 kg/tonne/year less then for an adaptive breeding program (org1= 8.6 kg/tonne/year).
improve-ment research program in the real world. Also, the parameter values estimated in this paper are based on the assumption of certainty as we make no attempt at calculating the probability distributions of parameters or adjust the median values to reflect the probability of occurrence of each parameter.
5. Ex-ante analyses of wheat improvement research programs
5.1. Analysis of general threshold production levels to justify different types of research programs
In order to develop general guidelines and explore their sensitivity to model parameters, we first develop a baseline for an ‘average’ adaptive breeding program in developing countries using median parameter val-ues over countries. For the median parameter valval-ues, the threshold wheat production level for a testing and adaptive breeding program is established by setting the projected NPV = 0 for each type of wheat im-provement program (testing and adaptive). The level of wheat production in the target area of the research pro-gram, at which an adaptive breeding program (which includes testing of foreign varieties) is more profitable than a testing program is established by equating the projected NPVs of testing and adaptive breeding pro-gram.
Under the baseline scenario where only other NARS are the potential sources of spill-ins, the results in-dicate that a testing program for imported varieties (employing 2 FTE scientist) is the most profitable re-search strategy starting from affected production level (i.e. the level of production affected by the adoption of new varieties released by the research program) of 20,000 tonnes. A full adaptive breeding program be-comes more profitable than a testing program only af-ter 100,000 tonnes when the IRR is about 22%. Thus, even though investments in an adaptive breeding pro-gram earn good rates of return (12–22%), an adaptive breeding program is less profitable than a testing pro-gram unless the varieties produced by own research influence at least 100,000 tonne of wheat in the region. If we consider the second scenario with CIMMYT as a potential source of research spill-ins, ceteris paribus, it becomes very difficult to justify a local adaptive breeding program in the mega-environments
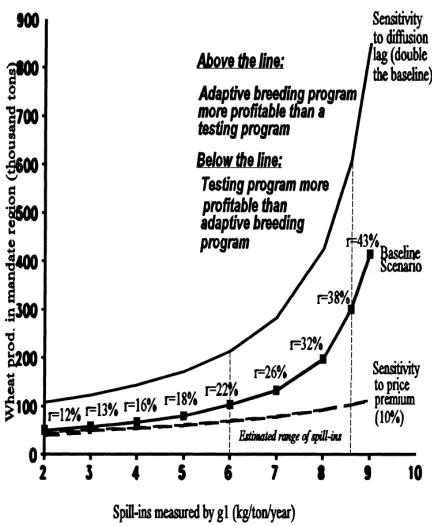
Fig. 3. Sensitivity of implicit IRR and threshold level of wheat production for an adaptive breeding program to different lev-els of research spill-ins (measured by increasingg1 for a given
g2= 10 kg/tonne/year), increased diffusion lag, and a 10% price
premium for locally developed varieties.
of most importance in the developing world, based on yield benefits alone. The smallest observedg1was 8.6 kg/tonne/year which requires an affected produc-tion8 of at least 275,000 tonne and an IRR of 38% to justify investment in an adaptive breeding program. A testing program seems to be the most profitable alternative if CIMMYT is considered as a potential long-run source of direct technology transfer.
The decision on whether to test foreign varieties or develop new varieties from local crosses clearly depends on the level of potential research spill-ins. Fig. 3 shows the sensitivity of increasing direct spill-ins on the IRR and threshold level of wheat pro-duction to make an adaptive breeding program more profitable than a testing program. Research spill-ins in the form of directly transferable technology have a substantial positive effect on the IRR and threshold production level at which breeding is more profitable
8 Affected production is measured here in terms of
than testing. In other words, larger direct spill-ins require an increasingly larger mandate region (and higher IRR) to justify investments in an adaptive breeding program. Viewing this is the light of the results of the spillover analysis in Table 1and esti-mates of yield advantage in Table 3, there are two interesting cases to examine.
First, consider the scenario where NARSs are the only sources of direct spill-ins. In countries which have wheat growing environments similar to ME1 (irrigated, temperate) and ME2 (high rainfall), the average yield advantages of locally developed or ‘home varieties’ imply that research programs in these mega-environments need at least 22% IRR and 100,000 tonnes of wheat production for a local adaptive breeding program to be the most profitable alternative. On the other hand, research programs in the more marginal environments (ME3, ME4A and ME4B) which have experienced the greatest yield advantages of locally developed varieties can justify a local adaptive breeding program at lower IRR if the yield advantage of home varieties are maintained in the future.
The threshold level of wheat production is also sen-sitive to the time pattern of varietal adoption (Fig. 3). Increasing the average wheat varietal age from 5 years in the base model to 11 years observed in develop-ing countries, increased the threshold level of wheat production to justify a testing and adaptive breeding program by hundred percent. The higher weighted age of wheat varieties observed in developing countries reflects the slower rates at which new varieties dif-fuse among farmers. The sensitivity of results to the speed and rate of diffusion of new varieties suggest that careful attention needs to be given to the adop-tion and diffusion patterns of varietal technology in research evaluation. It also reinforces the importance of an effective seed multiplication and marketing sys-tem and the role of extension services in increasing the profitability of breeding research.
The advantage of a local adaptive breeding program is measured above in terms of only one trait yield. However, a local adaptive breeding program may have an advantage in developing better varieties for other traits, especially local consumer tastes. To test the sen-sitivity of results to such quality differences, the price of wheat of locally developed varieties was assumed to be higher than that of varieties from a testing program.
A 10% quality premium of locally developed varieties (within the range of commonly observed quality pre-miums) reduces the threshold levels of the most prof-itable alternative by more than 30%, indicating that the level of production at which an adaptive breeding pro-gram is most profitable is very sensitive to local qual-ity premiums measured in terms of price differences (Fig. 3). Such considerations are likely to be important in crops with location-specific consumer preferences, but are relatively unimportant for wheat where simi-lar consumer preferences prevail across countries for a given wheat type (i.e. bread and durum).
5.2. Analysis of specific wheat improvement programs in developing countries
The cost-benefit framework developed in the pre-vious section is used to project ex-ante the NPV of current levels of investment devoted to wheat improvement research by 69 spring wheat research programs in 35 developing countries. A research program is defined in terms of geographic area for all the wheat types and may include one or more sub-environments in terms of other agrocli-matic factors such as maturity, altitude and moisture regimes.We use program-specific information for the following parameter estimates based on the data col-lected in a 1992 survey of wheat research programs in developing countries (Bohn et al., 1997):Q(affected size of wheat production in the geographic region)9 andSf (number of FTE researchers in the program).
For Cs (cost per researcher in US$ at the official exchange rate) we use country-specific estimates. The adoption parameter,wi, was estimated based on
country-specific information on the average varietal age (Byerlee and Traxler, 1995; Byerlee, 1991). For the other parameters genetic yield gain in an adap-tive breeding program (g2), price (Pt), research lag
(nf) and discount rate (r) we use the average values
from the threshold analysis above. Since g1, which
measures research spill-ins, is the most important parameter in the model, we test the sensitivity of program-specific results at two levels of yield
ad-9 The affected size of wheat production in the mandate region
vantage: g1= 6.0 kg/tonne/year (the average estimate
without CIMMYT as a source of spill-ins) and the more realistic estimate of g1= 8.6 kg/tonne/year (the
maximum with CIMMYT as a source of spill-ins). The results of the ex-ante cost-benefit analysis in Table 4 classifies the 69 research programs into three groups based on the NPV decision criterion. Under the assumption ofg1= 6.0 kg/tonne/year, Group I consists of nine research programs that are projected to earn negative NPV to their current investments in wheat im-provement research. For those adaptive breeding pro-grams earning positive NPV, the NPV of alternative investment in a testing program (assuming that such a research program employs one-third of the current number of FTE researchers) was also projected. Group II consists of 9 programs whose NPV of current in-vestments is less than the alternative investment in a testing program; and, Group III includes 51 research programs earning maximum NPV (compared to the alternative of a testing program).
However, taking into account the empirical evidence of research spill-ins from the international research system, the number of inefficient programs (Group I and II) increased from 18 to 28. In other words, if the potential research spill-ins from the international re-search system are included in the analysis, 28 out of 69 research programs (9 in Group I and 19 in Group II) in developing countries would be overinvesting in wheat improvement research in the projected scenario. It is not surprising that the research programs earning the most profitable returns and for which adaptive breed-ing is efficient (Group III) include the major wheat producing countries (Turkey, India, Pakistan, Brazil and Mexico).
The unprofitable level of investment for research programs in Group I can be explained by the large size of these research programs relative to the small production in their target region. This is reflected in the large number of scientists per million tons of wheat produced (Table 4), suggesting considerable economies of size in wheat breeding. The research programs in Group II, even though earning satisfac-tory rates of return (more than 12%), are inefficient because they are concentrating on adaptive research rather than screening imported varieties.
It should be noted that our estimates of the number of programs that are inefficient is probably conserva-tive. In the first place, we have used a maximum
esti-mate of the benefits that may be achieved from a local adaptive breeding program. The analysis of spillovers suggests that for many environments, the yield advan-tage of locally developed varieties relative to imported varieties is negligible or even negative. Second, we have assumed that varieties from a given program will diffuse to the entire mandate area (adjusted by the ceil-ing adoption), despite the fact that such diffusion in practice is incomplete because there are other breed-ing programs in the same mandate region. Third, the average C.I.F. and F.O.B. price of wheat that we have used overestimates the market clearing price in large countries close to self-sufficiency. We feel that these factors will generally outweigh other potential bene-fits of a local adaptive breeding program that we have not considered in the analysis including quality pre-miums for varieties developed for local tastes (not im-portant in the case of wheat), and risk considerations the uncertainty of the continuing supply of spill-ins and possible exposure to greater genetic uniformity if all neighboring countries plant varieties from the same spill-in source.
6. Conclusions and implications
The results of this study have important implica-tions at both the conceptual level in methods used for research evaluation, and for policy decisions on in-vestment in wheat improvement research in develop-ing countries. At the conceptual level, spillovers and spill-ins in crop research have usually been assumed to be indirect in nature (i.e. exchange of germplasm for parent materials, and exchange of breeding meth-ods and scientific information). The externalities cre-ated by research are, therefore, modeled to affect only the research production function of other research pro-grams. The theoretical argument for underinvestment in agricultural research is based on this basic premise (Ruttan, 1982). However, as shown by this study, re-search spill-ins will not only affect rere-search produc-tivity but direct spill-ins will also affect the choice of the research strategy. The study, therefore, under-lines the importance of incorporating estimates of di-rect spill-ins (or the potential for didi-rect spill-ins) in economic evaluation of research programs.
evaluation. In principle, research resources should be allocated to every product or sector in which the ex-pected present value of research is positive, given the appropriate discount rate. Ex-post rate-of-return stud-ies evaluate research investments as free-standing re-search projects based on this principle. Evidence of rate of returns greater than the opportunity cost of cap-ital is interpreted to imply that investments in research should be increased to drive down the rate of return. However, this study has shown that high rates of return do not necessarily imply that resources are being used efficiently if investment in an alternative research strat-egy is more profitable. Resource allocation is decisions must be viewed in terms of Evenson–Binswanger’s re-search option framework and based on the opportunity cost of using scarce research resources.
This study by directly quantifying spill-ins and in-corporating these into a cost-benefit framework, has provided some generic guidelines for increasing the efficiency of investments in public sector wheat re-search programs in developing countries. The striking result of this analysis is that many countries or regions within a country are investing more than the justifiable levels of expenditure on wheat improvement research. This finding suggests considerable efficiency gains at the margin through shifting research strategies, espe-cially for wheat research programs with a small target area.
This finding of ‘overinvestment’ in wheat improve-ment research is based on the fact that many wheat im-provement programs in developing countries are plac-ing too much emphasis on adaptive and comprehen-sive research and too little attention to importing and testing improved varieties from the global research system. This has resulted in duplication of research effort and inflated the size of many wheat research programs in developing countries. ‘Overinvestment’ in wheat breeding occurs for several reasons. These in-clude the prestige associated with plant breeding ver-sus other type of research, national pride in having an independent breeding program, incentive system that rewards plant breeders who develop ‘new varieties’ from crossing program, lack of economic analysis of alternatives, and emulation of the international system. All these factors add up to misallocation and overin-vestment in crop breeding research.
The findings of this paper are not inconsistent with the finding that, overall, wheat research in
develop-ing countries has been highly successful, continuously releasing superior wheat varieties that farmers adopt, and generating a high rate of return on the research in-vestment (Byerlee and Traxler, 1995). This study has shown that the research programs projected to earn the highest returns are located in large wheat produc-ing countries (Argentina, Brazil, China, India, Pak-istan and Turkey), suggesting considerable economies of size in wheat improvement research.
This study also challenges the widely held view that biological technology in agriculture is highly location specific. We found that although there is considerable environmental diversity across countries, these envi-ronments can be aggregated into a few relatively ho-mogeneous environments, or mega-environments, for the purpose of organizing wheat breeding research. In addition, an international wheat research program, such as the CIMMYT program, appears to be cost ef-fective in generating finished technologies for several mega-environments. This is reflected in the analysis of relative yields of varieties of different origins, as well as the fact that about half of the wheat varieties re-leased in developing countries originated in CIMMYT (Byerlee and Moya, 1993). Therefore, direct transfer of wheat varieties from other sources can be a pottial substitute for local adaptive research in many en-vironments and this should be considered in designing national and regional wheat improvement programs. Of course, direct transfer requires local research ca-pacity in order to screen and test materials (Evenson and Binswanger, 1978). In the global climate of scarce research resources, it may be more efficient to import technologies that are robust (such as wheat varieties) and devote scarce local resources to research and en-vironments that require more site-specific technolo-gies, such as crop and natural resource management research.
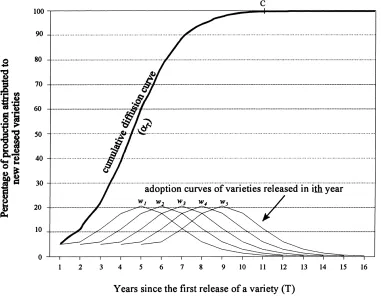
Fig. 4. Modeling the adoption and cumulative diffusion of new wheat varieties released by a reach program.
Acknowledgements
The authors wish to thank Paul Heisey, Gregory Traxler, John Brennan, Carl Eicher, Tony Fischer and anonymous reviewers for valuable comments on pre-vious drafts of this paper. However, full responsibility for errors and ommissions remain with the authors.
Appendix A. Modeling the adoption and diffusion of new varieties
We assume that a research program releases im-proved varieties every year (T= 1,. . .,i,. . .N), with a yield gain of (gf ×i). The cumulative diffusion of
these varieties is represented byαT, which follows a
logistic curve beginning with a 5% diffusion in Year 1 and reaching 100% by Year 11 (i.e.Tc= 11) (Fig. 4).
However, it is unlikely that a variety released in the
ith year with a yield gain of (gf×i) is instantaneously
adopted over the whole diffused region ofαT.
Vari-eties released each year are assumed to follow a life-time adoption pattern ofwi as depicted in Fig. 4. A
variety released in ith year is adopted in 5% of the production region in Year 1 (i.e.wi1=0.05), 11% in the second year (w2i =0.11), reaching a peak adop-tion level of 21% in the 5th year (wi5 = 0.21), and disadopted thereafter until it is no more planted in the 12th year after its release.
As depicted in Fig. 4, in any given yearT, αT is
composed of varieties released in that and preceding years (wTi ). Hence attributing increased yield gains of (gf×i) to all the production under improved varieties
in the mandate region would overestimate the realized production gains due to research. The annual shift in production attributed to research,Kf T, is, therefore,
Kf T =
The model discussed in this paper is based on the def-inition ofKf T as defined in Eq. (A.1), which analyzes
varietal replacement on a continual basis (i.e. αT is
composed of varieties released in the pastTyears, with new varieties with higher yield gains released each year and replacing older ones). This kind of adoption model now characterizes most wheat growing regions.
References
Binswanger, H.P., 1974. Borrowing technology, adaptive research and research on home technology. Pakistan Econ. Soc. Rev. 12, 144–156.
Bohn, A., Byerlee, D., Maredia, M.K., 1997. Investment in wheat improvement in developing countries. In: Maredia, M.K., Byerlee Derek (Eds.), CIMMYT Research Report (forthcoming). CIMMYT, Mexico, DF.
Brennan, J.P., 1988. An Economic Investigation of Wheat Breeding Programs. Agricultural Economics Bulletin No. 35. University of New England, Armidale, NSW, Australia.
Brennan, J.P., Byerlee, D., 1991. The rate of crop varietal replacement on farms: Measures and empirical results for wheat. Plants, Varieties and Seeds 4, 99–106.
Byerlee, D., Moya, P., 1993. Impacts of International Wheat Breeding Research in the Developing World, 1966–1990. CIMMYT, Mexico, DF.
Byerlee, D., Traxler, G., 1995. National and international wheat improvement research in the post-green revolution period: Evolution and impacts. Am. J. Agric. Econ. 77, 268–278. Dalrymple, D.D., 1986. Development and Spread of High
Yielding Wheat Varieties in Developing Countries. United States Department of Agriculture, Agency for International Development, Washington, DC.
Davis, J.S., 1994. Spillover effects of agricultural research: importance for research policy and incorporation in research evaluation models. In: Anderson, J.R. (Ed.), Agricultural Technology: Policy Issues for the International Community. CAB International, Wallingford, UK.
Englander, A.S., 1991. International technology transfer and agricultural productivity. In: Evenson, R.E., Pray, C.E. (Eds.), Research and Productivity in Asian Agriculture. Cornell University Press, Ithaca, NY.
Evenson, R.E., 1994. Analyzing the transfer of agricultural technology. In: Anderson, J.R. (Ed.), Agricultural Technology: Policy Issues for the International Community. CAB International, Wallingford, UK.
Evenson, R.E., Binswanger, H.P., 1978. Technology transfer and research resource allocation. In: Binswanger, H.P., Ruttan, V.W., others (Eds.), Induced Innovation: Technology, Institutions and Development. Johns Hopkins University Press, Baltimore. Evenson, R.E., da Cruz, E.R., 1992. Economic impacts of the
procisur programme: an international study. In: Bellamy, M., Greenshields, B. (Eds.), Issues in Agricultural Development: Sustainability and Cooperation. IAAE Occasional Paper No. 6. International Association of Agricultural Economists. Evenson, R.E., Kislev, Y., 1975. Agricultural Research and
Productivity. Yale University Press, New Haven.
Gittinger, J.P., 1982. Economic Analysis of Agricultural Projects. The Johns Hopkins Press, Baltimore.
Hardin, L.S., Collins, N.R., 1974. International agricultural research: Organizing themes and issues. Agric. Admin. 1, 13– 22.
Jarrett, F.G., 1982. Location specificity, critical mass and the allocation of resources to agricultural research. Agric. Admin. 11, 49–65.
Maredia, M.K., 1993. The economics of the international transfer of wheat varieties, unpubl. dissertation. Michigan State University, East Lansing.
Maredia, M.K., Ward, R., Byerlee, D., 1996. Econometric estimation of a global spillover matrix for wheat varietal technology. Agric. Econ. 14, 159–173.
Maredia, M.K., Byerlee, D., 1996. Efficiency of Wheat Improvement Research: A Comparative Analysis of National and International Research Systems in Developing Countries Contributed paper presented at the International Conference on Global Agricultural Science Policy for the Twenty-first Century Melbourne, Australia 26–28, 1996
Pardey, P.G., Roseboom, J., 1989. ISNAR Agricultural Research Indicators Series: A Global Data Base on National Agricultural Research System. Cambridge University Press, Cambridge. Pardey, P.G., Roseboom, J., Anderson, J.R. (Eds.), 1991.
Agricultural Research Policy: International Quantitative Perspectives. Cambridge University Press, Cambridge. Rajaram, S.M., van Ginkel, M., Fischer, R.A., 1993. CIMMYT’s
wheat breeding mega-environments (MEs). In: Proceedings of the International Wheat Genetics Symposium, Beijing, China, July 20–25, 1993.