CAPACITY BUILDING FOR COLLECTING PRIMARY DATA THROUGH
CROWDSOURCING – AN EXAMPLE OF DISASTER AFFECTED UTTARAKHAND
STATE (INDIA)
YVN Krishna Murthya, PLN Rajua, SK Srivastava, Pramod Kumara, D Mitraa, Harish Karnataka, Sameer Sarana, Kamal Pandeya, Kapil Oberaia, K
Shiva Reddya, Kshama Guptaa, Mahadev Swamya and Anirudh Deshmukha
VK Dadhwalb, Vinod Bothaleb, PG Diwakarb, MV Ravikumarb, A. Leiselyb, M Arulrajb and Sharat Kumarb
SS Raoc, Ravindra Singh Rawatc, DN Pathakc, Virendra Duttc, Deepak Negic, Jagdeep Singhc, KK Shuklac, Ajay Tomarc and Nadeemc
Bhoop Singhd, AK Singhd and R Shiva Kumard
a Indian Institute of Remote Sensing, Indian Space Research Organization, Department of Space, Govt. of India, Dehradun ([email protected]) b National Remote Sensing Centre, Indian Space Research Organization, Department of Space, Govt. of India, Hyderabad
CSurvey of India,Dehardun
d Department of Science and Technology, Government of India, New Delhi
Commission VI, WG VI/2
KEY WORDS: Crowdsourcing, Capacity Building, Disaster Management, MANU, Mobile Application, Uttarakhand
ABSTRACT:
Uttarakhand State of India suffered a widespread devastation in June 2013 due to floods caused by excessive rain in the upper reaches of the Himalaya, glacial lake outburst flood (GLOF) and landslides. Restoration process in this mountainous State calls for scientifically sound planning so that the vulnerabilities and risks to such natural hazards are minimised and developmental processes are sustainable in long run. Towards this, an understanding of the patterns and major controls of damage of the recent disaster is a key requirement which can be achieved only if the primary data on locations and types of damage along with other local site conditions are available. Considering widespread damage, tough nature of terrain and the need for collecting the primary data on damage in shortest possible time, crowdsourcing approach was considered to be the most viable solution. Accordingly, a multi-institutional initiative called 'Map the Neighbourhood in Uttarakhand' (MANU) was conceptualised with the main objective of collecting primary data on damage through participation of local people (mainly students) using state-of-art tools and technologies of data collection and a mechanism to integrate the same with Bhuvan geo-portal (www.bhuvan.nrsc.gov.in) in near real-time. Geospatial analysis of crowd-sourced points with different themes has been carried out subsequently for providing inputs to restoration planning and for future developmental activities. The present paper highlights the capacity building aspect in enabling the data collection process using crowdsourcing technology.
1. INTRODUCTION
Application of technology for the management of natural disaster has been in practice since decades. Technology has penetrated very well in the mitigation process of natural disaster management. Information and Communication Technology (ICT) plays an important role in the mitigation process. Uttarakhand state of India is dominated by the hilly terrain and is prone to natural disaster like landslides, flash floods, earthquakes etc. The terrain is undulating and has difficult approachability, hence ICT technology become vital during any kind of disaster management process. This state of India suffered a widespread devastation in June 2013 due to floods caused by excessive rain in the upper reaches of the Himalaya, glacial lake outburst flood (GLOF) and landslides. Restoration process, i.e. reconstruction and rehabilitation, in this mountainous State calls for scientifically sound planning so that the vulnerabilities and risks to such natural hazards are minimised and developmental processes are sustainable in long run. Towards this, an understanding of the patterns and major controls of damage of the recent disaster is a key requirement which can be achieved only if the primary data on locations and types of damage along with other local site conditions are available.
Considering widespread damage and tough nature of terrain, of which higher reaches remain inaccessible in winter months due to snow cover, and the need for collecting the primary field data
in shortest possible time, crowdsourcing approach was considered to be the most viable solution. Accordingly, a multi-institutional initiative called 'Map the Neighbourhood in Uttarakhand' (MANU) was conceptualised in August, 2013 with the main objective of collecting primary data on damage through participation of local people (mainly students, guided by scientists of local institutions) using state-of-art tools and technologies of data collection and a mechanism to integrate the
collected data with Bhuvan geo-portal
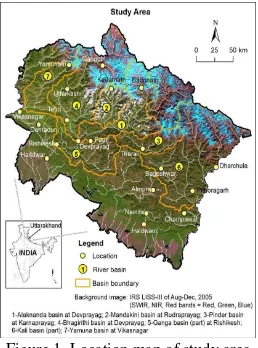
(www.bhuvan.nrsc.gov.in) in near real-time. The study area involves the seven river valleys of Uttarakhand: Alaknanda, Mandakini, Bhagirathi, Yamuna, Ganga (part, downstream of Devprayag), Pinder and Kali valleys (Figure 1).
The International Archives of the Photogrammetry, Remote Sensing and Spatial Information Sciences, Volume XL-8, 2014 ISPRS Technical Commission VIII Symposium, 09 – 12 December 2014, Hyderabad, India
This contribution has been peer-reviewed.
Figure 1. Location map of study area
The field data collection teams were led by three institutions: (i) HNB Garhwal University in Alaknanda and Mandakini river valleys; (ii) Kumaun University in Pinder and Kali river valleys; and (iii) Wadia Institute of Himalayan Geology in Bhagirathi and Yamuna river valleys.This paper highlights the capacity building aspect in enabling the data collection process. It also summarises the MANU data that could form a critical input and resource for not only restoration planning in disaster affected areas but also in undertaking developmental activities for rehabilitation.
2. CROWDSOURCING APPROACH FOR NEAR REAL-TIME DATA COLLECTION
2.1 An overview
Data collection through masses by the means of ICT technology is one of the wide-spread phenomenon (Howe,2006). Georgios et al., 2012 defines crowdsourcing as “a distributed problem-solving model in which a crowd of undefined size is engaged to solve a complex problem through an open call”. Participatory GIS (PGIS) is another term that compliments crowdsourcing technology in geospatial domain. PGIS “draws on the diversity of experiences associated with participatory development and involves communities in the production of GIS data and spatial decision-making” (Abbot et al.,1998).The most popular example of crowd sourced data collection is Wikipedia (“Wikipedia, the free encyclopedia,” n.d.) which is one of earliest and best known effort of crowd-sourced data, it is a clear cut demonstration of what can be achieved with a crowd-based data sourcing model. Apart from it there are ample examples where strength of crowd sourced data are highlighted e.g. geotagging systems for images, which harness millions of Web users to build searchable databases of tagged images; traffic information aggregators like Waze (“Free Community-based Mapping, Traffic & Navigation App,” n.d.) ; and hotel & movie ratings like TripAdvisor (“Hotels, Travel and Holiday Reviews - TripAdvisor,” n.d.) and IMDb (“IMDb - Movies, TV and Celebrities,” n.d.). Crowdsourcing has proven to be an efficient approach to quickly generate huge amounts of near real-time data on a given situation (Okolloh, 2009; Zook, 2010). Presently smart phones have become an efficient tool for the collection of crowed sourced data. A smart phone consists of feature like GPS, digital camera and GPRS connectivity which are necessary for the field data collection and communicating directly to the central server. The information collected in such a mode can be real or near real time in nature, thus can be very useful for immediate decision making and action implementation.
2.2 Role of crowdsourcing in disaster management
Since the data and information required during disaster time is huge and is required in shortest possible time crowdsourcing becomes a natural candidate for data collection. Jens et al., 2011 have used the concept of crowdsourcing to prove that Linked Open Data can ease the challenges of information triage in disaster response efforts; linked open data refer to the process of integrating the unstructured data gathered during the disaster from different sources. The concept of crowdsourcing becomes vital at the time of disaster mitigation. During the process of mitigation, an analysis of the amount of damage occurred during the disaster is performed. Assessment of the damage can be easily performed using the crowdsourcing techniques. The classic example is that of Haiti earthquake crisis that occurred during 2010, wherein disaster data were collected by volunteers (Heinzelman and Waters, 2010).
However, capacity building is a vital element for ensuring reliable data collection through crowdsourcing.
3. SYSTEM ARCHITECTURE
3.1 Application Development
A modular approach was followed for the development of the mobile application for current study. An android based application was developed for the data collection. Figure 2 shows the architecture of the mobile application (MANU-App). The application can be installed in any Android smart phone having the feature like GPS, camera, GPRS and memory storage either inbuilt or SD card based. The MANU-App has the feature for either immediate pushing the data collected from the field to the Bhuvan portal or to store the collected data in mobile local storage and send it later in case of connectivity issue (offline mode).
Figure 2. Architecture of the Mobile App developed for post disaster data collection
3.2 Structure of the field data collection proforma
Different types of field data collection proforma were generated and subsequently built in the mobile app used for the data collection. The following five categories of the proformas were created:
• Damage to buildings and infrastructure 1a. Damage to Buildings
1b. Damage to Infrastructure 1b1. Roads
The International Archives of the Photogrammetry, Remote Sensing and Spatial Information Sciences, Volume XL-8, 2014 ISPRS Technical Commission VIII Symposium, 09 – 12 December 2014, Hyderabad, India
This contribution has been peer-reviewed.
1b2. Bridges and Culverts 1b3. Other Infrastructure
• Landslides
• River Bank Erosion
• Damage to Land-cover and Natural Resources • Points of Interest
The data collected based on these proforma included location of the damaged feature, size or extent, neighbouring feature probable cause of damage, date of observation, observer’s name etc.
3.3 Capacity Building
A systematic approach was followed for the capacity building of the complete disaster damage assessment. Capacity building of local people, mainly postgraduate students, has been carried out by organising two training courses, each of three days duration. The first programme was attended by participants from KU and WIHG, while the second programme was mainly attended by the participants from HNBGU and a few participants from WIHG. A total of 149 participants (130 students and 19 faculty/scientists) participated in the two training programmes (Table 1).
HNB Garhwal University 65
Students 58
Faculty 7
Kumaun University 35
Students 30
Faculty 5
Wadia Institute of Himalayan Geology 49 Students 42
Faculty 7
Total 149 Table 1. Participation of HNBGU, KU and WIHG in training
programmes
The participants were trained on all the aspects of the post-disaster data collection methods. They were taken to a prototype field area and were trained on various kinds of damages that can occur during a natural disaster (Figure 3.). Extensive hands-on training was conducted on mobile app using smart phone.
Figure 3. In-Field training for post disaster data collection.
Apart from it they were also trained on theoretical aspect of the natural disaster management using remote sensing and GIS techniques. The topics covered during this session are listed in Table 2. The topics were divided into 3 days so that the participants get clear understanding of the process.
Day-1
1 Satellite image analysis for identifying elements at risk and damage assessment
2 Concepts of GNSS and overview of field instruments 3 Demonstration on map reading for disaster damage
assessment
4 Hands-on with maps, GNSS (GPS) receiver, GAGAN SBAS receiver, mobile device and other field instruments Day-2
5 Bhuvan applications for MANU
6 Familiarization on mobile appl. and visualization of field data on Bhuvan geoportal
7 Hands-on with Bhuvan geo-portal
8 Field data collection procedures and familiarization on field instruments
Day-3
9 Field visit for data collection using mobile device and other instruments
10 Visualization of collected field data on Bhuvan geoportal 11 Feedback and Closing
Table 2. Topic covered for capacity building for the participants
4. RESULTS AND DISCUSSION
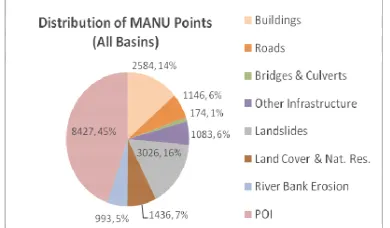
The field data collection started within a week after completion of training courses. Field parties have collected data at 18,869 points in above mentioned five river basins. These 18,869 points comprise of 10,442 points (55%) on damages to different types of structures and land-cover/natural resources, landslides and river bank erosion (Figure 4). The remaining points (8,427, 45% of total points) are the points of interest (POIs). Landslides and damage to building points together constitute about 30%, followed by damage to land cover & natural resources (7%), damage to roads and other infrastructure (6% each), river bank erosion (5%) and damage to bridges & culverts (1%). The damage related points are 6423 in number, constituting about 62% of non-Bhuvan POI points.
Figure 4. A graphical representation of theme-wise distribution of MANU points for the study area.
The data collected were visualised over ISRO Bhuvan Portal for spatial visualisation of the extent of damage. The portal allows the user to select the theme(s), date(s) of data acquisition for visualization with high resolution satellite image as base map (Figure 5).
The International Archives of the Photogrammetry, Remote Sensing and Spatial Information Sciences, Volume XL-8, 2014 ISPRS Technical Commission VIII Symposium, 09 – 12 December 2014, Hyderabad, India
This contribution has been peer-reviewed.
Figure 5. Landslide points along with associated data displayed over ISRO Bhuvan web portal
The data also contained the field photographs of the damaged feature which get displayed once the user clicks at a particular point. A visual appreciation of the extent of damage was done with the help of pre and post-satellite images along with the field photographs obtained as crowd-sourced data (Figure 6).
Figure 6. Visual appreciation of the damage occurred with the help of satellite image and field photos.
For delineating disaster affected zones and understanding pattern of damage, hot spots of damage were identified based on density/cluster analysis of MANU points in GIS domain. Further, geospatial analysis of MANU points and different thematic layers, viz. proximity to drainage, slope, geology and geomorphology, landslides, and river bank erosion, were also carried out. The findings of these analyses are useful for providing inputs towards formulating guidelines for restoration and developmental activities.
5. CONCLUSION
This paper clearly highlights the advantages of using crowdsourcing approach for quick and reliable field data collection, which are vital for restoration planning in post-disaster stage. An Android-based application (MANU-App) has been developed for collecting data on various types of damage through simple, custom-designed forms. The data collected could be visualized in near real-time using ISRO Bhuvan portal. The study essentially demonstrates the importance of capacity building in quick and reliable data collection using crowdsourcing approach. A total of about 19,000 points in seven disaster-affected river valleys were collected by the
trained participants. The collected data were analysed in GIS for understanding the patterns and major controls of damage. Such an approach can be used for a variety of other disaster related applications.
ACKNOWLEDGEMENTS
Authors duly acknowledge the support and constant encouragement of Secretary, Department of Science & Technology and Chairman ISRO/ Secretary, Department of Space, Govt. of India. The authors also thank the Heads and PIs of Partner Institutions (HNB Garhwal University, Kumaun University and Wadia Institute of Himalayan Geology). We also thank Prof. Talat Ahmed, Vice Chancellor, Jamia Milia Islamia University for his fruitful suggestions and encouragement.
REFERENCES
Abbot, J., Chambers, R., Dunn, C., Harris, T., Merode, E. D., Porter, G., Townsend, J. & Weiner, D. (1998). Participatory GIS: opportunity or oxymoron?. PLA Notes-International Institute for Environment and Development (United Kingdom).
Chatzimilioudis, G., Konstantinidis, A., Laoudias, C., Zeinalipour-Yazti, D., 2012. Crowdsourcing with Smartphones. IEEE Internet Computing 16, 36–44. doi:10.1109/MIC.2012.70
Free Community-based Mapping, Traffic & Navigation App, https://www.waze.com/ (accessed 11.17.14).
Hotels, Travel and Holiday Reviews - TripAdvisor [WWW Document], n.d. URL http://www.tripadvisor.in/ (accessed 11.17.14).
Heinzelman, J., & Waters, C. (2010). Crowdsourcing crisis information in disaster-affected Haiti. US Institute of Peace.
Howe, J., 2006. The rise of crowdsourcing. Wired
Magazine -Issue 14.06.
IMDb - Movies, TV and Celebrities [WWW Document], n.d. . IMDb. URL http://www.imdb.com/ (accessed 11.17.14).
Okolloh, O., 2009. Ushahidi, or ’testimony’: Web 2.0
tools for crowdsourcing crisis information. Participatory
Learning and Action 59(1), 65–70.
Ortmann, J., Limbu, M., Wang, D., Kauppinen, T., 2011. Crowdsourcing linked open data for disaster management. Terra Cognita 11–22.
Wikipedia, the free encyclopedia [WWW Document],
n.d. URL http://en.wikipedia.org/wiki/Main_Page
(accessed 11.17.14).
Zook, M., Graham, M., Shelton, T., Gorman, S., 2010. Volunteered geographic information and crowdsourcing disaster relief: a case study of the Haitian earthquake. World Medical & Health Policy 2(2), 2.
The International Archives of the Photogrammetry, Remote Sensing and Spatial Information Sciences, Volume XL-8, 2014 ISPRS Technical Commission VIII Symposium, 09 – 12 December 2014, Hyderabad, India
This contribution has been peer-reviewed.