Midline Brain Structural Shape following a First
Episode of Schizophrenia
Waleed S. Gharaibeh, F. James Rohlf, Dennis E. Slice, and Lynn E. DeLisi
Background: Previous reports indicate that brain
struc-tural abnormalities may be progressive in some patients with schizophrenia. Our study was designed to determine deviations in the shape of midline brain structures at the time of onset of symptoms of schizophrenia and 3–5 years later.
Methods: Eleven landmarks were located on the
midsag-ittal magnetic resonance imagery brain scans of 55 patients with schizophrenia and 22 nonpsychiatric control individuals. Geometric morphometric methods were used for the extraction of shape variables from landmark coordinates. Permutation tests were used to test the effects of gender, diagnosis, time elapsed since illness onset, and age on brain shape.
Results: The diagnosis-by-time interaction and the effect
of gender were significantly different from zero (p,.027 and p , .039, respectively). The effect of time was significant in patients (p , .002), but not in control subjects. Some anatomical abnormalities in mean patient brain morphology seem to be present both at the time of diagnosis and at follow-up. These are similar to anomalies reported by previous geometric morphometrics studies.
Conclusions: Some previously identified brain
abnormal-ities are detectable at the time of first hospitalization. The rapid change in midline brain morphology in patients with schizophrenia during the subsequent 3–5 years is consis-tent with either a neurodegenerative disease process or an effect of treatment with psychiatric drugs. There is a sexual dimorphism in brain morphology that might be reduced by schizophrenia. Biol Psychiatry 2000;48:
398 – 405 © 2000 Society of Biological Psychiatry
Key Words: First-episode schizophrenia, MRI, brain morphology, corpus callosum, Procrustes, thin-plate spline
Introduction
O
ver the past 25 years, neuroimaging studies have associated schizophrenia with a number of anatomic brain abnormalities with varying degrees of reproducibil-ity (for a review, see Pearlson and Marsh 1999); however, only a few have investigated the timing of emergence of these neuroanatomic abnormalities (for a review, see DeLisi 1999). Establishing the temporal progress of pa-thology can be of value in testing competing hypotheses for the etiology of schizophrenia. A model in which the clinical manifestation of the disease is the result of a much earlier fixed derailment of normal brain development (Weinberger 1987) would predict a different temporal profile for structural anomalies than a model of schizo-phrenia as a continuing active neurodegenerative process (DeLisi 1999; Lieberman 1999). Identifying the most accurate disease model has implications for early detection and treatment. The corpus callosum, in particular, could be a focus of the progressive brain change in schizophrenia since it is known to increase in size during normal adulthood in a process that might involve changes in the number and size of fibers connecting the cerebral hemispheres.Most studies of the neuroanatomy of schizophrenia have quantified volumes, areas, or linear dimensions of different brain structures from computed tomography or magnetic resonance imaging (MRI) images. Recently, a number of studies have employed landmark-based ap-proaches to address some of the same questions (e.g., Bookstein 1995, 1997; DeQuardo et al 1996, 1999). The methods are based on the rapidly developing field of geometric morphometrics and have the advantage of allowing a geometrically correct partitioning of size and shape information and preserving all of that information for use in statistical tests and graphical representation. An overview of the theory of geometric morphometrics, its merits as a tool for shape analysis, and examples of application are discussed in Marcus et al (1996) and Rohlf (1999). Bookstein (1998) is an introduction to
From the Departments of Ecology and Evolution (WSG, FJR, DES) and Psychiatry (LED), SUNY, Stony Brook, New York.
Address reprint requests to F. James Rohlf, SUNY, Department of Ecology and Evolution, Stony Brook NY 11794-5245.
Received January 27, 2000; revised April 20, 2000; accepted May 2, 2000.
geometric morphometrics specifically aimed at biolog-ical psychiatrists.
The purpose of our study was to use these techniques to examine changes in brain structural shape in schizophre-nia, a disease that has only subtle morphological changes over time. A configuration of landmarks was identified in brain MRI midsagittal sections of patients and control subjects participating in a longitudinal study of first-episode schizophrenia. These landmarks were chosen so as to span regions of the brain where schizophrenia-associ-ated structural abnormalities have been identified by previous studies, namely, the corpus callosum, the dien-cephalon, the superior aspects of the brainstem and the cerebellum, and the frontal cortex. In particular, the chosen landmark configuration overlaps with those of previous geometric morphometric studies (Bookstein 1995; DeQuardo et al 1996) so as to allow testing their findings.
Given the well-established change in normal brain anatomy with age and the growing literature on sexual dimorphism in normal and schizophrenic brain anatomies (Pearlson and Marsh 1999), the possible effects of gender and age and their interactions with diagnosis and time elapsed since diagnosis were also examined.
Methods and Materials
Subjects
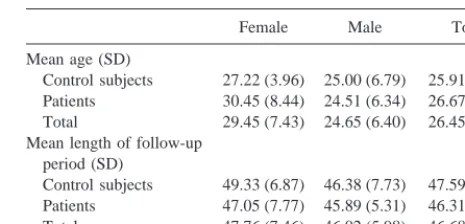
Fifty-five patients (35 male and 20 female) and 22 control subjects (13 male and 9 female) were examined. Details of the recruitment and diagnostic procedures have previously been described (DeLisi et al 1997). Patients were recruited from 1988 through 1994 when they presented to Suffolk County in-patient facilities (Kings Park Psychiatric Hospital or University Hospi-tal, SUNY, Stony Brook, New York) with a first episode of nonaffective acute psychosis. All consecutive admissions who gave informed consent for participation in our studies were included. Control subjects were obtained from the surrounding community by recruiting individuals who presented to other out-patient facilities at University Hospital, Stony Brook for nonpsychiatric disorders. Control subjects in the same age range and social class as concurrently recruited patients were inter-viewed using a structured psychiatric interview format (SADS-L, revised; Spitzer and Endicott 1978). The mean and standard deviation of age of subjects at time of initial scan are given in Table 1. Control subjects with a major psychiatric diagnosis, physical illness, chronically medicated, or having any substance abuse were eliminated from study. All subjects gave informed consent for participation in this study.
Thirty-four of the patients were diagnosed with DSM-III-R schizophreniform disorder, 7 with schizophrenia, subchronic, 9 schizoaffective disorder, 3 chronic schizophrenia, and 2 psycho-sis (not otherwise specified) at the time of first hospitalization. At the follow-up time, 5 of these patients were recovered, 33 were diagnosed with DSM-III-R chronic schizophrenia, 10 with
schizoaffective disorder, 2 with bipolar disorder, 2 with recurrent major depression, 1 with schizophrenia-spectrum personality disorders and 2 with psychosis (not otherwise specified). Statis-tical analyses were performed using, first, the complete sample of 55 psychiatric patients as the syndromal group and then limiting it to the subset of 43 patients (30 male and 13 female) who were diagnosed with either chronic schizophrenia or schizo-affective disorder at the follow-up time. All patients were treated with conventional neuroleptic medication for at least a portion of the follow-up period. Some patients were also treated with antidepressants, and some with lithium.
Magnetic Resonance Imaging Scan Procedures
For each subject, two MRI scans were acquired using identical protocols on the same scanner. T-1 weighted sagittal sequences were obtained through the whole brain with a Signa scanner and 1.5 Tesla magnet (5-mm slice thickness with 2-mm gap; matrix, 2563256; field of view, 24; repetition time, 66; echo time, 25; number of excitations, 2). Scans were taken at the time of first admission (for patients) and at a follow-up evaluation ranging from 33 to 64 months later. The mean and standard deviation of the follow-up period length are indicated in Table 1. The slices closest to true midsagittal were extracted from these scans (guided mostly by the clarity of the colliculus and the corpus callosum) and selected for analysis by an observer familiar with brain anatomy but blind to the classification of each subject.
Landmark Configuration and Shape Analysis
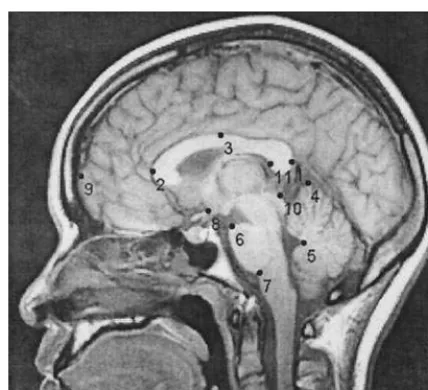
An 11-landmark configuration was used to characterize the brain morphology in midsagittal MRI images (Figure 1). This config-uration largely followed the 13-landmark scheme of DeQuardo et al (1996) except in that three landmarks—the vertex, tentorium at dura, and bottom of cerebellum—were eliminated for being difficult to identify and/or sensitive to imaging artifacts. The procedures for localizing some of the landmarks were modified from DeQuardo et al (1996) and one landmark, on the inside of the splenium, was added (landmark 11). The inside of the splenium had been associated with the most significant shape aberration in patients with schizophrenia found by Bookstein (1995). Landmarks 1 and 9 were located by extending a straight line that passed through landmarks 2 and 11 to the outside of the Table 1. Means and Standard Deviations of Age at Initial Scan (in Years) and the Length of Follow-Up Period (in Months)
Female Male Total
Mean age (SD)
Control subjects 27.22 (3.96) 25.00 (6.79) 25.91 (5.80) Patients 30.45 (8.44) 24.51 (6.34) 26.67 (7.66) Total 29.45 (7.43) 24.65 (6.40) 26.45 (7.15) Mean length of follow-up
period (SD)
splenium and to the surface of the frontal cortex, respectively. Landmark 3 was located at the upper edge of the corpus callosum exactly midway between landmarks 1 and 2. The positions of these and the remaining landmarks can be identified from a number of figures in this article.
Prior to digitization, the MRI image files were coded and their order permuted to keep the analyst blind to age, gender, diagno-sis, and timing (initial or follow-up), and to guard against subtle temporal alterations in the digitizing procedure. The landmark configurations were superimposed using generalized least-squares Procrustes fit (GLS) to remove nonshape variability (differences in location, orientation, and size) in the landmark coordinates (Rohlf and Slice 1990). A matrix, W, consisting of the partial warp scores and the uniform component was then computed (Bookstein 1991, 1996). This matrix contains all of the shape information captured in the landmark configurations.
Statistical Analyses
Permutation tests were applied to test the effects of gender, diagnosis, time, age, and all their possible interactions on brain shape (as captured by the W matrix). The permutation test is based on Goodall’s F statistic for comparing the difference in mean shape between two samples relative to the shape variation found within the samples (Goodall 1991). Our permutation procedure uses a tangent space approximation of Goodall’s F statistic. It is computed using Euclidean distances from the W matrix instead of Procrustes distances. The paired comparisons design (each individual’s initial and follow-up scans form a pair) is not considered when calculating this statistic, but it is taken into account by the permutation procedure. Pairs of rows of the design matrix, corresponding to the initial and follow-up scans of
each individual, are permuted as blocks; within each block the first and second rows are permuted independently of the other blocks. For each permutation the modified Goodall’s statistic is calculated and saved. The proportion of F values that are equal to or larger than the original value of the statistic is reported as the p value of the test. Using the permutation procedure has the advantage of eliminating dependence on the restrictive assump-tions of Goodall’s F test.
Graphic Representation
Consensus configurations, displacement vectors, thin plate splines, and averaged unwarped images were used for visualizing brain shape changes associated with diagnosis, time, gender, and age. A consensus configuration is the average of x and y coordinates of the Procrustes-aligned configurations taken land-mark by landland-mark. Displacement vectors connect the landland-marks of one configuration with the corresponding landmarks of an-other configuration that has been superimposed on the first. A thin plate spline (TPS) deformation grid represents the smoothest interpolation required for exactly mapping the coordinates of one landmark configuration into another (Bookstein 1991). An aver-age unwarped imaver-age is a pixel-by-pixel averaver-age of a number of individual images (here MRI scans) after being aligned to their consensus configuration using the TPS function (Bookstein 1991). The apparent movements of landmarks and expansion and contraction of areas in the deformation grids are all relative to the configuration as a whole and indicate shape (not absolute size) changes of different regions in the brain.
Results
Overall Test
Table 2 summarizes the results of testing the multivariate general linear model with 55 psychiatric patients as the syndromal group. The probabilities were estimated using the permutation test procedure described above. The shape differences between male and female patients were larger than expected due to chance (p , .039). The diagnosis-by-time interaction was also larger than expected due to chance (p , .027), indicating that shape differences between patients and control subjects are not the same through the 3–5 year follow-up period, or, equivalently, that the shape changes between the initial and follow-up scans were not the same in patients and control subjects. This interaction precludes a simple interpretation of the main effects of either diagnosis or time (even though the effect of time by itself is statistically significant). Instead, the effects of diagnosis and of time were examined by retesting each within the categories of the other. The effects of gender and age on brain shape were also examined within each diagnostic and time category.
Similar results were obtained when limiting the syndro-mal group to the patients diagnosed with chronic schizo-phrenia or schizoaffective disorder at the follow-up time Figure 1. The locations of the landmarks used in the present
(n 5 43). The diagnosis-by-time interaction remained significant (p, .038), but the gender effect lost signifi-cance (p,.11), as would be expected from a reduction in the sample size.
The paired comparison design for the effect of time was not considered when calculating Goodall’s F values, but it was taken into account by the permutation testing proce-dure. This is why F values for terms that include a time effect may have lower p values than F values of a similar or even larger magnitude for terms not including a time effect.
The Diagnosis-by-Time Interaction
We report the nominal p values for the permutation tests performed within each subset of the data; however, the Bonferroni method can be used to control for the experi-mentwise error rate. This is done by comparing the nominal p values with the desired type I error rate divided by 4 (for example, use .0025 to obtain an experimentwise type I error rate of .01).
ANALYSES WITHIN EACH DIAGNOSTIC CATEGORY.
Table 3 shows that the effect of time was statistically significant (even after a Bonferroni adjustment) in patients (p,.002) but not in control subjects. The effect of time remained significant when limiting the test to patients diagnosed at follow-up time with chronic schizophrenia or schizoaffective disorder (p,.009).
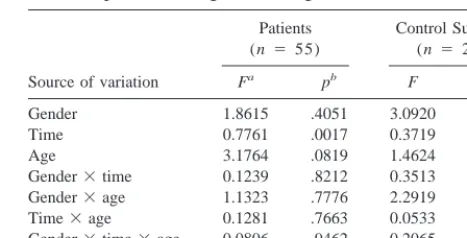
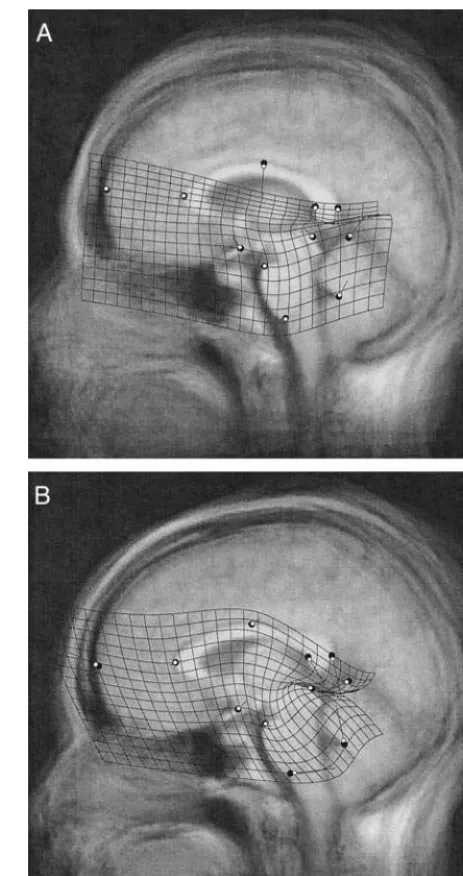
Figure 2 shows the changes in brain morphology from the initial to the follow-up scans in patients (A) and in
control subjects (B). For the purpose of graphic represen-tation, time was treated as a binary variable, disregarding differences in the duration of the follow-up period among individuals. The superimposition of the consensus config-urations of the initial and follow-up scans allows us to see the magnitude and direction of changes in mean landmark locations. The TPS deformation grid and displacement vectors (but not the positions of the landmarks) were exaggerated by a factor of 10 to make the subtle patterns of shape change more visible. The distribution of age and gender in the initial and follow-up sets of scans are identical and so the graphics here, in parallel to the statistical procedure, characterize the shape change over time while holding other variables constant. Only the 43 patients diagnosed with chronic schizophrenia or schizo-affective disorder at follow-up time were used in Figure 2. Including the 12 remaining patients did not change this figure in any appreciable way.
ANALYSES AT EACH TIME OF SCAN. Similar
statis-tical procedures were used to test for the effects of gender, diagnosis, and age on brain morphology within the initial and follow-up sets of scans (Table 4). The differences between patients and control subjects were not significant in the initial scans, and they were even less so in the follow-up scans. Similar results were obtained when limiting the tests to patients diagnosed with chronic schizophrenia or schizoaffective disorder at follow-up time.
Proper graphic presentation of shape differences be-tween patients and control subjects is complicated by unbalanced sampling. The proportion of female subjects is higher in the control group (.41) than in the subset of patients diagnosed at follow-up with chronic schizophre-nia and schizoaffective disorder (.30); thus differences between the consensus configurations for patients and control subjects would be partially confounded by shape Table 2. Testing the Effects of Gender, Diagnosis, Time, and
Age on Brain Shapea
in the Complete Sample (55 Patients and 22 Control Subjects)
Source of variation Fb pc
Gender 3.7948 .0388
Diagnosisd 2.3154 .2376
Timee 0.4767 .0325
Agef 2.5309 .1822
Gender3diagnosis 1.6544 .5054 Gender3time 0.1815 .5503 Gender3age 1.7450 .4512 Diagnosis3time 0.4922 .0268 Diagnosis3age 0.5644 .9783 Time3age 0.0546 .9870 Gender3diagnosis3time 0.3257 .1436 Gender3diagnosis3age 2.0700 .3187 Gender3time3age 0.1599 .5965 Diagnosis3time3age 0.0629 .9746 Gender3diagnosis3time3age 0.1752 .5276
aAs captured by the matrix of partial warp scores and uniform component (W). bModified Goodall’s F.
cProbabilities are calculated using a permutation test (10,000 iterations). dDiagnosis is treated as a simple binary variable.
eTime is in months since the initial scan (zero in all of the initial scans). fAge is in years at time of initial scan.
Table 3. Testing the Effects of Gender, Time, and Age on Brain Shape within Diagnostic Categories
Source of variation
Gender 1.8615 .4051 3.0920 .1024 Time 0.7761 .0017 0.3719 .0896 Age 3.1764 .0819 1.4624 .5882 Gender3time 0.1239 .8212 0.3513 .1158 Gender3age 1.1323 .7776 2.2919 .2682 Time3age 0.1281 .7663 0.0533 .9856 Gender3time3age 0.0806 .9462 0.2065 .4013
The independent and shape variables are as in Table 2.
aModified Goodall’s F.
differences due to gender. To make the female-to-male ratio in patients with schizophrenia equal to that in control subjects, the 11 male patients with schizophrenia with the lowest quality MRI images were not used in preparation of Figure 3. A similar procedure was used with the complete sample of patients and the resulting visualizations were
essentially the same as those constructed using the schizo-phrenia/schizoaffective disorder subset. The distributions of age and time were little affected by the elimination of “excess” male patients, the mean follow-up period length and age remained very similar between patients and control subjects. Differences in variance among the dif-ferent categories should not affect the graphic representa-tion, barring a strong presence of certain kinds of nonlin-ear relationship between shape, on one hand, and time or age, on the other. Plotting partial warp scores against time and age showed little evidence for such nonlinearity.
Gender Effects
Table 2 indicates the presence of sexual dimorphism in brain morphology. Testing for gender effects within initial and follow-up scans (Table 4) confirms this finding and suggests that this difference is stable throughout the follow-up period. Gender and its interactions were not significant when tested separately within either diagnostic category, as would be expected given the reduction in the sample size. Note, however, that the results are much closer to significance in control subjects than in patients despite their smaller sample size (Table 3).
The unbalanced design makes the graphic representa-tion of gender effects difficult. Not only is the ratio of control subjects to patients higher in women than in men, but there is also a mean age difference of about 6 years between the genders in the patient group (Table 1). Examining the deformation grids within diagnostic cate-gories (Figure 4) avoids confounding the effects of schizo-phrenia with those of gender, and provides a separate graphic representation of sexual dimorphism in the 43 patients with chronic schizophrenia or schizoaffective disorder (for whom the age gap between the genders is part of the disease phenomenology) for comparison with that of control subjects.
Figure 2. The effect of time on brain shape in patients (A) and control subjects (B). The follow-up consensus configuration (white circles) is least squares superimposed on the initial consensus configuration (large dark circles). The average un-warped image of the initial scans is shown in the background. The displacement vectors and thin plate spline grid show the deformation of the initial consensus into the follow-up consensus with their magnitude exaggerated by a factor of 10 (the position of the landmarks is not exaggerated).
Table 4. Testing the Effects of Gender, Diagnosis, and Age on Brain Shape within Initial and Follow-Up Scans
Source of variation
Initial scans (n 577)
Follow-up scans (n 5 77)
Fa pb F p
Gender 1.9777 .0437 2.0278 .0414 Diagnosis 1.6178 .1105 1.1335 .3206 Age 1.3056 .2220 1.1364 .3211 Gender3diagnosis 0.8732 .5351 1.1329 .3275 Gender3age 0.9593 .4511 0.8366 .5632 Diagnosis3age 0.3301 .9770 0.2297 .9952 Gender3diagnosis3age 1.1917 .2905 1.0245 .3975
The independent and shape variables are as in Table 2.
aModified Goodall’s F.
Age Effects
Age effects were not statistically significant in any of the tests performed with the complete patient sample; how-ever, the probability for an age effect was much reduced when limiting the syndromal group to the chronic schizo-phrenia and schizoaffective disorder (at follow-up time)
patients in the overall test (n5 65, F53.217, p, .08) and was significant when testing within that subset of patients (n 543, F5 4.7396, p,.011).
Discussion
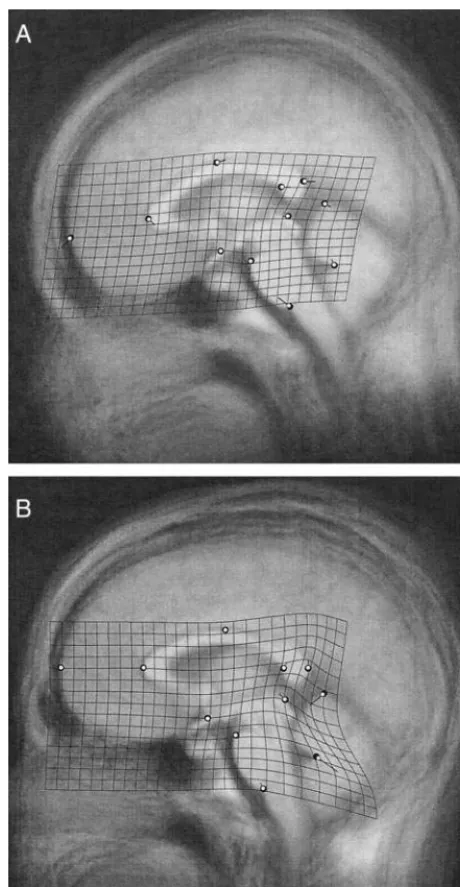
Our study investigated midline regional brain shape differ-ences between patients with schizophrenia and control sub-Figure 3. The effect of schizophrenia on brain shape at time of
diagnosis (A) and 3–5 years later (B). The patient consensus configuration (white circles) is least squares superimposed on the control consensus configuration (large dark circles). The average unwarped image of the control scans is shown in the background. The displacement vectors and thin plate spline grid show the deformation of the control consensus into the patient consensus with their magnitude exaggerated by a factor of 10 (the position of the landmarks is not exaggerated).
jects at the time of a first psychotic episode and 3–5 years later. The significant diagnosis-by-time interaction term and the significant time main effect within patients suggest that some aspects of brain morphology do change in patients with schizophrenia during the 3–5 years following the onset of symptoms beyond the normal change found in nonpsychiat-ric individuals. The effect size for time in patients was twice that in control subjects (F50.776 and F50.372, respec-tively) suggesting that the higher significance of time effect in patients is not simply owing to their larger sample size.
The midline shape differences in brain morphology be-tween patients and control subjects were not statistically significant at the time of diagnosis and seem to become less significant with the passage of time. Many of the differences found by graphic inspection, however, are very similar to those reported in DeQuardo et al (1996) and Bookstein (1995), and these abnormalities seem to largely persist throughout the follow-up period. The deformation grids of these two studies—which shared the syndromal group— show a relative expansion of the area between the splenium, the colliculus, and the cerebellum (and a complementary compression in the area between the colliculus, the pons, and the chiasm) that is comparable to what we see in Figure 3 at either time. In fact, these two studies reported an increase in the relative distance between the superior colliculus and the splenium (contributing to the said expansion) to be the most significant schizophrenia abnormality using the 13-landmark scheme. The relative thinning of the splenium in patients with schizophrenia that was emphasized in Bookstein (1995) can be detected in our contrast of patients and control subjects at both diagnosis and follow-up times. The arching of the corpus callosum and the relative backward movement of the genu seen in Figure 3 (both A and B) are also comparable to what was found in the two earlier studies. The thinning of the splenium, backward movement of the genu, and arching of the corpus callosum were better resolved in Bookstein (1997), in which a variant of landmark analysis was devised and applied to the data of Bookstein (1995) focusing on the complete outline of the corpus callosum. DeQuardo et al (1999) used a landmark configuration that partially overlaps with those used in Bookstein (1995), DeQuardo et al (1996), and the study discussed here to examine the neuroanatomy of first-episode schizophrenia. The increased number of non-overlapping landmarks between the configuration of De-Quardo et al (1999) and those of the three other studies complicates the comparison; indeed, their deformation grids and superimposition plots are less similar to those of the other three. Still, the plots of DeQuardo et al (1999) clearly reproduce the relative backward movement of the genu and the relative expansion of the area between the splenium, the cerebellum, and the superior colliculus that was found in the other three studies. In rendering Figure 3, individuals were chosen so that the gender composition within both patients
and control subjects was the same (.41 female, .59 male). This proportion is intermediate between those used in Book-stein (1995) and DeQuardo et al (1996) (.50:.50, on one hand, and those in DeQuardo et al [1999], .31:.69, on the other) and is close enough to either to make cross-study graphic com-parisons legitimate. This might be important because al-though the gender-by-diagnosis and gender-by-diagnosis-by-time interaction terms were not statistically significant, the differences between patients and control subjects were quite different when examined separately in men and women (figures available upon request). The resolution of this question requires a larger sample size than was available for this study. Tibbo et al (1998) found no significant differences in corpus callosum shape between 79 male patients with schizophrenia and 65 male control subjects using a landmark-based analysis (but see comment by DeQuardo 1999).
Useful comparisons with previous studies (e.g., Hoff et al 1994, which overlaps the study sample of the work discussed here) are precluded by differences in method of quantifica-tion (landmark vs. linear distances, area or volumetric anal-ysis) and whether measurements were controlled for total brain size.
The effect of age on brain shape was at best marginally significant in the overall test but significant within the subset of patients diagnosed with chronic schizophrenia or schizoaffective disorder at time of follow-up. Still, sepa-rate TPS representations of age effects within patients and control subjects showed similarities that are difficult to interpret as anything other than a reflection of a common brain aging process (figures available upon request). These results suggest that taking age effects into consideration when examining the dynamics of schizophrenia abnormal-ities was a warranted precaution.
Although not conclusive in their support of one etiologic hypothesis over the others, our results could be instructive in planning further tests of these hypotheses. The methodology we have presented in this article seems to be especially suited for application in studies that examine changes in brain morphology with aging, progressive disease processes, med-ication, and other variables.
Supported by Ecological and Evolutionary Physiology (IBN-9728160) program of the National Science Foundation (FJR, DES).
The landmark configurations were digitized using tpsDig, the GLS superimposition and calculation of W were performed using tpsRelw and the average unwarped images were produced using tpsSuper, both written by F. James Rohlf. The figures that combine consensus config-urations, TPS splines, displacement vectors, and unwarped average images were produced in Morpheus et al, written by Dennis E. Slice. The permutation procedures for multivariate testing were written and per-formed in MATLAB (MathWorks, Natick, MA) by Waleed Gharaibeh. These programs are available from the SUNY at Stony Brook morpho-metrics website: http://life.bio.sunysb.edu/morph.
The authors thank Mary Kritzer for providing technical help with data collection, Dean Adams for critiquing the morphometric and statistical methodology, and Kerry Brown for help with the manuscript. The constructive comments by three anonymous reviewers were also greatly appreciated.
References
Bookstein FL (1991): Morphometric Tools for Landmark Data:
Geometry and Biology. Cambridge, UK: Cambridge
Univer-sity Press.
Bookstein FL (1995): How to produce a landmark point: The statistical geometry of incompletely registered images. In: Metler R, Wu A, Bookstein F, Green W, editors. Vision
Geometry IV. S.P.I.E. Proceedings, Vol 2573. Bellingham,
WA: SPIE Press, 266 –277.
Bookstein FL (1996): Standard formula for the uniform shape component in landmark data. In: Marcus LF, Corti M, Loy A, Naylor G, Slice D, editors. Advances in Morphometrics. New York: Plenum Press, 153–168.
Bookstein FL (1997): Landmark methods for forms without landmarks: Localizing group differences in outline shape.
Med Image Analysis 1:225–243.
Bookstein FL (1998): Linear methods for nonlinear maps: Procrustes fits, thin-plate splines, and the biometric analysis of shape variability. In: Toga A, editor. Brain Warping. San Diego: Academic Press, 157–181.
DeLisi LE (1999): Defining the course of brain structural change and plasticity in schizophrenia. Psychiatry Res Neuroimaging 92:1–9.
DeLisi LE, Sakuma M, Kushner M, Finer DL, Huff AL, Crow TJ (1997): Anomalous cerebral asymmetry and language pro-cessing in schizophrenia. Schizophr Bull 23:255–271. DeQuardo JR (1999): Landmark analysis of corpus callosum
shape in schizophrenia. Biol Psychiatry 46:1712–1713. DeQuardo JR, Bookstein FL, Green WDK, Brunberg JA, Tandon R
(1996): Spatial relationships of the neuroanatomic landmarks in schizophrenia. Psychiatry Res Neuroimaging 67:81–95. DeQuardo JR, Keshavan MS, Bookstein FL, Bagwell WW,
Green WDK, Sweeney JA, et al (1999): Landmark-based morphometric analysis of first-episode schizophrenia. Biol
Psychiatry 45:1321–1328.
Goodall C (1991): Procrustes methods in the statistical analysis of shape. J R Stat Soc B 53:285–339.
Gould E, Reeves AJ, Graziano MSA, Gross CG (1999): Neurogen-esis in the neocortex of adult primates. Science 286:548 –552. Hoff AL, Neal C, Kushner M, DeLisi LE (1994): Gender
differences in corpus callosum size in first-episode schizo-phrenia. Biol Psychiatry 35:913–919.
Keshavan MS, Haas GL, Kahn CE, Auilar E, Scooler NR, Sweeney JA, et al (1998): Superior temporal gyrus and the course of early schizophrenia: Progressive, static or revers-ible? J Psychiatr Res 32:161–167.
Lawrie SM, Whalley H, Kestelman JN, Abukmeil SS, Byrne M, Hodges A, et al (1999): Magnetic resonance imaging of brain in people at high risk of developing schizophrenia. Lancet 353:30 –33.
Lieberman JA (1999): Is schizophrenia a neurodegenerative disorder? A clinical and neurobiological perspective. Biol
Psychiatry 46:729 –739.
Marcus LF, Corti M, Loy A, Naylor G, Slice D, editors (1996):
Advances in Morphometrics. New York: Plenum Press.
Pearlson GD, Marsh L (1999): Structural brain imaging in schizo-phrenia: A selective review. Biol Psychiatry 46:627– 649. Rohlf FJ (1999): Shape statistics: Procrustes superimpositions
and tangent spaces. J Classification 16:197–223.
Rohlf FJ, Slice D (1990): Extensions of the Procrustes method for the optimal superimposition of landmarks. Syst Zool 39:40 –59.
Spitzer RL, Endicott J (1978): Schedule for Affective Disorders
and Schizophrenia (SADS). New York: New York State
Psychiatric Institute, Biometrics Research Department. Tibbo P, Nopoulos P, Arndt S, Andreasen NC (1998): Corpus
callosum shape and size in male patients with schizophrenia.
Biol Psychiatry 44:405– 412.
Weinberger DR (1987): Implications of normal brain develop-ment for the pathogenesis of schizophrenia. Arch Gen