GOLD MINERAL PROSPECTING USING PHASED ARRAY TYPE L-BAND
SYNTHETIC APERTURE RADAR (PALSAR) SATELLITE REMOTE SENSING DATA,
CENTRAL GOLD BELT, MALAYSIA
Amin Beiranvand Pour*, Mazlan Hashim Geoscience and Digital Earth Centre (Geo-DEC) Research Institute for Sustainability and Environment (RISE)
Universiti Teknologi Malaysia (UTM) 81310 UTM Skudai, Johor Bahru, Malaysia
*Corresponding author: [email protected]; [email protected] Commission VI, WG VI/4
KEY WORDS: Gold prospecting; PALSAR; Bentong-Raub Suture Zone; Peninsular Malaysia; tropical environments
ABSTRACT:
The Bentong-Raub Suture Zone (BRSZ) of Peninsular Malaysia is one of the significant structural zones in Sundaland, Southeast Asia. It forms the boundary between the Gondwana-derived Sibumasu terrane in the west and Sukhothai arc in the east. The BRSZ is also genetically related to the sediment-hosted/orogenic gold deposits associated with the major lineaments and form-lines in the central gold belt Central Gold Belt of Peninsular Malaysia. In tropical environments, heavy tropical rainforest and intense weathering makes it impossible to map geological structures over long distances. Advances in remote sensing technology allow the application of Synthetic Aperture Radar (SAR) data in geological structural analysis for tropical environments. In this investigation, the Phased Array type L-band Synthetic Aperture Radar (PALSAR) satellite remote sensing data were used to analyse major geological structures in Peninsular Malaysia and provide detailed characterization of lineaments and form-lines in the BRSZ, as well as its implication for sediment-hosted/orogenic gold exploration in tropical environments. The major geological structure directions of the BRSZ are N-S, NNE-SSW, NE-SW and NW-SE, which derived from directional filtering analysis to PALSAR data. The pervasive array of N-S faults in the study area and surrounding terrain is mainly linked to the N-S trending of the Suture Zone. N-S striking lineaments are often cut by younger NE-SW and NW-SE-trending lineaments. Gold mineralized trends lineaments are associated with the intersection of N-S, NE-SW, NNW-SSE and ESE-WNW faults and curvilinear features in shearing and alteration zones. Lineament analysis on PALSAR satellite remote sensing data is a useful tool for detecting the boundary between the Gondwana-derived terranes and major geological features associated with suture zone especially for large inaccessible regions in tropical environments.
1. INTRODUCTION
Numerous structural geology studies have been conducted in arid and semi-arid regions using optical and radar satellite data (Raharimahefa, and Kusky, 2007, 2009). The analysis of geological structures using optical satellite remote sensing data in tropical environments is complicated as a consequence of the vegetation cover, persistent cloud coverage and limited bedrock exposures. Synthetic Aperture Radar (SAR) image data provide information different from that of optical sensors. SAR is an active microwave remote sensing system which can acquire data regardless of day or night time, cloud, haze or smoke over a region. Clouds are reasonably transparent to microwave providing measurements with almost any weather conditions. Radar transmits and detects radiation between 2.0 to 100 cm, typically at 2.5-3.8 cm (X band), 4.0-7.5 cm (C band), and 15.0-30.0 cm (L band) (Campbell, 2007).
Phased Array type L-band Synthetic Aperture Radar (PALSAR) is a L-band SAR sensors with multi-mode observation function (Fine mode, Direct downlink, ScanSar mode, and Polarimetric
mode). It has multi polarization configuration (HH, HV, VH, and VV), variable off-nadir angle (9.9 to 50.8 degrees), and switching spatial resolution (10 m, 30 m, 100 m for Fine, Polarimetric, and ScanSar modes, respectively) and swath width observation (30 km, 70 km, and 250-350 km for Polarimetric, Fine and ScanSar modes, respectively) (Igarashi, 2001). L-band SAR data can observe the forest’s underlying surface features as well as the canopy because of its penetration capability. Thus, in tropical environments, L-band SAR data provide the possibility of obtaining more useable geological structure information. Systematic structural analysis of the BRSZ using remote sensing data is rare. South-eastern part of the BRSZ was analyzed to detect major lineaments trend and tectonic structures of the region using PALSAR data (Pour and Hashim, 2014, 2015). The objective of this investigation is to characterize major geological structures in Peninsular Malaysia and especially delineate lineaments and form-lines in the BRSZ and Central Gold Belt using PALSAR satellite remote sensing data at regional scale.
The International Archives of the Photogrammetry, Remote Sensing and Spatial Information Sciences, Volume XLI-B8, 2016 XXIII ISPRS Congress, 12–19 July 2016, Prague, Czech Republic
This contribution has been peer-reviewed.
2. MATERIALS AND METHODS 2.1 Geology of the study area
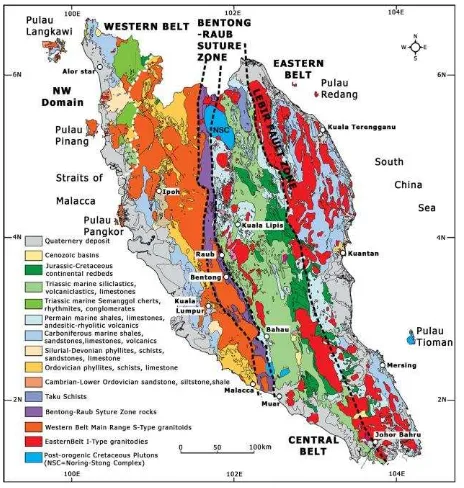
The north-south trending Bentong-Raub Suture Zone (BRSZ) extends from Thailand through Raub and Bentong to the east of Malacca, Peninsular Malaysia (Figure 1). This suture represents the main Palaeo-Tethys Ocean that was destroyed by collision between the Sibumasu and Sukhothai continental terranes of Southeast Asia (Metcalf., 2013). The BRSZ has accommodated considerable strike-slip movement. The formation of the BRSZ was probably coeval with the emplacement of major faults. Many gold mines and prospects in the Peninsular Malaysia are associated with the major lineaments along the BRSZ.
Figure 1. Simplified geological map of the peninsular Malaysia.
2.2 Remote sensing data
In this study, the Phased Array type L-band Synthetic Aperture Radar (PALSAR) data were used to analyze major geological structures in Peninsular Malaysia and detailed characterizations of lineaments in the Bentong-Raub Suture Zone (BRSZ). Two ScanSAR mode dual polarization level 3.1 PALSAR-2 scenes were obtained from ALOS-2 data distribution consortium online system (Remote Sensing Technology Center of Japan (RESTEC) (http://www.restec.or.jp/english/index.html) and PASCO Corporation (http://en.alos-pasco.com; https://satpf.jp/)) for geological structural mapping of the entire Peninsular Malaysia. Six Fine mode dual polarization Level 4.1 PALSAR-1 scenes were obtained from the Earth and Remote Sensing Data Analysis Center (ERSDAC) Japan (http://gds.palsar.ersdac.jspacesystems.or.jp/e/) for comprehensive geological structural mapping of the Bentong-Raub Suture Zone (BRSZ) and surrounding terrain. The PALSAR data were processed using the ENVI (Environment
for Visualizing Images) version 4.8 software package in this study.
2.3 Data processing
In this study, spatial convolution filtering technique was selected and applied to the PALSAR data for geological structural analysis. Spatial convolution filtering is based primarily on the use of convolution masks. Any weighting function suited to be the application at hand. This flexibility makes convolution one of the most useful tools in image processing (Schowengert, 2007). Four principal Directional filters: N-S, E-W, NE-SW, and NW-SE with 5*5 and 7*7 kernel sizes were applied to ScanSAR, Fine and polarimetric scenes. 5*5 kernel matrix was selected for ScanSAR scenes to enhance rough/smooth and semi-rough features in Peninsular Malaysia at regional scale. 7*7 kernel matrix was applied to Fine and polarimetric scenes for enhancing semi-smooth and smooth/rough features in the BRSZ at district scale (Table 3) (Chavez and Bauer, 1982; Jensen, 2005). Directional filter angles were adjusted as N-S: 0◦, E-W: 90◦, NE-SW: 45◦, and NW-SE: 135◦.
3. RESULTS AND DISCUSSION
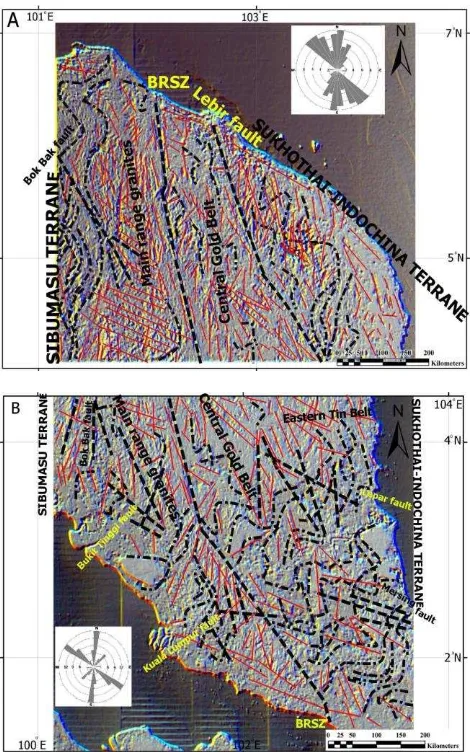
Directional filters were applied to PALSAR-2 ScanSAR images for detailed analysis of major lineament structures in Peninsular Malaysia. HV polarization channel was selected for directional filtering. HV polarization is more suitable for lineament extraction and edge enhancement in tropical environments than other polarization channels, because cross- polarization is more sensitive to lineament and also enhances penetration. Hence, HV polarization channel recorded more geological features that cover by dense vegetation. Fig 2 (A and B) shows the results of RGB colour-composite for N-S, NE-SW, and NW-SE (R: 0◦, G: 45◦, B: 135◦) directional filters. Major change in deformation style is obvious from the west (Sibumasu terrane) to the east (Sukhothai Arc/East Malaya terrane) in the Fig 2 A of northern part of Peninsular Malaysia. Structural analysis reveals four distinct parts from the west to the east, including western part of the scene by ductile fabrics, western of the BRSZ affected mainly by brittle deformation, ductile-brittle deformation between the BRSZ and Lebir Fault Zone and brittle-ductile fabrics between Lebir Fault Zone and eastern coastal line. Lineament occurrence in Fig 4 A is mainly linked to the N-S trending of the BRSZ and Lebir Fault Zone. Generally, major faults are strike-slip with both dextral and sinistral movements, which trend N-S and NW-SE. The collision zone and compressional structures appear clearly in the west of the BRSZ in Main Range granites (Fig 2 A). Deformation in this region shows the shortening zone oriented parallel to the BRSZ. Several faults, joints and fractures represent brittle deformation events in the region that mostly strike NW-SE. Generally, most of the short lineaments are clustered in the collision zone. Ductile deformation in the western margin of the image (Fig 2 A) includes upright asymmetrical mega folds with axial surfaces oriented W-E. Brittle-ductile fabrics in the eastern part of image between Lebir Fault Zone and eastern coastal line illustrate curved shear zone that occupied by several N-S and NW-SE striking faults, fractures and joints. A mega concentric fold surrounds the shear zone with a WE striking axial surface.
The International Archives of the Photogrammetry, Remote Sensing and Spatial Information Sciences, Volume XLI-B8, 2016 XXIII ISPRS Congress, 12–19 July 2016, Prague, Czech Republic
This contribution has been peer-reviewed.
According to the orientation of the lineaments, sinistral movement along the Lebir Fault Zone is generated the tectonic features. Some N-S trending normal faults and small curvatures are also identifiable near the eastern coastal line.
Figure 2. (A) RGB colour-composite of N-S (0◦), NE-SW (45◦), and NW-SE (135◦) directional filters of northern part of Peninsular Malaysia. (B) RGB colour-composite of N-S (0◦), NE-SW (45◦), and NW-SE (135◦) directional filters of southern part of Peninsular Malaysia. Rose diagram (10 classes) shows the direction of lineaments found in the images.
In Fig 2 B the boundary of the southern part of the Sibumasu terrane in the west and Sukhothai Arc/East Malaya terrane in the east is quite prominent. The zone of collision between two Gondwana-derived continental blocks appears clearly, where it is truncated by the Bentong-Raub thrust. NW-SE trending Main Range granites that is parallel to the BRSZ is well exposed in western part of the image. N-S, NW-SE, NSSW and NE-SW trending lineaments are detected along with some of the major fault and brittle zones located in western part of Peninsular Malaysia such as Bukit Tinggi fault zone, Kuala Lumpur fault zone and southern part of Bok Bak fault zone. Major lineaments in brittle zones are strike-slip faults and associated with sinistral displacements. Ductile and brittle deformation fabrics in the eastern part of Fig 2 B (Sukhothai Arc/East Malaya terrane) represent a variety of structural features, including faults, fractures, joints and several fold style groups. Most of the long lineaments in this terrane trend N-S and NW-SE and some short lineaments strike NE-SW and E-W.
Ductile structures illustrate complicated form-lines features; several fold systems with different axial surfaces are delineated in the south-eastern part of the image (Fig. 2 B). N-S, NNW-SSE and W-E axial surface directions can be discerned in the image. Some of the form-lines features attributed to complicated refolded folding events and exhibit multiple deformation phases.
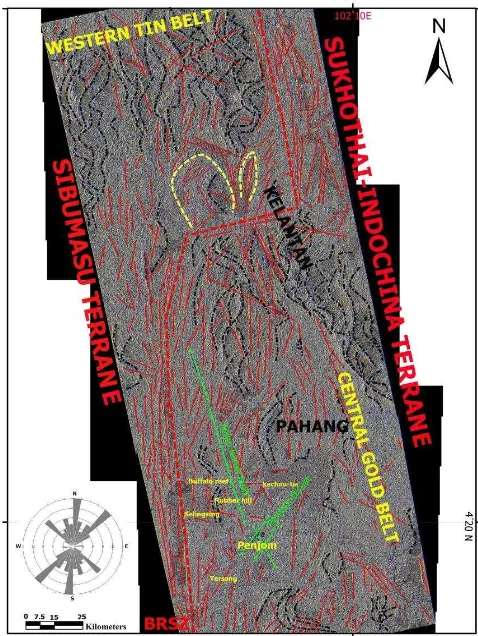
Six Fine mode dual polarization mode PALSAR-1 data cover the BRSZ and surrounding area were analysed to delineate lineaments and form-lines. PALSAR fine observation images of the BRSZ were processed using directional filters to map geological structural elements associated with numerous vein-hosted gold deposits in the Kuala Lipis region (e.g. Penjom gold deposit) in the Pahang state and many prospects of gold mineralization in the Kelantan state (e.g. Ulu Sokor). It covers the eastern part of the BRSZ and centre of the Central Gold Belt. Penjom, Selinsing and Buffalo reef goldfields, Rubber hill, Kechau-Tui, Tersang, Ketok Batu and Pular gold deposits are among gold mineralization in the Central Gold Belt, which are located in this PALSAR scene. Figure 3 shows the RGB results for N-S, NE-SW, and NW-SE (R: 0◦, G: 45◦, B: 135◦) filtering directions applied to the image. Brittle (lineaments) and ductile (form-lines) structures are detected in Figure 3. Three major trends N-S, NW-SE and NE-SW of lineaments are mainly present in the image. N-S and NE-SW trending lineament systems are extensive in the western part of the scene. The western and northern parts of the image exhibit longer and more lineaments related to the BRSZ. The central and eastern parts of the image contain lineaments that strike NE-SW and SE, which are located in the Central Gold Belt. Some NW-SE trending lineaments are associated with normal faults. Most of the known gold deposits are located along splay faults in the Central Gold Belt, which are confined within brittle-ductile share or brecciated zones. The Penjom gold deposit is located along splay faults. The other major goldfields featured in Figure 8 are the Selinsing and Buffalo reef. They are located along N-S trending regional structures in the SW part of the image (Fig. 8). N-S and NE-SW trending faults and fold systems are obviously manifested in the gold mining districts. The Selinsing and Buffalo reef lies close to the eastern flank of the BRSZ (Fig. 3).
In the Kelantan gold district, regional-scale structures are dominantly N-S and NW-SE trending faults. The structural lines with N-S, NW-SE and NE-SW directions are apparent in the central part of the image (Kelantan sate (Fig. 3)), which are in accordance with the tectonic framework of the BRSZ and Central Gold Belt. Major N-S, NW-SE and NE-SW orientations and strike-slip faults with sharp boundaries are recognizable. The N-S orientation of the BRSZ is detected in the central western part of the image. Several short faults and fractures strike N-S, NNW-SSE and ESE-WNW, and are connected to longer lineaments. Highest curvilinear densities are concentrated in the northern part of the scene (Fig. 3). These ductile structures consisting of open upright folds with W-E and ENE-WSW striking axial surfaces. Several fold systems with similar characteristics are manifested in the central and southern part of the image (Fig. 3). Two anticline structures with N-S and NE striking axial planes are detected in the central north part of the region. Ductile deformation is dominated in this domain creating folds and anticline structures.
The International Archives of the Photogrammetry, Remote Sensing and Spatial Information Sciences, Volume XLI-B8, 2016 XXIII ISPRS Congress, 12–19 July 2016, Prague, Czech Republic
This contribution has been peer-reviewed.
Figure 3. RGB image of N-S (0◦), NE-SW (45◦), and NW-SE (135◦) directional filters covering eastern part of the Bentong-Raub Suture Zone. Rose diagram (10 classes) shows the direction of lineaments found in the image.
4. CONCLUSIONS
This study demonstrates the use of PALSAR remote sensing data in targeting potentially economic gold prospects. Structural investigation has shown sets of N-S, NE-SW, NNW-SSE and ESE-WNW gold mineralized trends associated with fault-related rocks such as cataclasite and mylonite and hydrothermal alteration zones. Cataclasite and mylonite are commonly exposed in close proximity to ore bodies. Compressional tectonics structures such as NW-SE trending thrust, ENE-WSW oriented faults, recumbent folds, and asymmetric anticlines are also prospective targets for gold mineralization. Importantly, PALSAR remote sensing data help predict zones of enhanced permeability, which may have played a significant role in depositing gold and other metals from metamorphic-hydrothermal fluids to form sediment-hosted gold deposits in the Central Gold Belt of Peninsular Malaysia.
ACKNOWLEDGEMENTS
This study was conducted as a part of TRGS grant, Ministry of Higher Education (MOHE) Malaysia. We are thankful to the Universiti Teknologi Malaysia for providing the facilities for this investigation.
REFERENCES
Campbell, J.B., 2007. Introduction to remote sensing, The Guilford Press, New York.pp.134-147.
Chavez, P.C. and Bauer, B. (1982). An automatic optimum kernel-size selection technique for edge enhancement. Remote Sensing of Environment 12, 23-38.
Igarashi, T., 2001. ALOS Mission requirement and sensor specification, Adv. Space Research, vol.28(1), pp. 127-131. Jensen, J.R. (2005). Introductory Digital Image Processing: A remote sensing perspective. Pearson Prentice Hall, Upper Saddle River NJ 07458. Third edition, p: 276-287.
Metcalf, I., 2013. Tectonic evolution of Malay Peninsula. J. Asian Earth Sci, vol.76, pp. 195-213.
Pour, A.B., Hashim, M., 2015 Structural mapping using PALSAR data in the Central Gold Belt Peninsular Malaysia, Ore Geology Reviews, vol.64, pp. 13-22.
Pour, A.B., Hashim, M., 2014. Structural geology mapping using PALSAR data in the Bau gold mining district, Sarawak, Malaysia, Adv. Space Research, vol.54 (4), pp. 644-654, Raharimahefa, T. T.M Kusky, 2007. Stuctural and remote sensing studies of the southern Betsimisaraka Suture, Madagascar, Gond. Research, vol.10, pp. 186-197,
Raharimahefa, T. T.M Kusky, 2009. Stuctural and remote sensing analysis of the southern Betsimisaraka Suture in northeastern Madagascar, Gond. Research, vol.15, pp. 14-27, Schowengert, R.A.m, 2007. Remote sensing: models and methods for image processing,” 3rd ed, Burlington, M.A, Academic Press, Elsevier. pp. 229-243.
The International Archives of the Photogrammetry, Remote Sensing and Spatial Information Sciences, Volume XLI-B8, 2016 XXIII ISPRS Congress, 12–19 July 2016, Prague, Czech Republic
This contribution has been peer-reviewed.


