RESEARCH OF MULTI-BASELINE INSAR ELEVATION INVERSION BASED ON
MLHE METHOD
Hua Fenfena,b, Zhang Jixianb, Huang Guomanb
aSchool of Environmental Science and Spatial Informatics, China University of Mining and Technology Xuzhou,
China, [email protected]
bInstitute of Photogrammetry and Remote Sensing Chinese Academy of Surveying and Mapping, Beijing, China
KEY WORDS: Multi-Baseline InSAR; Maximum Likelihood Height Estimate; Probability Density Function; Phase error
ABSTRACT:
In this paper, we studied on Maximum Likelihood Height Estimate (MLHE) method to invert elevation using Multi-Baseline InSAR (MB-InSAR) Data. Then a set of simulated data were adopted to do the experiment to illustrate its availability. Meanwhile, this paper also presents the advantages and disadvantages of this approach with analysis of the influence of phase, baseline and range error on elevation inversion, as well as the following attention.
1. INTRODUCTION
InSAR technology makes it possible for topographic mapping by using phase information recorded by SAR data to obtain terrain 3D information. Based on this, Multi-Baseline InSAR (MB-InSAR) introduces coherent coefficient as the interferometric phase index and uses multiple interferograms to invert elevation, which not only avoids the task of phase unwrapping, but considerably reduces the influence of noise. Therefore, this paper studied on Maximum Likelihood Height Estimate (MLHE) method to invert elevation using MB-InSAR Data and presents some important conclusions.
2.MLHE METHOD
Elevation inversion based on MLHE method makes the best of the phase and amplitude information in SAR images without the assumption that the phase difference between adjacent pixels must be less than π. So, this method has
better adaptability and high precision.
S0 S1
S2
Sn
P R0
R1
R2
Rn
h
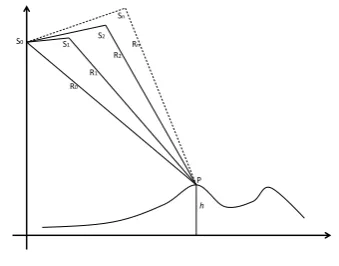
Fig 1. MB-InSAR geometry model
Fig 2. PDF of different coherence coefficients 0.8, 0.6, 0.4
As shown in Fig 1, , , , … …, are SAR
platforms position, and , , ,… …, represents
the distance between SAR sensors and target P. Any two of n+1 SAR images can form an interferogram. If we assume as master image, the theoretical interferometric phase in the interferogram can be expressed by (1).
�ℎ = 4�� � − �� � (1)
Where is radar wavelength, is the remainder after dividing . In actual operation, (1) can be written as follows.
�ℎ = g(� , �⃗⃗⃗ , ℎ)� � (2)
The probability density function describes the relation of measured phase and theorical phase.
Foundation:National high technology research and development program
(‘863 Program’) No.2011AA120402
International Archives of the Photogrammetry, Remote Sensing and Spatial Information Sciences,
Volume XL-7/W1, 3rd ISPRS IWIDF 2013, 20 – 22 August 2013, Antu, Jilin Province, PR China
(� |�ℎ ) = � − |�|
− |�| (� − �ℎ )
× { +|�| (� � −�ℎ� ) −[−|�| (� � −�ℎ� )]
√ −|�| (� � −�ℎ� )
} (3)
� ∈ −�, �]
Where is coherence coefficient. Considering the relationship between interferometric phase and elevation, we can obtain the probability density function of elevation shown in Fig 2 from (2) and (3).
� |ℎ = � − |�| �− |�|− (� , �⃗⃗⃗ , ℎ)�
× { +|�| � � − (� ,�⃗⃗⃗ ,ℎ)� −[−|�| � � − (� ,�⃗⃗⃗ ,ℎ) ]�
√ −|�| � � − (� ,�⃗⃗⃗ ,ℎ)�
} (4)
Elevation inverted by MLHE method corresponds to elevation obtained when (4) is in maximum value, that is the maximum likelihood solution of target P’s elevation.
ℎ̂ = � ��ℎ � |ℎ (5)
Due to the interferometric phase is a remainder with integer ambiguities, the likelihood function has multiple peak positon as shown in Fig 2 corresponding to infinite ℎ̂ .
ℎ̂ , =4��� ± �, = , , , ⋯ ⋯ (6)
And every interferogram has a likelihood function, then (4) and (5) can be written as
� �|ℎ = ∏�= � |ℎ (7)
ℎ̂ = � ��ℎ� �|ℎ (8)
(a) (b)
(c) (d)
Fig 3. The likelihood functions in different baseline cases and MB-InSAR PDF (a) short baseline (b) general baseline (c)long baseline (d) multiplied result by PDFs
As can be seen from Fig 3, different baseline length corresponds to different likelihood function. If we multiply PDFs, we can acquire the very peak position in a rational elevation interval calculated by external DEM or other ways.
3. RESULTS WITH MB-INSAR DATA
This paper performs the experiment with the simulation data and gets some significant conclusions. Simulation data consists of TerraSAR-X system parameter and slant range elevation image generated by SRTM. Based on the same antenna and baseline position, we can separately get the simulation interferograms and elevation images without no noises and errors in different baselines (19m, 29m and 37m) and by MLHE method.
(a)
(b)
International Archives of the Photogrammetry, Remote Sensing and Spatial Information Sciences,
Volume XL-7/W1, 3rd ISPRS IWIDF 2013, 20 – 22 August 2013, Antu, Jilin Province, PR China
(c) (d)
(e) (f)
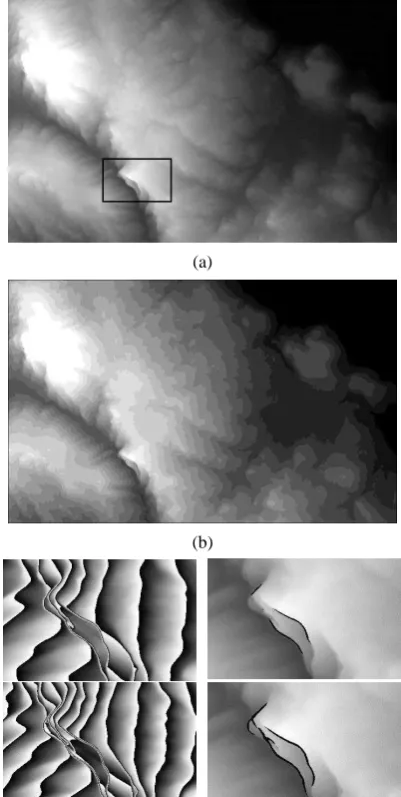
Fig 4. Simulation Results (a) Reference slant-range elevation image (b) Inversion elevation image by MLHE
method (c) Simulation interferograms in different baselines (d) Invesion elevation images in different baselines (e) Inversion elevation image by MLHE (f)
Reference slant-range elevation image
We focus on part of experimental area, the rectangular region shown in Fig 4(a) for convenience's sake. Fig 4(c) and Fig 4(d) shows the interferograms and inversion elevation images of interested region in different baselines, and we can see that with the baseline growth, the interference fringe becomes more and more intensive on the hillside facing the radar sensor, so more unwrapping area appears. However, Fig 4(e) displays perfect inversion elevation without blank by MLHE almost the same with reference slant-range elevation image in Fig 4(f).
The following process should calculate statistical error. Where M,N separately represents number of rows and columns, and we use , and , in place of inversion and true elevation value, that are known from elevation images.
ℎ = √ × ∑ = ∑ = ( , − ℎ , ) (9)
INSTRUCTION ERROR INSTRUCTION ERROR
Reference
Table 1. Statistical errors of simulation data
Single baseline condition is the baseline 3 cases, 37m. Random noise is the mean of 0rad, the standard deviation of 0.1rad, distributed in the range [− , ].
As can be seen from the table, in the case of no the system parameter error, no phase noise, the algorithm can obtain very high accuracy values of elevation without ground control points. The noise had a greater influence on elevation accuracy, than the single baseline condition. Effect of phase error of the single baseline case is approximately linear, multi-baseline case more complex. In the simulation above, we assume that the baseline 1 and baseline 2 with no phase error, phase error effect on baseline 3 distributed in [− , ]. the results are as follows:
(a)
(b) (c)
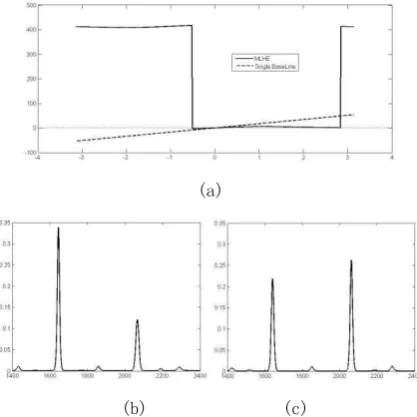
Fig 5. Effect of phase error of elevation in the case of single baseline and multi-baseline
In Fig 5(a), when the phase error is within a certain range, impact on multi-baseline is much lower than single baseline, but beyond a certain range, impact on multi-baseline will be mutated to tens even hundreds of times. This is because when the phase error being changed, the PDF shifted and the maximum of the product of multiple PDFs will transfer from one extreme to another extreme, Fig 5 (b)(c).
Influence of baseline error of elevation inversion is very serious. Slant range error of elevation inversion effect of approximate constant.
4. CONCLUSIONS
Multi-baseline interferometric SAR has many advantages than single baseline: 1) have a certain ability to resist noise, when the noise is small; 2) can estimate altitude value from interferometric phase directly, without phase unwrapping and ground control point; 3) can handle surface discontinuities.
The experiment found that small baseline error will cause the elevation error, or even lead to vertical wavy distribution. Therefore system parameters need to be calibrated.
International Archives of the Photogrammetry, Remote Sensing and Spatial Information Sciences,
Volume XL-7/W1, 3rd ISPRS IWIDF 2013, 20 – 22 August 2013, Antu, Jilin Province, PR China
References:
Ferraiuolo, G., Pascazio, V. 2002. A Bayesian Approach
Based on Modified Markov Random Fields for Microwave
Tomography. IGARSS'02, pp. 3393~3395.
Ferraiuolo, G., Pascazio, V., Schirinzi, G. 2004a. Maximum
a Posteriori Estimation of Height Profiles in InSAR Imaging.
IEEE Trans. on GRS, 1(2), pp. 66-70.
Ferraiuolo, G., Leva, D., Nico, G., et al. 2004b. A Bayesian
Technique for Terrain Mapping Using Multi-frequency
Ground Based Interferometric SAR Systems. IGARSS'04, pp.
469-472.
Lee, J. S., Hoppel, K. W., Mango, S. A., et al. 1994. Intensity
and Phase Statistics of MultilookPolarimetric and
Interferometric SAR Imagery. IEEE Transactions on
Geoscience and Remote Sensing, 32(5), pp. 1017-1028
Li, F., Bao, Z., Li, H., et al. 2006. Image Autocoregistration
and InSAR Interferogram Estimation Using Joint Subspace
Projection. IEEE Transactions on Geoscience and Remote
Sensing, 44(2), pp. 288-297
Lombardini, F., 1996. Absolute Phase Retrieval in a
Three-element Synthetic Aperture Radar Interferometer. CIE
International Conference of Radar, pp. 309-312.
Pascazio, V., Schirinzi, G. 2001. Estimation of Terrain
Elevation by MultifrequencyInterferometric Wide Band
SAR Data. IEEE Signal Processing Lett, 8 pp. 7-9.
Pascazio, V., Schirinzi G. 2002. Multifrequency InSAR
Height Reconstruction through Maximum Likelihood
Estimation of Local Planes Parameters. IEEE Trans. on
Image Processing, 11(12), pp. 1478-1489.
Schmitt, M., Schmitt, U. 2013. Compressive Sensing Based
Layover Separation in Airborne Single-Pass Multi-Baseline
InSAR Data. IEEE Transactions on Geoscience and Remote
Sensing, 51(3), pp. 313-317.
Schmitt, M., Schmitt, U. 2012. Layover Separation in
Airborne Single Pass Multi-baseline InSAR Data Based on
Compressive Sensing. EUSAR 2012, pp. 30-33.
Xu, W., Chang, C., Kwoh, L. K., et al. 1994. Phase
Unwrapping of SAR Interferogram with Multi-Frequency or
Multi-Baseline. IGARSS'94, pp. 730-732.
Zhang, L., Wang, F. 2006. Improving the Interferometric
Phase Accuracy of Distributed Satellites InSAR System with
Multibaseline Data Fusion. Journal of Electronics &
Information Technology, 28(11), pp. 2011-2014. International Archives of the Photogrammetry, Remote Sensing and Spatial Information Sciences,
Volume XL-7/W1, 3rd ISPRS IWIDF 2013, 20 – 22 August 2013, Antu, Jilin Province, PR China