Application of ALOS and Envisat Data in Improving Multi-Temporal InSAR Methods for
Monitoring Damavand Volcano and Landslide Deformation in the Center of Alborz
Mountains, North Iran
Sanaz Vajediana, Mahdi Motaghb, Faramaz Nilfouroushanc
a Department of Surveying and Geomatics engineering, Faculty of Engineering, University of Tehran, Iran. Email:
b Helmholtz Center Potsdam, GFZ, Potsdam, Germany, Email:[email protected]
c Department of Earth Sciences, Uppsala University, Uppsala, Sweden. Email: [email protected]
KEY WORDS: InSAR, Multi Temporal, Deformation, Volcano, Landslide, Topographic correction, SBAS, Ps-InSAR
ABSTRACT
InSAR capacity to detect slow deformation over terrain areas is limited by temporal and geometric decorrelations. Multitemporal InSAR techniques involving Persistent Scatterer (Ps-InSAR) and Small Baseline (SBAS) are recently developed to compensate the decorrelation problems. Geometric decorrelation in mountainous areas especially for Envisat images makes phase unwrapping process difficult. To improve this unwrapping problem, we first modified phase filtering to make the wrapped phase image as smooth as possible. In addition, in order to improve unwrapping results, a modified unwrapping method has been developed. This method includes removing possible orbital and tropospheric effects. Topographic correction is done within three-dimensional unwrapping, Orbital and tropospheric corrections are done after unwrapping process.
To evaluate the effectiveness of our improved method we tested the proposed algorithm by Envisat and ALOS dataset and compared our results with recently developed PS software (StaMAPS). In addition we used GPS observations for evaluating the modified method. The results indicate that our method improves the estimated deformation significantly.
1. Introduction
Monitoring of the crustal deformation provides valuable information for various stages involved in the disaster cycle, from pre-disaster risk reduction to mapping the effects of an event for post-disaster management. Remote sensing geodetic monitoring using techniques such as SAR Interferometry are becoming increasingly important in such studies as they provide regional and spatially continuous maps of deformation with great accuracy, without the need of performing much field work or expensive ground surveys.
InSAR capacity to detect slow deformation over terrain areas is limited by temporal and geometric decorrelations. These limiting factors reduce signal to noise ratio in the deformation estimation. Refractivity variations in the atmosphere is one of these limitations. This effect can introduce a bias in the phase measurement (Zebkeret al., 1997). In flat areas, atmospheric contribution is related only to water vapour variation of the area while in relief areas the contribution also could be due to topography . The other limitations are temporal decorrelation, that causes the loss of coherence in agricultural and vegetated area due to change surface covered by a resolution cell in time, and geometrical decorrelation, that causes the loss of coherence in area with steep terrain due to variation of look angle for each resolution cell during the two acquisitions. All of these limiting factors intend decreasing of the interferogram accuracy. Using more than two SAR scenes leads to redundant observations, which can be used to compensate of decorrelation problem. So integrating multi temporal SAR data using staking techniques could be overcome this problem. Multi-temporal InSAR techniques involving Persistent
Scatterer (Ps-InSAR) which rely on analysis of interferograms with respect to the same master and Small Baseline (SBAS, which forms interferograms with respect to multiple masters) were recently developed to compensate the decorrelation problems (Ferretti et al., 2001; Hanssen, 2001; Hooper, 2008). In this technique, the decorrelation problem is solved through identifying stable pixels whose scattering properties have little variations with time and look angle. The permanent pixels can potentially enable PsInSAR to provide high precision and high density displacement measurements over long periods of time. The second method, uses all possible SAR image combinations with small temporal and spatial baseline to reduce spatial decorrelation and the effect of residual phase due to uncompensated topography (Lanari et al., 2007; Argam., 2010). In this technique, the singular value decomposition method is applied to link independent SAR acquisition dataset, which is separated by small baselines, and increase the observation temporal sampling rate.
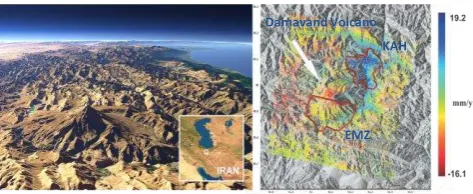
Tehran. because of potential volcanic and landslide hazards around Damavand Volcano. In this paper we focused on 2 landslide targets located in KAH and EMZ shown in Figure 1 and evaluate the effectiveness of our modified method (MSBAS) by comparing the results with those derived from SBAS method implemented in StaMPS (Hooper et al., 2004).
Figure 1: Left: Photo of Damavand Volcano, as viewed from east, Right: Deformation field velocity of Envisat satellite as obtained in descending. The location of the KAHR and EMZ are depicted.
Due the effect of geometric decorrelation on the accuracy of unwrapping process, we used a modified phase filtering with the aim of smoothing each SBAS pairs before unwrapping. However, despite of using modified filter and because of strong geometric decorrelation in rough terrain area, some areas still remained noisy. Therefore, we only selected correlated areas from each SBAS pairs. In this regard, we applied a unique mask for all of the SBAS pairs during 3D unwrapping and used the designed mask in all unwrapping steps to improve the results. We refined the Delauny triangulation and removed edges lying beyond masked areas during time unwrapping. We also applied the same mask for the regularly gridded data that is interpolated from PS pixels during spatial unwrapping.
Due to the sensitivity of interferomatric phase to the digital elevation models (DEMs) errors, especially for ALOS dataset, and because the Nyquist condition for time unwrapping will not be met if there are any spatially uncorrelated terms, the correct detection of the topographic errors in the time-series of interferograms is a critical step. StaMPS software ignores the topographic correction before unwrapping and only detects the topographic errors after unwrapping process. In StaMPS, irregularly sampled PS pixels are unwrapped using 3D unwrapping algorithms. The algorithm unwraps time series pixels in both time and space domain separately. In time domain, the StaMPS algorithm works very well only for well sampled case in which Nyquist assumption is satisfied, but has problem for rough terrain areas where phase is undersampled in time due to topographic, atmospheric and noise effects (or errors). Therefore, we modified StaMPS 3D unwrapping algorithm to overcome these problems. Similar to StaMPS, unwrapping in time domain is the first step in our algorithm. The algorithm defines edges connecting data points using Delaunay triangulation and then calculates edge phase differences. In this way only spatially correlated effects
including atmospheric and orbital errors are removed but there remain several time undersampled areas due to topographic errors that has to be corrected. StaMPS solution for adjusting these areas (time undersampled areas) is to apply the averaging filter in time domain, regardless of the source of error. In our algorithm, in contrast to StaMPS, topographic correction is performed on the measured edge phase differences (difference map). We reduce the phase component correlated with the perpendicular baselines from each phase difference map (due to the possible topographic noise errors) to make the phase difference as small as possible. Our algorithm also could detect the correlation between topography and phase data due to the tropospheric delay, and remove it after unwrapping process. In addition, the possible precise orbit errors were removed by fitting a best plane on four GPS permanent stations available in our study area.
3. Topographic correction method
Let us first consider components constitute interferometric phase. These parameters are the phases introduced by the topographic effect topo, the phase difference due to
deformation between the two acquisitions def, the atmospheric
phase delay atmo, orbit errors orbit, and noise term noise (eq.
1).
j
=
j
def+
j
topo+
j
orb+
j
atm+
j
noise (1)The main objective is to separate phase contributions due to deformation (
j
def) from other terms. Deformation information can be accurately estimated from SAR observation if a true elevation model (DEM) of the area is available. Any factor that limits DEM accuracy whether due to instrument or methods used for topographic measuring and also possible changes in Earth's topography during time series interval could be affect phase unwrapping performance and consequently reduces the derived deformation accuracy. There are linear relationship between the phase shifts caused by DEM error or topographic changes and perpendicular baselines (Samsonov., 2010) (eq. 2).e measured phase shift, since other terms which uncorrelated in time including atmospheric, orbital, thermal noise, and so on have already been removed by differencing between nearby pixels.
The pixels with strong correlation between phase and baselines are found as pixels which include DEM error. To
estimate residual topographic ratio (
4. Results
4.1 Envisat descending results
Figure 2 presents correlation map for ENVISAT descending data There are limited numbers of pixels with high correlation (0.7, 0.8 and 0.9) because of the low sensitivity of the C-band sensors to topographic changes. However, correlation map is able to show significant topographic changes as well. For high correlated pixels, visualization of topographic change, possibly due to landslide, is possible using overlay on Google earth platform. (Fig. 2)
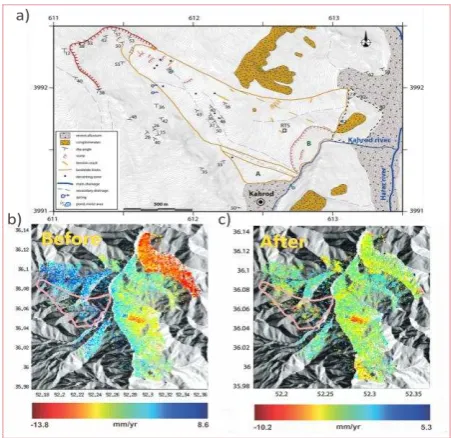
Final velocity map can be seen in figure 3. Pattern of KAHR landslide is obvious in velocity map obtained from our modified method, but did not find any significant pattern in the resulted velocity map from the Stamps software. Unfortunately, there is no time overlap between GPS observations and our SAR measurements and we could not compare the results of topographic, tropospheric and orbit corrections with the GPS measurements to better validate our method.
Figure 2: Correlation map for ENVISAT descending between phase and baselines due to topographic changes. For high correlated pixels (red color), visualization of topographic change due to landslide, is possible using overlay on Google earth platform.In part A, upstream region (near the crest) has negative correlation and the downstream area (close to hillside) has positive correlation due to debris accumulation.
Figure 3: (a) Geomorphologic map of Landslide (Peyret et al., 2008). (b) velocity map calculated by stamps. (c) velocity map calculated by our modified method.Pattern of KAHR (shown in Fig. 1) landslide is obvious in velocity map obtained from our modified method, but do not find any significant pattern in the resulted velocity map from the Stamps software.
4.2 Envisat ascending results
Figure 4 shows velocity map calculated by Envisat ascending data.
Comparison between GPS measurements and Envisat observation, projected on line of sight for ABAL, ABSD and KAHR stations is shown in figure 5.
Figure 5: Comparison between GPS measurements and Envisat ascending observations, projected on line of sight for four stations, by Stamps method (magenta), after atmospheric and orbit correction (green) and after topographic, atmospheric and orbital correction (blue).
4.3 ALOS results
Figures 6 and 7 show the phase difference map of the one pair after and before topographic correction and time series plot of a point after applying topographic correction respectively.
Figure 6. Phase difference map calculated by differencing the phase values between each PS points joint by Delaunay edges before (left) and after (right) correction. It is assumed that all of spatially correlated components have been removed. It can be seen phase difference map was smoothed after this correction.
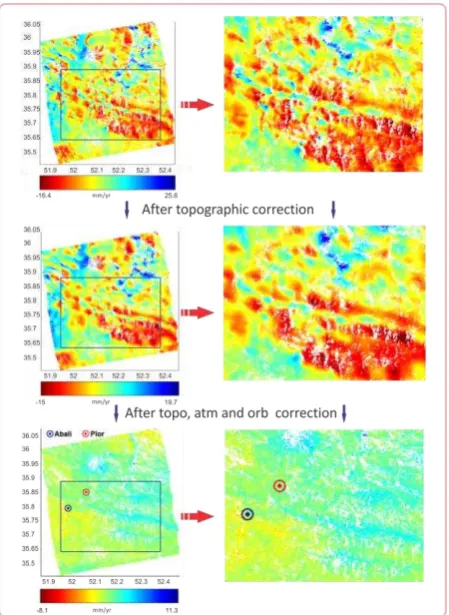
Finally velocity map calculated by our modified algorithm are presented in figure 8 and clearly shows how the topographic signature presented in figure 8a is removed after correction (Fig. 8c).
Figure 7: Left: Phase difference map. Right: Time series plot for a specific location before and after applying topographic correction. It is obvious DEM error in this location high correlation between phase and baseline implies on this matter.
any correction, b) after topographic correction during 3D unwrapping, and c) after topographic, atmospheric and orbit correction. The circles show the location of two GPS permanent stations used in our analysis (see Fig. 9)
5. Conclusion
In this study, we have modified the current time series techniques in order to improve the results quality. We developed an algorithm to modify the Stamps method and to estimate more accurately the slow deformation in the relief (mountainous) areas. In this regards we have enhanced the quality and reliability of the results.
We performed the modified unwrapping on both ALOS and Envisat interferograms. Although the effect of topographic error is less for Envisat images, but still using this algorithm can improve its accuracy. In our method, topographic correction is done during 3D unwrapping process. This is in contrast to the current methods of topographic correction (Samsonov., 2010) in which the DEM error is corrected after the unwrapping process. The results indicate that our algorithm improves the StaMPS method significantly (Fig. 9 and Fig. 5).
6. Acknowledgement
FN was funded by Research Council of Sweden (VR). SAR data was provided by ESA via project AOALO.3598.
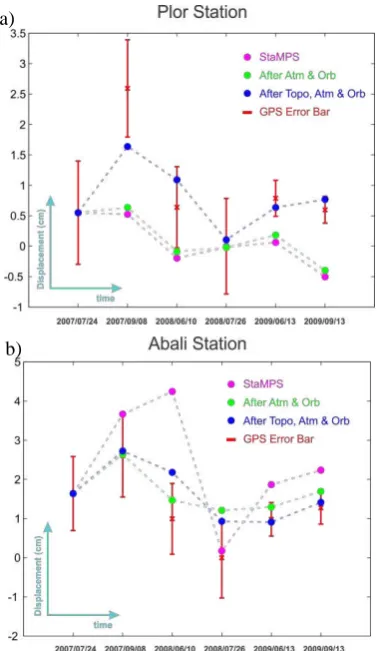
Figure 9: Comparison between GPS measurements and ALOS observation, projected on line of sight for PLOR and ABALI stations, by Stamps method (magenta), after atmospheric and
orbit correction (green) and after topographic, atmospheric and orbital correction.
References
Zebker, H. A., Rosen, P. and S. Hensley (1997), Atmospheric effects in interferometric synthetic aperture radar surface deformation and topographic maps, J. Geophys. Res., Vol. 102, pp. 7547–7563.
Ferretti, A., Prati, C., and F. Rocca (2001) ,Permanent scatterers in SAR interferometry, IEEE Trans. Geosci. Remote Sens., Vol. 39, No. 1, pp. 8 –20.
Hanssen, R.F. (2001), Radar Interferometry: Data interpretation and Error Analysis. Kluwer Academi Publishers, Dordrecht.
Hooper, A., (2008), A multi-temporal InSAR method incorporating both persistent scatterer and small baseline approaches, Geophys. Res. Lett., 35, L16302, doi:10.1029/2008GL034654
Lanari, R., Casu, F., Manzo, M., Lundgren, P. (2007), Application of the SBAS-DInSAR technique to fault creep: a case study of the Hayward fault, California,Remote Sensing of Environment Journal, Vol. 109, 1, pp. 20-28, doi: 10.1016/j.rse.2006.12.003.
Agram, P. S (2010), Persistent Scatterer Interferometry in Natural Terrain, Doctoral thesis, Stanford University.
Hooper, A., H. Zebker, P. Segall, and B. Kampes (2004), A new method for measuring deformation on volcanoes and other natural terrains using InSAR persistent scatterers, Geophys. Res. Lett. , 31 , 23611,doi:10.1029/2004GL021737.
Samsonov, S. (2010), Topographic correction for ALOS PALSAR interferometry, IEEE Trans, Geosci, Remote Sens, Vol, 48, No. 7,pp.3020-3027
Peyret, M., Djamour, Y., Rizza, M., Ritz, J. F., Hurtrez, J. E., Goudarzi, M. A., Nankali, H., Chery, J., Le Dortz, K. and Uri, F., (2008). Monitoring of the large slow Kahrod landslide in Alborz mountain range (Iran) by GPS and SAR interferometry. Engineering Geology, 100 (3-4) :131-141.
a)