GF-7 IMAGING SIMULATION AND DSM ACCURACY ESTIMATE
Yue Qingxing*, TangXinming, Gao Xiaoming
Satellite Surveying and Mapping Application Center, NASG, Beijing, 101300, China – (yueqx, tang, gaoxm)@sasmac.cn
Commission VI, WG VI/4
KEY WORDS: GF-7, Imaging Simulation, WorldView-2, DSM, Accuracy Estimate
ABSTRACT:
GF-7 satellite is a two-line-array stereo imaging satellite for surveying and mapping which will be launched in 2018. Its resolution is about 0.8 meter at subastral point corresponding to a 20km width of cloth, and the viewing angle of its forward and backward cameras are 5 and 26 degrees. This paper proposed the imaging simulation method of GF-7 stereo images. WorldView-2 stereo images were used as basic data for simulation. That is, we didn’t use DSM and DOM as basic data (we call it “ortho-to-stereo” method) but used a “stereo-to-stereo” method, which will be better to reflect the difference of geometry and radiation in different looking angle. The shortage is that geometric error will be caused by two factors, one is different looking angles between basic image and simulated image, another is not very accurate or no ground reference data. We generated DSM by WorldView-2 stereo images. The WorldView-2 DSM was not only used as reference DSM to estimate the accuracy of DSM generated by simulated GF-7 stereo images, but also used as “ground truth” to establish the relationship between WorldView-2 image point and simulated image point. Static MTF was simulated on the instantaneous focal plane “image” by filtering. SNR was simulated in the electronic sense, that is, digital value of WorldView-2 image point was converted to radiation brightness and used as radiation brightness of simulated GF-7 camera. This radiation brightness will be converted to electronic number n according to physical parameters of GF-7 camera. The noise electronic number n1 will be a random number between -√n and √n. The overall electronic number obtained by TDI CCD will
add and converted to digital value of simulated GF-7 image. Sinusoidal curves with different amplitude, frequency and initial phase were used as attitude curves. Geometric installation errors of CCD tiles were also simulated considering the rotation and translation factors. An accuracy estimate was made for DSM generated from simulated images.
1. MANUSCRIPT
GF-7 satellite is a sub-meter two-line-array satellite for 1:10000 surveying and mapping. In the prelaunch phase, we can estimate the accuracy of future data by simulated data. In some stereo satellite data simulation procedure, DEM and DOM were used as basic data. These are two kinds of “ortho-data”, so we call this stereo images simulation method as “ortho-to-stereo” method. The shortcut of this kind of input data is that most feature information does not exist in the DEM. In another word, the texture and geometric information are inconsistent, so that the ground model including DEM and DOM is simplified. The simulated data has only a limited range of applications. As we all know, DSM is one of the most important products of stereo image data. But the simulated stereo data produced by “ ortho-to-stereo” method is too easy to match because there are no complicated geometric distortions and radiation difference between stereo images. So the match result has very high precision which cannot be accomplished using real data. Though a lot of simulation methods were proposed, but very little attention was paid to the accuracy of three-dimensional mapping. To accurately estimate the DSM precision before launch, new basic data should be used in the simulation process of GF-7 satellite. In this paper the very high resolution Worldview-2 stereo images were used as the basic data of simulation process which we called as “stereo-to-stereo” method. We generated DSM by WorldView-2 stereo images. The Worldview-2 DSM was used as reference DSM and “ground truth”. Static MTF, SNR, orbit and attitude data were also simulated. “GF-7 DSM” was generated using simulated stereo images and accuracy parameters like Stdev and NMAD
were counted out and analysed using Worldview-2 DSM as reference data.
2. BASIC DATA AND PROCESS 2.1 BASIC DATA OVERVIEW
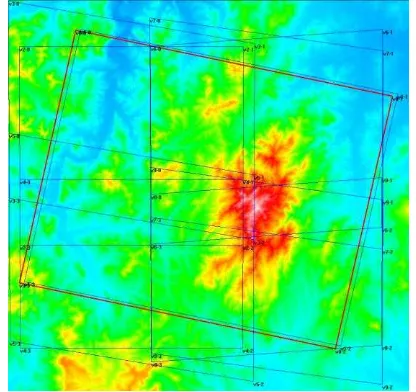
The basic data we used for GF-7 stereo images simulation is Worldview-2 0.5m resolution stereo images which are located in Shandong province of China. As shown in figure 1,
Figure 1. Terrain and zone of Worldview-2 and simulated GF-7 images
The International Archives of the Photogrammetry, Remote Sensing and Spatial Information Sciences, Volume XLII-1/W1, 2017 ISPRS Hannover Workshop: HRIGI 17 – CMRT 17 – ISA 17 – EuroCOW 17, 6–9 June 2017, Hannover, Germany
This contribution has been peer-reviewed.
There are totally 2 orbit scenes with an overlap of about 7 km and the total area is about 25km by 22km. The longitude range is E118.43~E118.71 and the latitude range is N36.10~36.30. The red rectangle is ground zone of simulated GF-7 forward image. Only very small areas are outside stereo zone of Worldvew-2. A rough DSM was superimposed in the figure to show the terrain. The terrain belongs to the hilly area with an elevation range from 150m to 1050m (ellipsoid height). Many areas have trees covered and others are mostly terraced fields. There are almost none tall building but mostly cottage villages. There are also some reservoirs with large dams.
2.2 BASIC DATA PROCESS
As Worldview-2 have very high resolution, geometric accuracy and good clarity, it’s very suitable to be used as basic data for GF-7 simulation. But firstly, we should eliminate the small residual relative deviation of orientation parameters between stereo images and images in different orbits. Some tie points were matched and RPCs of Worldview-2 images were adjusted by adjustment of free network. A 1m grid DSM was generated by a modified belief propagation method. The DSM will not only be used as “ground truth” to estimate the accuracy of DSM generated by simulated GF-7 stereo images, but also be used as medium to generate correspondence between simulated GF-7 image points and Worldview-2 image points.
2.3 In-pupil Radiance Calculation
Suppose the in-pupil radiance of simulated GF-7 is the same as in-pupil radiance of Worldview-2 in the same direction or come from the same object point. For every looking ray of GF-7, an object point was obtained using orientation parameters and Worldview-2 DSM. This point was projected onto Worldview-2 images and the DN of the projected point will be converted to radiance value L using a simple function as following,
DN related to image clarity and affected by many factors each. The MTF simulation in this paper mainly considered static MTF and SNR simulation mainly considered noise subject to CCD electronic characteristics.
3.1 Orbit Data Generation
This paper used a simplified method to generate orbit data. The procedure is as following. Firstly, we put a series of satellite centers onto XOZ plane of inertial coordinate system. The distance between every satellite center and earth center is R, which is earth radius plus orbit height. Suppose time of the first satellite center is 0 and time offset of every two neighbouring centers is 1 min. The track period T is obtained across R. Earth center angle between every 2 centers is
,
360/T. As (I-90). Then rotate (X, Y, Z) around Z by L which is longitude of target area center.For the i th time, rotate (X, Y, Z) around Z by (iL), where L
=0.25 degree.
Get relationship between longitude and latitude, bring longitude of target area center L into the relationship, there will be a small difference L' between L and computed L. Plus L' to L and
Figure 2. Obit data generation illustration 3.2 Attitude Data Generation
Attitude movement include high frequency and low frequency components. Low frequency is called attitude drift ranging in 0.1 to 5 Hz and high frequency is called attitude flutter ranging in 5 to 100 Hz. We suppose low and high frequency attitude follow the sine rule change. The high frequency attitude has small amplitude and low frequency attitude has big amplitude. In GF-7 simulation procedure, the low frequency is 1Hz and high frequency is 10 Hz, the corresponding amplitude is 0.001 degree and 0.0002 degree.
3.3 Static MTF Simulation
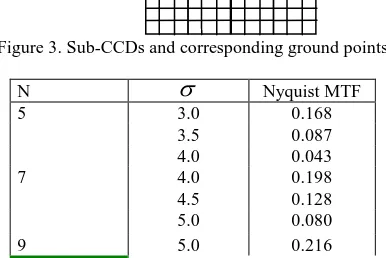
Static MTF is implemented by filtering the “continuous” focal plane image using a Gaussian template. And make an average of sub pixel energy in a CCD plane. In this paper, we combine the two filters into one so as to calculate fast. For quantitative simulation of MTF, the main variable is parameter sigma for calculate filter matrix and discrete multiple N of one CCD to sub-CCD (which means divide one CCD into N
N sub-CCDs, which is shown in figure 3). We firstly calculate some typical parameter pairs of N,
and MTF at Nyquist frequency. Specific Nyquist MTF in simulation procedure will be calculated by interpolation.Figure 3. Sub-CCDs and corresponding ground points
N
Nyquist MTFThe International Archives of the Photogrammetry, Remote Sensing and Spatial Information Sciences, Volume XLII-1/W1, 2017 ISPRS Hannover Workshop: HRIGI 17 – CMRT 17 – ISA 17 – EuroCOW 17, 6–9 June 2017, Hannover, Germany
This contribution has been peer-reviewed.
5.5 0.156
6.0 0.110
Table 1. Relationship of N,
and Nyquist MTF3.4 SNR Simulation and TDI CCD Integration
The system SNR has two definitions, SNR=S/N, or SNR=20log(S/N). And SNR is not invariant but will change with different radiation. For CCD, graupel noise is the main noise resource and cannot be decreased. The argument of graupel noise is direct ratio to square of signal. For TDI CCD, assume the integration stage is M. The signal will increase by M, and the noise will increase by√M. So the SNR will increase by
√M. The average in-pupil radiance of every CCD is converted to radioactivity on CCD plane and then converted to electronic number n. The noise electronic number n1 will be a random
number between -√n and √n.
TDI CCD camera imaging simulation include 3 important procedures: Get the “continuous” focal plane irradiance “image”, Integration of time and multistage CCD and Radiation response.
The focal plane irradiate is a continuous energy field. Include “continuous” of space and spectrum. We used differentiation method to resolve this problem. By dividing CCD plane into some sub-CCDs and dividing the imaging band into sub-bands. Compared with the CCD plane and total band width, the divided sub-CCD “image” and sub-band spectrum can be thought as “continuous”. What should be pointed out is that the sub-energy is getting by ray-tracing of “main ray” which cross in-pupil and main point (neglect the distance between two main points), the filtering effect is ignored. So we filter the focal plane image by static PSF, and average the energy in a CCD plane. And the filtered “image” is a static energy image or instantaneous energy image.
Now we just get an instantaneous energy image. In order to get the average energy in multistage dynamic integration, we submit the integration time zone into some sub-times. Get instantaneous energy of every stage, and average these energies to get the mean energy in an integration time zone. Then average energies of the same object(because of factors such as attitude vibration, mismatch between image moving velocity and electric transfer velocity, bias angle error and the like, the multistage CCD will not corresponding the same object zone strictly, this is the main resource of dynamic MTF.
Figure 4. TDI CCD integration 4. ACCURACY EVALUATION
Quality of DSM is affected by geometric and radiometric factors, so it’s convincing to assessment the simulated images quality by DSM accuracy assessment.
4.1 DSM Generation of Simulated GF-7 Images
The simulate orbit data, attitude data, and camera geometric parameters were used to generate RPC of simulated image. 4 GCPs were selected on Worldview-2 images and projected onto Worldview-2 DSM to get ground coordinates. RPCs of simulated GF-7 stereo images are adjusted using affine
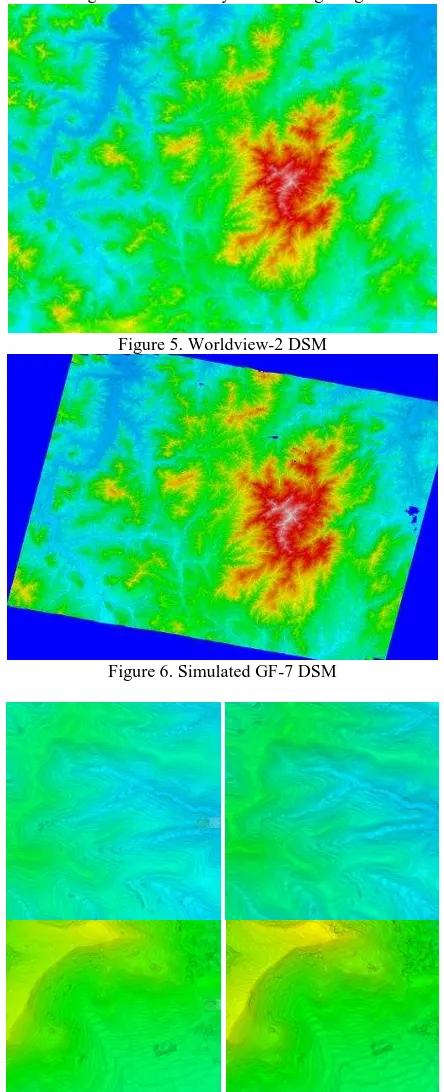
transformation. Then epipolar images are generated using projection trajectory method. Lastly, a modified belief propagation matching method was used for dense matching to generate DSM of simulated GF-7 images. CENSUS is used to calculate matching cost. The reciprocal of the distance interpolation method was used to generate DSM with regular grid distance. The generated Worldview-2 DSM is shown in figure 5 and GF-7 DSM is shown in figure 6, and local contrast is shown in figure 7 with the way of rendering image.
Figure 5. Worldview-2 DSM
Figure 6. Simulated GF-7 DSM
Figure 7. Details comparison between shaded Wordview-2 DSM (left) and simulated GF-7 DSM (right)
Time1 Corresponding radiation distribution
Orbit direction
Time2
The International Archives of the Photogrammetry, Remote Sensing and Spatial Information Sciences, Volume XLII-1/W1, 2017 ISPRS Hannover Workshop: HRIGI 17 – CMRT 17 – ISA 17 – EuroCOW 17, 6–9 June 2017, Hannover, Germany
This contribution has been peer-reviewed.
4.2 Evaluation Index
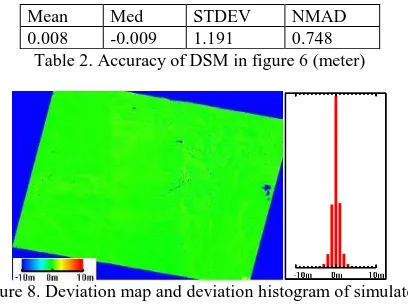
After generation of DSM, Mean deviation (Mean), Median deviation (Med), Standard deviation (Stdev) and normalized median absolute deviation (NMAD) were used as the statistical index to assess the accuracy of DSM quantitatively. Two kinds of graphic methods which were error histogram and error pseudo-colour graph were used to assess the accuracy of DSM qualitatively.
Mean Med STDEV NMAD
0.008 -0.009 1.191 0.748 Table 2. Accuracy of DSM in figure 6 (meter)
Figure 8. Deviation map and deviation histogram of simulated GF-7 DSM
REFERENCES
Zhi Wan, Jianwei Ren, 2008. Analysis of signal-to-noise ratio for remote sensing TDI CCD camera based on radiative transfer model. Infrared and Laser Engineering, pp. 497-500.
Christian P. Robert, George Casella, 2009. Monte Carlo Statistical Methods. Springer. Beijing, pp. 35–94.
Kajiya, 1982. The rendering equation. Computer Graphics, pp.143-150.
Veach, 1995. Optimally combining sampling techniques for Monte Carlo rendering. SIGGRAPH 95 Proceedings, pp. 419– 428.
Murali Subbarao, Mingchin Lu, 1994. Image-sensing model and computer simulation for CCD camera systems. Madhine and Applications, pp. 277-289.
Luis Guanter, Karl Segl and Hermann Kaufmann, 2009. Simulation of Optical Remote-Sensing Scenes with Application to the EnMAP Hyperspectral Mission. IEEE TRANSACTIONS ON GEOSCIENCE AND REMOTE SENSING, pp. 2340-2351.
Hirschmüller H, 2005. Accurate and Efficient Stereo Processing by Semi-global Matching and Mutual Information. IEEE Conference on Computer Vision and Patten Recognition, pp. 807-814.
The International Archives of the Photogrammetry, Remote Sensing and Spatial Information Sciences, Volume XLII-1/W1, 2017 ISPRS Hannover Workshop: HRIGI 17 – CMRT 17 – ISA 17 – EuroCOW 17, 6–9 June 2017, Hannover, Germany
This contribution has been peer-reviewed.