POINT CLOUD VISUALIZATION IN AN OPEN SOURCE 3D GLOB3
M. De La Calle a, , D. Gómez-Deck a, O. Koehler a, F. Pulido a
a IGO SOFTWARE, I+D Department - (mdelacalle, dgd, okoehler, fpulido)@igosoftware.es
KEY WORDS: Glob3, Point Clouds, Level of Detail, GIS 3D, Point cloud visualization, Euclid
ABSTRACT:
During the last years the usage of 3D applications in GIS is becoming more popular. Since the appearance of Google Earth, users are familiarized with 3D environments. On the other hand, nowadays computers with 3D acceleration are common, broadband access is widespread and the public information that can be used in GIS clients that are able to use data from the Internet is constantly increasing. There are currently several libraries suitable for this kind of applications.
Based on these facts, and using libraries that are already developed and connected to our own developments, we are working on the implementation of a real 3D GIS with analysis capabilities.
Since a 3D GIS such as this can be very interesting for tasks like LiDAR or Laser Scanner point clouds rendering and analysis, special attention is given to get an optimal handling of very large data sets. Glob3 will be a multidimensional GIS in which 3D point clouds could be explored and analysed, even if they are consist of several million points.
The latest addition to our visualization libraries is the development of a points cloud server that works regardless of the cloud's size. The server receives and processes petitions from a 3d client (for example glob3, but could be any other, such as one based on WebGL) and delivers the data in the form of pre-processed tiles, depending on the required level of detail.
1 . INTRODUCTION
One of the next steps in computing should be the widespread of the 3D usage for all the applications that let it happen. The GIS world is not so far from it. What began with the using of 3D globes, where 2D data was represented, should evolve to GIS that can be able to represent and analyse 3D data.
Our plans for the future include the developing of generic libraries used for 3D geometry handle and also the viewing in GIS products such as Nasa World Wind. It is also important the multiple variables display in a multidimensional way, so it makes possible to see the behaviour of several components over the time. This kind of displays are indispensable for scientific studies, mainly in climate or oceanography fields.
Moreover, the point clouds displaying is still a free software pending issue. The problem generated by the data set size, makes really complex it management. IGO SOFTWARE has worked in a very high way in the processing and displaying of this kind of clouds, at the moment we have some libraries that are able to display and serve on-line clouds points regardless of its size and also georeferenciated over a 3D globe. This kind of displays allows us to see the clouds points in its context. For example, it is possible to find scanned buildings next to a city 3D model, panoramic pictures and also some other points clouds, even if it is a terrestrial scanner laser, or LIDAR.
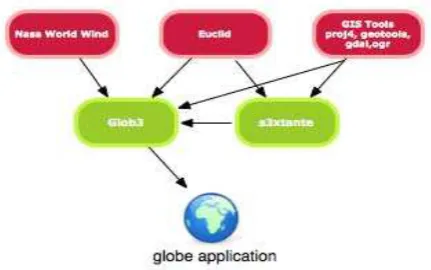
2 . THE GLOB3 ARCHITECTURE
GLOB3 (http://www.glob3.org) is an open source project lead by IGO SOFTWARE and sponsored by CDTI (Centro para el Desarrollo Tecnológico Industrial, Spain), IGO SOFTWARE and some other companies and institutions. Several tools for analysis and visualization of multidimensional data on a 3d-globe have already been developed within this project.
2.1 Euclid
Is a multidimensional and multi-precision framework used to handle geometries. It means that we can work with it regardless of the dimensions in which we have 2D and 3D data, and accuracy. Euclid manages everything so that the calculations are always right.
There have been many developing of optimizations that allow us to build an octGrid with 127 millions of coloured points. Such optimizations were made in two ways:
◦ Optimize memory usage. Appropriate use of the Java classes (Buffer Classes).
◦ Multi-core architecture exploitation of the last generation, using the multithreading programming capabilities of Java.
Figure 1 Glob3 Architecture
An example of how Euclid works are the kinds of generalization of a n-dimensional ball, this would be the class n-Ball, it's specialization to 2D, would be Disk and the 3D specialization would be Ball
A method that would work in the n-dimensions could be:
public double distanceToBoundary(final
This method would return for any dimension the edge distance. There are many examples of algorithms or operations that can be multidimensional, Euclid allow us to work with one or another.
2.2 S3xtante
Sextante (In Spanish means Extremadura territorial analysis system, http://sextantegis.blogspot.com/).
Euclid's first application was to make the Sextante algorithms to work in n-dimensions. Making small changes in the algorithms, just implementing Euclid and working with operations of our geometries framework, these can be used even in 3D without any special kind of change.
It is possible to find an example of it in the classic buffer or influence zone. If we take, for example, a lineal segment (one line with just two nodes, one at the beginning, and the other at the end), the calculated buffer for a given distance, would be a rectangle with the same length that the segment and twice the influence distance. Taking this concept to 3D, the result obtained would be a cylinder which radius is the same than the distance and segment height. However it can be extended to another more complex figures, always obtaining a new tridimensional figure.
When an algorithm is not multidimensional, Euclid is not enough to solve that new task. It happens for example with the interpolation algorithms, that instead of generate raster layers (2D), have to generate raster volumes (pixel replaced by voxels). Euclid solves the data entry, because these are vectorial, but the results, that aren’t vectorial, can´t be managed in the same way. The interpolation algorithm is not implemented in the library, so it, also, has to be modified.
1.1 A 3D GIS Framework
The 3D GIS applications that are going to be programmed can be very different, but basically it can be like this:
• GeoTools→ GIS data access • Proj4→ Management projections • Euclid→ Geometries
• S3xtante→ Analysis
• Nasa World Wind and Glob3→ Display
According to the requirements, it be included more elements to the architecture, but this five libraries are often the least common among them.
The displayer (Nasa World Wind) has some features that make it an indispensable tool:
• Local cache usage. Greatly accelerates the user experience, and also the applications can be distributed with its cache, so everything goes really fast.
• Easy to implement an applet.
It also has an inconvenience, because of the use of an old version of JOGL that it is no longer used, also this project was abandoned by SUN and it's API has changed dramatically in the openGL development.
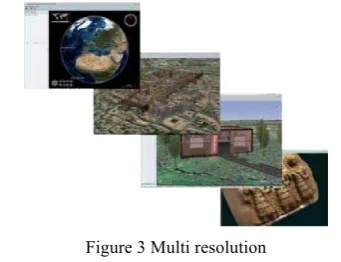
The 3D globes are a tool that transmits a large amount of data to different resolutions; it is possible to work from a terrestrial level work to local levels, in the example applications of this communication will be possible to see how it is used.
2. THE POINTS CLOUD PREPROCESS AND VISUALIZATION (depending on available hardware and optimizations used, our tests concluded that the amount of concurrently displayable points using OpenGL is in the range of a few million).
Therefore the first challenge that arises is finding a way to efficiently visualize such huge amounts of data. One way to solve this problem is to employ LOD-techniques (level of detail), thus rendering only carefully chosen subsets of the data (taking into consideration camera distance and screen resolution). Since this selection process is executed every frame, it has to be as efficient as possible, because its performance directly influences overall rendering speed.
Now the question is how to select a small representative subset of points that minimizes the amount of data, while at the same time resembling as closely as possible the original “shape”
Figure 3 Multi resolution Figure 2 Euclid
(technically a points cloud doesn't have a shape, since it does not contain any structural information), thus maximizing the “amount of information” that it contains.
Another aspect to keep in mind is that points clouds can differ greatly from one another, in their general shape as well as in their geographical extension:
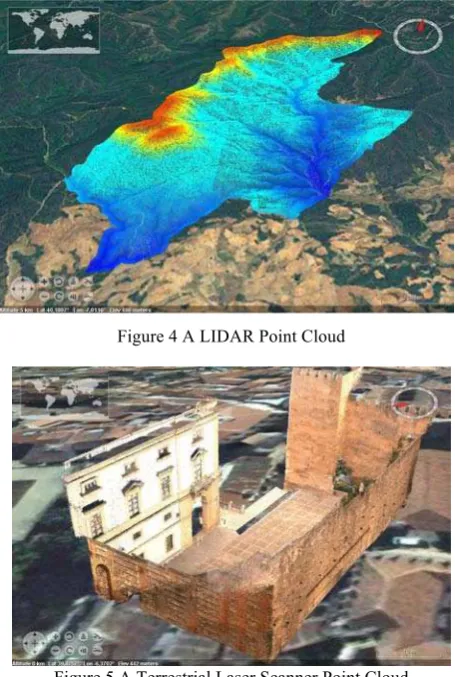
− A typical LIDAR cloud normally covers a large area, thus showing a great range of values in two of its three dimensions. The range of values in the third “vertical” dimension is usually rather small in comparison to the other two, effectively making the data “2.5D”. This characteristic of LIDAR clouds has permitted employing 2D visualization techniques in the past (for example the tiling in terrain rendering).
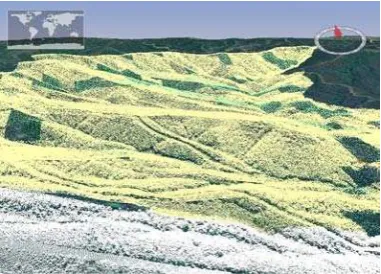
− A points cloud as obtained from a laser scan, say, the scan of a building, generally has its data more evenly distributed along its three axes, and usually occupies a much smaller (real-world) space. Therefore the techniques for LiDAR visualization that rely on its aforementioned characteristics can simply not be applied to points clouds obtained from a laser scanner, since the data is “truly” 3D.
Figure 4 A LIDAR Point Cloud
Figure 5 A Terrestrial Laser Scanner Point Cloud
The Algorithm we used consists, basically, of two parts:
1. Partitioning of the points cloud into smaller parts that are easier to process. This process has to consider different constraints such as geographic extension, number of points, general shape of the points cloud, etc.
2. Reorganizing the order of the points of each part in such a way that the most significant points for a given LOD can be found as efficiently as possible.
2.1 Points Cloud Partitioning:
The first part consists in generating an Octree, using all the points contained in the cloud. In order to avoid visualization artefacts (mostly where different parts meet), the Octree has to be as balanced and regular as possible. At this point we run into the first problem: with points clouds of the first type (LiDAR clouds) that are basically 2.5D, the octree generation might subdivide the data in its (virtually inexistent) vertical dimension, which in turn creates a lot of visual artefacts. We therefore implemented an “adaptive” octree that only divides in the vertical dimension when its delta value is considered significant in relation two the other two dimensions. Therefore, in the case of a very “flat” points cloud (as is often the case in LiDAR data), it behaves basically like a Quadtree.
2.2 Points Cloud Data Organization:
For the ordering of the points, we make somewhat unorthodox use of a KDTree. The basic idea is that the creation process of a tree structure, if done correctly, can supply us with valuable information about the data it contains.
The KDTree divides the space in only one dimension, at every level of the tree. More precisely, we always divide the axis that shows the greatest extent, and we do so at every level of the tree. Using the aforementioned idea during tree traversal, we know which dimension of the data following any given inner node is the greatest. Taking this idea to an extreme, we know that the point chosen for any inner node must be the best approximation for all the data below it (in the tree).
With a breadth-first traversal of the tree, we then obtain the points in order from most to least significant.
Given this ordering, the visualization algorithm only has to:
• Calculate how many points are needed to adequately represent a tile
• Read this number of points.
The ordering created with the aforementioned method guarantees that the most read points are the ones the best approximate the general shape of the cloud.
Figure 6 LOD Selection of a few points International Archives of the Photogrammetry, Remote Sensing and Spatial Information Sciences, Volume XXXVIII-5/W16, 2011
Figure 7 LOD Selection of many points
As these examples clearly, even when the LOD algorithm selects only few points for visualization, the general appearance of the points cloud is always maintained.
2.3 Visualization of the LOD-Rendering performance.
The rendering algorithm has a “debug” mode that allows to observe the rendering process in real time.
Figure 8 Color Code
To do so, a color code is used:
• White: the visualized data represents 100% of the available data (highest level of detail). This means that no new data will appear when the camera closes in.
• Yellow: The points drawn represent 100% of the data that the LOD algorithm has deemed adequate for this region. If we move the camera closer, more points will be loaded (until eventually painting in white)
• Green: The area is currently drawn with less detail than has been calculated, because the full data is not available yet due to pending IO operations (reading from disc or a streaming server)
3. THE POINTS CLOUD SERVER
Thanks to the ordering obtained from the partitioning and organization processes on the points cloud, the streaming process is greatly simplified. The operation “calculate which points should be contained in a tile at this LOD” simplifies to “give me the first N points in the list”.
This characteristic is very desirable for a streaming server, because it guarantees that the available points always give a good representation of the general shape of the points cloud, even if only a fraction of the desired points have been downloaded (for example, when available bandwidth is low). Therefore the user is always shown the best possible representation, and the quality only becomes better as more data is loaded from the server.
The server uses the pre-processed data from the partitioning/ordering step. Data is pre-calculated in order to improve response time. Information is transmitted from the server in a binary format that is very efficient in terms of transmitted data volume. Every point sent consists of 4 FLOATS, and if it has colour, another Integer is added. Furthermore, the data packages are compressed with the gzip algorithm.
Communication between client and server is established using the dMVC framework that supplies RCP functionality (remote procedure call), sending of events from server to client, asynchronous calls, distributed garbage collector, etc. All the client-server communication is made using a TCP socket, opened from the client side. This assures, that the dMVC server can be used through firewalls, NATS, etc.
4. USING GLOB3
4.1 PVDC
Virtual Platform for the science diffusion of the “Vicepresidencia Segunda y Consejería de Economía, Comercio e Innovación”. It is an application where a virtual museum was implemented, and was developed over a 3D globe. It is possible to access to different educational units from the museum, that were implemented in Squeak.
It was made an extensive use of the tool multiresolution capabilities and it is also used an implementation of the model distributed and implemented in Java, that allows us to get a real-time collaborative globe
4.2 3D Beaches
Typical application that shows users data, allows to move over Andalucía and displays the bathing beaches profiles from this Community. It also counts with a beaches searching tool, and is
a very simple application Figure 9 PVDC
Figure 10 Beaches of Andalucía
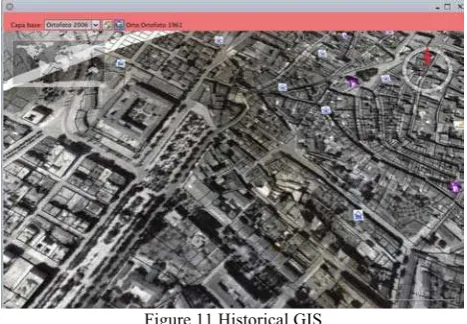
4.3 Historical GIS
This is a quite simple development, with a special interest, because introduces temporal variable in GIS in the local information management
Figure 11 Historical GIS
4.4 LiDAR and Point Cloud Viewer
In the Open Source environment there are no LIDAR viewer in 3D with points clouds. This viewer allows us to see these clouds, design tools that can be used to work with the clouds and also display them in real-time. This viewer is totally experimental and many optimizations have been used, because of the weight of the LIDAR data.
Techniques such as LOD (Level of Detail) are used, and the visualization capabilities of Nasa World Wind and JOGL are taken to the edge.
4.5 Multidimensional Data Visualization
It is an application that was developed to demonstrate the multivariate and multidimensional rendering capabilities. Oceanographic data saved in NetCDF format were used, and there were also inserted some datasets. It is possible to see the variables (salinity, temperature, current velocity) changes according to the time, depth and surface.
Figure 12 A mulidimensioal data viewer
5. CONCLUSIONS
We believe that the 3D use is specially suited for many activities of the GIS today users. As seen in this communication, within the Open Source panorama there are enough tools to build an architecture that allows us to make GIS customized applications. Moreover, even these libraries exists, we saw that when we wanted to develop analysis tools, we didn't have all we needed, that's why we had to implement libraries for it.
In the other hand, the viewing of huge point clouds in a 3D efficient way is going to let us expand the usage of tools such as Scanner Laser (terrestrial or aerial), instead of centralize the pre-processed pint clouds in a server from client machines, it will be possible work with these point clouds that are very hard to conduct, manage and analyse. Our point cloud server relocates the pre-process to the server. This whole process involves a great saving in hardware and ensures a better spread of this huge data sources.
6. REFERENCES
D.Gómez-Deck, V.Olaya, M. De la Calle Alonso. S3xtant-Glob3. Foss4G 2011 Barcelona
M. De la Calle Alonso,D. Gómez-Deck, J. Giménez Fernández, V. Olaya Ferrero, I.Varela García, A. Blanco Santos y Á. Martínez Roa. Inventario Forestal Mediante Láser Escaner (Tree 3d). II Jornadas SASIG Evora 2009
M. de la Calle Alonso, V. Olaya Ferrero Desarrollo personalizado de aplicaciones SIG 3D. IV Jornadas de SIG LIBRE Girona 2010
A.Blanco, Manuel DE LA CALLE_Author, Diego GÓMEZ-DECK_Author, Juan Carlos GIMÉNEZ FERNÁNDEZ_Author, Antonio BLANCO_Author. TREE3D. A COMPLETED
SOUTION FOR FOREST INVENTORY USING
TERRESTRIAL LASER SCANNER. Forestat 2010. Lugo
M. Christen S. Nebiker. Large Scale Constraint Delaunay Triangulation for Virtual Globe Rendering. Advances in 3D Geo-Information Sciencies.
Glob3 Web Page. http://www.glob3.org
Nasa World Wind http://worldwind.arc.nasa.gov/java/ International Archives of the Photogrammetry, Remote Sensing and Spatial Information Sciences, Volume XXXVIII-5/W16, 2011