MONITORING OF LAND SUBSIDENCE IN RAVENNA MUNICIPALITY USING
INTEGRATED SAR - GPS TECHNIQUES: DESCRIPTION AND FIRST RESULTS
G. Artesea, S. Fiaschib, D. Di Martirec, S. Tessitorec, M. Fabrisd, V. Achillid, A. Ahmedc, S. Borgstrome, D. Calcaterrac, M. Ramondinif, S. Arteseg, M. Florisb, A. Menind, M. Monegod, V. Siniscalchie
a
Civil Engineering Dept., University of Calabria, Rende, Italy - [email protected] b
Dept. of Geosciences, University of Padua, Padua, Italy - [email protected], [email protected] cDept. of Earth, Environment and Resources Sciences, Federico II University of Naples, Naples, Italy - (ahmed.ahmed,
domenico.calcaterra, diego.dimartire, serena.tessitore)@unina.it d
Dept. of Civil, Environmental and Architectural Engineering, University of Padua, Padua, Italy - (massimo.fabris, vladimiro.achilli)@unipd.it
e
INGV, Osservatorio Vesuviano, Naples, Italy - (sven.borgstrom, valeria.siniscalchi)@ov.ingv.it f
Dept. of Civil, Architectural and Environmental Engineering, Federico II University of Naples, Naples, Italy [email protected]
g
Dept. of Informatic, Modeling, Electronic and System Engineering, University of Calabria, Rende, Italy - [email protected]
Commission VII, WG VII/2
KEY WORDS:Ravenna, Land Subsidence, GPS, DInSAR, Staring Spotlight, Sentinel-1
ABSTRACT:
The Emilia Romagna Region (N-E Italy) and in particular the Adriatic Sea coastline of Ravenna, is affected by a noticeable subsidence that started in the 1950s, when the exploitation of on and off-shore methane reservoirs began, along with the pumping of groundwater for industrial uses. In such area the current subsidence rate, even if lower than in the past, reaches the -2 cm/y. Over the years, local Authorities have monitored this phenomenon with different techniques: spirit levelling, GPS surveys and, more recently, Differential Interferometric Synthetic Aperture Radar (DInSAR) techniques, confirming the critical situation of land subsidence risk. In this work, we present the comparison between the results obtained with DInSAR and GPS techniques applied to the study of the land subsidence in the Ravenna territory. With regard to the DInSAR, the Small Baseline Subset (SBAS) and the Coherent Pixel Technique (CPT) techniques have been used. Different SAR datasets have been exploited: ERS-1/2, ENVISAT, TerraSAR-X and Sentinel-1. Some GPS campaigns have been also carried out in a subsidence prone area. 3D vertices have been selected very close to existing persistent scatterers in order to link the GPS measurement results to the SAR ones. GPS data were processed into the International reference system and the comparisons between the coordinates, for the first 6 months of the monitoring, provided results with the same trend of the DInSAR data, even if inside the precision of the method.
1. INTRODUCTION
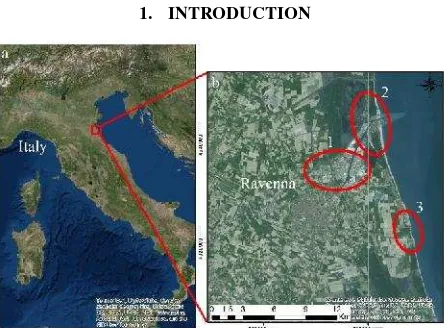
Figure 1. a) location of the study area b) the City of Ravenna and the main areas affected by subsidence
The city of Ravenna is located in the Emilia Romagna region, N-E of Italy (Fig. 1a). With its 652.89 km2 Ravenna is the second one per extension among the Municipalities of Italy. The City is a very important touristic destination and a site of great historical and cultural importance since, among the other attractions, it is the location of eight UNESCO World Heritage Sites. Over the last century, the entire Emilia Romagna region has been affected by a land subsidence that has natural and
anthropogenic origin (Teatini, 2005). The main cause of this subsidence is the heavy exploitation of water and gas reservoirs that started in the 1940s and gradually reduced around the 1980s (Gambolati, 1999). Today, the human-caused subsidence ratio even if lower than in the past is still much higher than the natural one. The most affected areas (Fig. 1b) are located in the Ravenna’s industrial area (1), near Porto Corsini (2) and along the southern coastline (3), in particular at Lido Adriano and Lido di Dante: here the combined effect of subsidence and sea level rise is producing heavy damage to the coastline and every few years the Municipality tries to fix the problem replenishing the beach and placing new artificial marine barriers. The maximum subsidence rates reach -30 mm/y in the industrial area and -20 mm/y along the coastline. This, in combination with the raise of the sea level, increases the hydraulic risk of the coastal areas (Carbognin, 2002).
2. METHODS
2.1 DInSAR
both urbanized and vegetated territories, comparing the displacement time-series of several selected reference points distributed in the entire study area. The first technique is the Small Baseline Subset (SBAS), based on the algorithm of Berardino et al. (2002) and applied using the SARscape© software. This technique relies on the combination of differential interferograms created from stacks of SAR image pairs that have small temporal and perpendicular baselines. Thanks to the application of several interferograms for every single image, it is possible to obtain high spatial coherence, high data density and more effective error reduction. This allows us to obtain mean velocity maps with good data density even over non-urbanized territories. The second technique is the Coherent Pixel Technique (CPT) (Mora et al., 2003) exploited using the SUBsoft© software. CPT is able to extract from a stack of differential interferograms the deformation evolution over wide areas during large time spans. The processing scheme is composed of three main steps: a) the generation of the best interferogram set among all the available images of the area of interest; b) the selection of the pixels with reliable phase within the employed interferograms and, c) their phase analysis to calculate, as the main result, their deformation time series within the observation period.
2.2 GPS
GPS campaigns have been carried out in an area affected by subsidence close to the industrial area of Ravenna. We selected and materialized twelve 3D vertices distributed over an area of about 3X5 km. The GPS points were selected very close to existing persistent scatterers (namely, buildings) in order to link the GPS measurement results to the DInSAR ones. Four campaigns were performed starting from May 2015 using double-frequency Leica GPS Systems 1200, in static mode at a sampling rate of 15 s and minimum acquisition time of 30 min (elevation mask 15°). The benchmarks were chosen taking into account also the areas that permit nearly ideal conditions (e.g., unobstructed horizon view, avoidance of multipath effect). The data were processed using Leica Geo Office software in the International Terrestrial Reference Frame using data from permanent stations of Medicina, Porto Garibaldi (EUREF Stations) and Ravenna (MEDI, GARI, RAVE).
3. SAR DATA
The work done for monitoring the subsidence affecting Ravenna can be divided in two parts: the first one is the large scale study of the whole area of about 20 x 20 km. The second one refers to the detailed study of the area within the footprint of the TerraSAR-X Staring Spotlight data (Fig. 2). This area covers both urbanized and vegetated territory and is where the GPS campaign are carried out. For the entire study area different SAR datasets covering the period 1992-2014 are available (Table 1). All the datasets are processed using the SBAS technique, whereas only TerraSAR-X data are processed with the CPT code focusing the attention on one small area that covers the industrial area (Fig. 4). This allowed the time-series comparisons reported in Chapter 4. For the area where the GPS campaigns were carried out, two more TerraSAR-X datasets are available: SpotLight (SL, resolution of about 2 m) and Staring Mode (ST, resolution of about 0,5 m) acquisitions. The last dataset available is made of 30 Sentinel-1 images (Period 2014-2016). These data have a ground resolution of 20m and a revisiting time of 12 days, making them suitable for continuous monitoring not only of very large portion of territory (full frame
of 250 x 200 km) but even for small areas affected by subsidence like in this case.
Table 1. SAR datasets available and their main features
Figure 2. In the green square, the main study area. In purple and yellow, the footprints of the TerraSAR-X SL and ST. The green
dots are the location of the GPS 3D vertices.
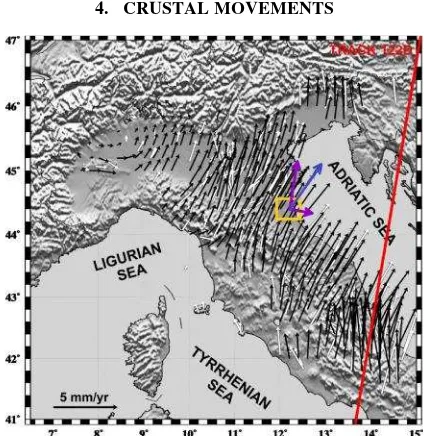
4. CRUSTAL MOVEMENTS
The study area is also affected by the crustal movement of the Eurasian Plate, which is well known in literature. Figure 3, shows the velocity field of the crustal movement in the northern Italy (from Baldi et al., 2009).
Stat.
MEDI E 710,345.504 0,024 0,018 0,018 0,024 0,019 0,022 N 4,933,033.896 0,017 0,021 0,019 0,018 0,018 0,018 h 50.019 -0,001 0,002 -0,002 -0,004 0,001 -0,001
2D D 0,029 0,028 0,026 0,029 0,026 0,028
GARI E 757,542.269 0,020 0,022 0,021 0,023 0,019 0,023 N 4,952,197.018 0,018 0,020 0,018 0,018 0,017 0,017 h 47.732 -0,002 -0,002 -0,005 -0,003 0,002 -0,003
2D D 0,027 0,029 0,028 0,029 0,026 0,028
Table 2. Coordinate differences for Medicina and Porto Garibaldi Stations, 2009-2015, ITRF08 Datum.
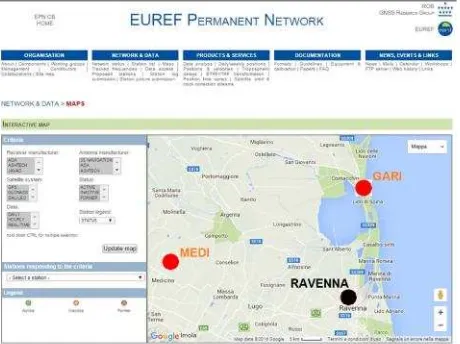
The data of the EUREF permanent GNSS Network can be used to precisely calculate the components of the crustal movements in the study area. The GPS permanent stations closest to Ravenna (Figure 4) are sited in Medicina (MEDI, 40 km away) and Porto Garibaldi (GARI, 20 km away). With reference to the ITRF08 Datum and considering the period 2009-2015, these stations show both a mean planimetric velocity of 28 mm/year, with a North component of 18 mm/year and an East component of 21 mm/year. Thus, we can take into account these values for our area of interest. The measurements of the two considered GPS permanent stations are reported in Table 2.
Figure 4. The EUREF GPS permanent stations in Medicina and Porto Garibaldi.
In Figure 3, the red line is an example of direction of a SAR satellite with descending orbit (in this case, ENVISAT, Track 122), the blue line is the mean planimetric displacement of the monitored zone and the purple lines are the components parallel and orthogonal to the satellite Track. Figure 5, shows the case of a permanent scatterer (house) subject to both vertical and horizontal displacements. Blue lines are the Lines of Sight of the satellite (LOS),β is the angle between the vertical and the LOS,is its complementary angle. The movement detected by the SAR measurements is . If we neglect the horizontal displacement, we deduce a subsidence equal to/senα.Taking
into account the known horizontal displacementd, we must add another vertical movement, given bybtanβ.
Figure 5. The effects of a 3D displacement on the SAR measurements.
This procedure has been set up to integrate the data obtained by geometric leveling and SAR. It should be applied to integrate GPS and SAR measurements, in order to obtain more accurate results. In our case, the GPS campaigns have been protracted for a short time, and the values of planimetric displacements are lower than the GPS precision, making it useless for the aims of this study. The procedure will be applied when the results of the next GPS campaigns will be available.
5. RESULTS
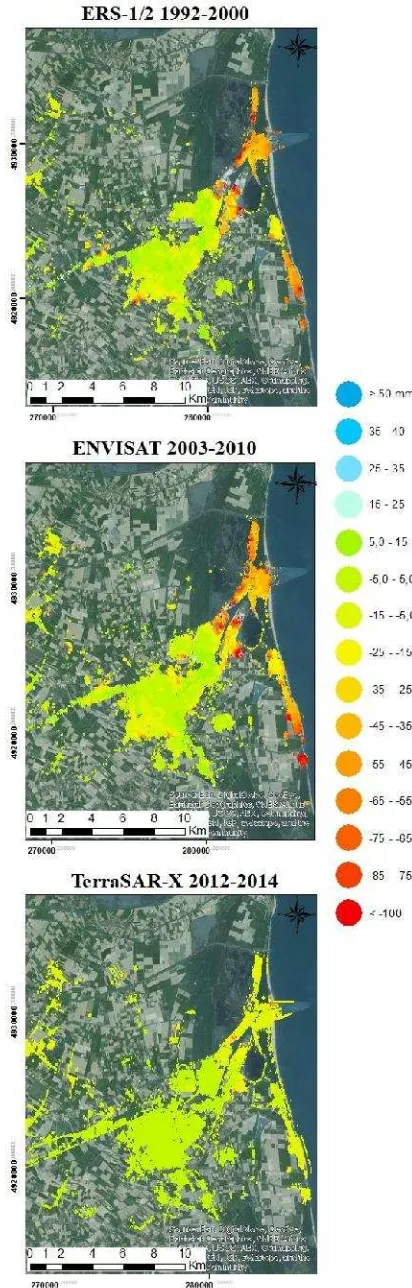
The displacements maps along the satellite LOS of the whole study area using the three different SAR datasets available and processed only with the SBAS technique are reported in Figure 6. The total period investigated goes from 1992 to 2014. As expected, the most affected areas (in red) are the industrial area and the whole coastline. The displacement’srates are similar for the ERS-1/2 and ENVISAT datasets while the TerraSAR-X rates are lower due to the shorter period covered, only two years compared to the eight and seven years of ERS-1/2 and ENVISAT, respectively. The highest displacement rates are located in the industrial area (N-E of Ravenna) and along the coastline (red areas). In the industrial area, the maximum values of displacement are -140 mm for the period 1992-2002 and -147 mm for 2003-2010. Along the coastline, -99 mm for 1992-2002 and 137 mm for 2003-2010.
Figure 6. Displacement maps obtained with SBAS. Negative values, in red, represent subsidence.
The comparison between the SBAS and CPT data processing (Figure 7) shows a good agreement in the displacement values obtained. With SBAS, the maximum displacements obtained are -63 mm while with CPT -66 mm. In this case the SBAS technique has much higher data density over urbanized areas due to the lower coherence threshold used and the higher ground resolution adopted in respect to CPT.
Figure7. Comparison between the displacement maps obtained with SBAS (above) and CPT (under) for the TerraSAR-X
dataset.
of both techniques. Only for the point T1 located in the northeaster part of the area the TS presents different maximum displacement values, meaning different computed velocities. Since the trends are similar, the shift in the velocities could be explained as computational error during the processing of this specific point.
Table 3. Comparison between the displacement time-series obtained with SBAS (dots) and CPT (lines).
To improve the monitoring activity in the study area, a GPS campaign was also carried out to be integrated with the SAR data acquisitions. The field measurements, started in May 2015, are still running and until now consist of 4 acquisitions over 12 3D vertices (Fig. 2). They were taken in areas of high coherence, such as road, building and infrastructure that easily could be detectable by high resolution SAR data. In this way we could have the same points measured with both GPS and SAR acquisitions. To prove the advantages of using very high resolution SAR data, such as the Staring Spotlight, we produced a coherence map generated from two SAR images with temporal baseline of around 7 months.
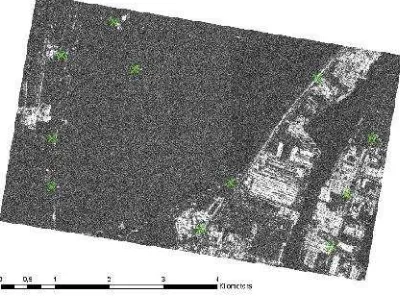
Figure 8: Coherence map of the TerraSAR-X ST pair 03/06/2015-31/01/2016. In green, the location of the GPS
points.
The location of the points used for the GPS campaign was also added to the coherence images (Fig. 8). Unfortunately, the number of SAR images available until now for the new TerraSAR-X SL and ST acquisitions are not enough to produce reliable results. So, as a preliminary study, we compared the displacement measures obtained from the GPS campaign and from the SBAS processing of the Sentinel-1 data. The GPS method. However, the Figure 9 shows a good agreement between GPS and InSAR results over the same period.
Figure 9. Comparison between the displacements obtained with GPS and SBAS measures.
6. CONCLUSIONS
The subsidence affecting the area of Ravenna has been confirmed from the analyses carried out. The results obtained from the SAR data processing, show a good consistency between the different processing methods, with average ground settlement velocities of the same order. The SBAS and CPT techniques proved to be very effective for the monitoring of subsidence over large portions of territory with reduced time and costs. However, one of the limits of SAR interferometry, is that it is generally not possible to obtain results in areas covered by vegetation, because of the loss of coherence in the SAR images. Despite the overall high reliability of the results obtainable through InSAR, it is necessary to validate them with the standard ground-based techniques such as, levelling and GPS surveys. The integration of ground and satellite-based methods is, therefore, a winning approach, since it is possible to cope with the limits of a technique with the strengths of the other. A methodological procedure has been set up to refine and improve the SAR processing results, by taking into account the planimetric displacements of the Eurasian Plate. Its use is foreseen for the future activities.
7. REFERENCES
Baldi, P., Casula, G., Cenni, N., Loddo, F. and Pesci, A., 2009. GPS-based monitoring of land subsidence in the Po Plain (Northern Italy).Earth and Planetary Science Letters, 288, 204-212.
Berardino, P., Fornaro, G., Lanari, R., Sansosti, E., 2002. A new algorithm for surface deformation monitoring based on small baseline differential interferograms. IEEE Transactions on Geoscience and Remote Sensing, 40, 11, pp. 2375–2383.
Carbognin L., Tosi L., 2002. Interaction between climate changes, eustacy and land subsidence in the North Adriatic Region, Italy,Marine Ecology, 23(1), pp. 38-50.
natural and anthropogenic land subsidence and sea level rise, Water Resources Research, 35(1), pp. 163-184.
Mora, O., Mallorquì, J. J., Broquetas, A., 2003. Linear and nonlinear terrain deformation maps from a reduced set of interferometric SAR images.IEEE Transactions on Geoscience and Remote Sensing, 41, 2243–2253.