ASSESSING USEFULNESS OF HIGH-RESOLUTION SATELLITE IMAGERY (HRSI)
FOR RE-SURVEY OF CADASTRAL MAPS
S. S. Rao a *, J. R. Sharma a, S. S. Rajasekhar a, D. S. P. Rao a, A. Arepalli b, V. Arora b, Kuldeep b, R. P. Singh b, M. Kanaparthi b
a Regional Centres, NRSC, Hyderabad, India – (ssrao, jrsharma, ssraj, prakashrao_ds)@nrsc.gov.in b Research Scientist, Regional Centres, NRSC, Hyderabad, India - (abhishek.arepalli, aroravirat,
kchaurasia.nitb, singhravi004, mkanaparthi)@gmail.com
KEY WORDS: Cadastral Maps, Survey/Re-survey, High-resolution Satellite Images, Serial Images, ETS/GPS, Conclusive Land Titles
ABSTRACT:
The Government of India has initiated “National Land Records Modernization Programme (NLRMP)” with emphasis to modernize management of land records, minimize scope of land/property disputes, enhance transparency in the land records maintenance system, and facilitate moving eventually towards guaranteed conclusive titles to immovable properties in the country. One of the major components of the programme is survey/re-survey and updating of all survey and settlement records including creation of original cadastral records wherever necessary. The use of ETS/GPS, Aerial or High Resolution Satellite Images (HRSI) and hybrid method of images are suggested for re-survey in the guidelines. The emerging new satellite technologies enabling earth observation at a spatial resolution of 1.0m or 0.5m or even 0.41m have brought revolutionary changes in the field of cadastral survey. The high-resolution satellite imagery (HRSI) is showing its usefulness for cadastral surveys in terms of clear identification of parcel boundaries and other cultural features due to which traditional cadastre and land registration systems have been undergoing major changes worldwide. In the present research study, cadastral maps are derived from ETS/GPS, HRSI of 1.0m and 0.5m and used for comparison. The differences in areas, perimeter and position of parcels derived from HRSI are compared vis-a-vis ETS/GPS boundaries. An assessment has been made on the usefulness of HRSI for re-survey of cadastral maps vis-a-vis conventional ground survey.
1. INTRODUCTION 1.1 Cadastral System in India
India has about 6.4 Lakh villages. Most of the villages were surveyed and corresponding village (cadastral) maps were prepared at 1:4,000 to 1:8,000 scales during late 19th and early 20th century.
The origin of the cadastral system in India can be traced back to 1001 A.D. during the period of Raja Raja, the king of Tanjavoor. Initially, the purpose was to collect revenue and to keep track of land distribution. As land value was low, the land utility was traditionally agrarian and the parcels had large extensions, even the crude map-making techniques and simpler form of Record of Rights (ROR) were enough to meet the cadastral demands (Dhal and Forsberg, 1999; Gopala Rao et al., 2000). The British, for the purposes of governance and revenue collection evolved the present cadastral system in India, and till 1905 the revenue survey was with Survey of India. There after the responsibility was transferred to the Provinces and now vests with the State Governments. After Independence, many changes have occurred, such as Ryotwari system, land-ceiling acts, gender equality, multipurpose activities on land and development of urban fringes in rural areas etc. The mounting pressure due to these complex human activities and the continued land fragmentation because of population increase led to the present cadastral system being inefficient and outdated (Srinivasa Rao et al., 2003).
Our existing cadastral maps date back to 80-90 years. These cadastral maps are prepared using plane table survey and chain survey. These were prepared for assessing revenues on the basis of land parcel area, quality of land and output
generated. These maps need to be brought under standard projection/coordinate system for effective linkage of the developmental plans generated in the GIS environment.
1.2 Status and Limitations in the existing Cadastral System
It is essential to analyse the status of existing cadastral maps to understand the importance of integration of cadastral maps into LIS. The elements such as the archival, updating, retrieval, survey and settlement, scale, accuracy, definition of the parcel, projection, elevation, etc are needed to be analysed for understanding the status and limitations of the existing cadastral system in India (Dhal and Forsberg, 1999).
Archival: Land records maintained on paper/ cloth are in a very bad shape as they can be as old as 10 -150 years old. Duplication on similar media is cumbersome and will result in similar problems of maintenance after a few years. Generation and maintenance of cadastral records is a state subject and there are many agencies involved for different activities, viz. land survey and settlements, land consolidation, generation of ROR, land registration, publication of records, issue of land tenancy acts, planning and execution of developmental activities of the region, etc. As all these activities are done manually, synchronization of various activities has become difficult. In most of the states, these archives of land resurvey cannot be handled unless they are transformed into another media, which may interfere with accuracy due to manual errors during tracing.
Updation: Updation of boundaries or title information is highly time-consuming and any error will get propagated to the village maps. Cross verification is required frequently to ensure absence of inconsistencies after updation. The village ISPRS Annals of the Photogrammetry, Remote Sensing and Spatial Information Sciences, Volume II-8, 2014
maps are generally very old and either need heavy updating or have gone through various stages of manual settlement resulting in degradation of quality.
Retrieval: Retrieval for redressal of any dispute is time consuming due to the bulkiness of information and has an associated risk of further physical damage to the old records.
Survey and Settlement: Survey and settlement are time-consuming and hence the processes of mutation and updating of records are out of phase.
Scale: Old cadastral maps on 1:4,000 or 1:5,000 are unable to sustain the heavy fragmentation of lands. There are no common standard scales being followed. It differs from state to state and varies from 1:500 to 1:5000.
Accuracy: Old cadastral maps are based on crude techniques and hence do not provide precision needed for land valuation and land conveyance. The accuracy standards also differ from state to state and are not adequate for present day requirements as the survey techniques and standards being followed are generally those adopted over 100 years ago.
Definition of the parcel: The latitude and longitude information of cadastral maps is very essential for linking them to the other thematic maps defined in real world coordinates. It is absent in the cadastral maps. In addition to this, each parcel is identified with its neighbourhood parcels according to the systematic hierarchy of village, Halka, Mandal, taluk and district. This is age-old method of identification.
Projection: The projection used in India is Cassini projection in which the scale is true along the central Meridian and in a direction at right angles to it. However the scale along the other meridians is exaggerated away from the central meridian. Hence the projection is suitable only for areas having small extent in East-West directions. This renders it unsuitable for larger areas and for seamless integration of maps.
Elevation: These surveys also do not have height information that is very important for micro watershed development, a key requirement for land management.
In addition to these deficiencies, the traditional cadastral systems fail to meet requirements connected with supervision, management, decision-making, forecasting and development planning. The most significant problems in the traditional cadastral systems are: low precision of geometric data quality and speed of data access; divergence between the map and the register; and lack of supervisory tools (Srinivasa Rao et al., 2008).
These shortcomings have led to the improvement of the cadastre in many countries. These processes evoke changes of the system’s unitary features resulting in the expansion of the classical cadastre model to cover new issues; the construction of LIS and, more generally, GIS (Piotr, 1999). A modern cadastral system can be referred to as a multitasking cadastre with a possibility of linkage with other subsystems, leading to their integration within the frame of LIS/GIS (Dhal and Forsberg, 1999; Piotr, 1999; Gopala Rao et al., 2000).
1.3 Govt of India Initiatives
The Government of India has initiated “National Land Records Modernization Programme (NLRMP)” at the country level in 2008. The integrated programme would modernize management of land records, minimize scope of land/property disputes, enhance transparency in the land records maintenance system, and facilitate moving eventually towards guaranteed conclusive titles to immovable properties in the country. The major components of the programme are computerization of all land records including mutations, digitization of maps and integration of textual and spatial data, survey/re-survey and updation of all survey and settlement records including creation of original cadastral records wherever necessary, computerization of registration and its integration with the land records maintenance system, development of core Geospatial Information System (GIS) and capacity building (Krishna Murthy et al., 2000).
The main objective of the NLRMP is to develop a modern, comprehensive and transparent land records management system in the country with the aim to implement the conclusive land-titling system with title guarantee, which will be based on four basic principles, i.e., (i) a single window to handle land records (including the maintenance and updating of textual records, maps, survey and settlement operations and registration of immovable property), (ii) the mirror‖ principle, which refers to the fact that cadastral records mirror the ground reality, (iii) the curtain‖ principle which indicates that the record of title is a true depiction of the ownership status, mutation is automated and automatic following registration and the reference to past records is not necessary, and (iv) title insurance, which guarantees the title for its correctness and indemnifies the title holder against loss arising on account of any defect therein.
1.4 Survey/Re-survey of Cadastral Maps
The cadastral survey of an area which has already been surveyed earlier is known as Resurvey. This may be required under the following circumstances: (i) when the framework of survey in field has completely broken down. In such cases, the boundaries shown in the records do not tally with the actual conditions on the ground. This may happen due to obliteration of field and sub-division of boundaries and/or due to misplacement of a large percentage of the local ground control point markers, as a result of which it is difficult to identify the fields with reference to the records.; (ii) Resurvey is also necessary in the case of sudden development of the area due to causes such as sub-divisions, transfer of dry lands into wetlands, and large scale transfer of holdings.
1.5 Cadastral Surveying Techniques
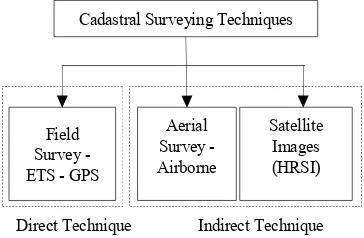
The cadastral surveying is done by three possible methods (Ali et al, 2012); (a) field survey, (b) aerial survey, and (c) satellite images. The first method comes under direct technique while the remaining two methods come within indirect technique, Figure 1.
The selection of technology for cadastral survey depends upon several factors, such as terrain conditions (hilly, undulating, plain), vegetative cover (dense, sparse), built-up areas (urban, settlements), size of survey area (state or region or project area), accuracy (required versus achievable), timeliness (short or normal), and cost (budget requirement versus available).
Field Surveys: Field surveys are conducted by teams on ground using conventional surveying techniques and instruments. Common techniques include the use of plane tabling, sight rule, optical square, chain or steel measuring tapes. The field survey method is quite accurate since most of the calculations are carried out in the field. But it involves huge amount of time and resources including heavy manpower for a countrywide implementation. Therefore, it is needed to find more simple and low cost technologies to reduce the time and cost to complete cadastral survey and mapping for a country. However, the accuracy cannot be a top priority, especially not in rural area where land values are low (Onkalo, 2006). Cadastral surveying by field survey is impossible sometimes when access to remote/mountainous areas is difficult due to harsh weather or security reasons
For reaching the stage of conclusive titling, the States/UTs shall undertake survey/re-survey using modern technology of surveying & mapping, i.e., aerial photography or high resolution satellite imagery combined with ground truthing using TS+GPS so as to ensure true ground depiction on cadastral maps and land records, adopting the methodology most appropriate for the terrain, location, etc. and update the survey & settlement records.
Aerial Surveys: Large-scale aerial photography provides a faster and cost effective means of extracting the cadastral information for parcel mapping (Barnes et al., 1994). Aerial photographs make a very useful data source due to their textural feature and finer spatial resolution (Harvey and Hill, 2001). Though aerial survey seems better alternative to field survey, it is difficult to conduct survey in many countries when there are International Boundary restrictions which hinder the process of taking aerial photography due to defence and security concerns in the area to be surveyed. In addition to this, aerial photography is also highly dependent on weather and climatic conditions.
Satellite Images: With the advent of new satellite technologies with a spatial resolution around 0.5m together with powerful and high speed computing and processing capabilities, revolutionary changes aroused in the field of GIS-based cadastral land information system. The high-resolution satellite imagery (HRSI) has proven its worth for cadastral surveys due to which major reforms are brought about in traditional cadastre and land registration systems. The discipline-oriented traditional surveying technologies such as geodesy, surveying, photogrammetry and cartography
Figure 1. Cadastral Surveying Techniques
have transformed into a methodology-oriented integrated discipline of geo-information due to the use of hybrid techniques such as global positioning system (GPS), remote sensing (RS), and digital photography for spatial data acquisition (Tuladhar, 2005). A combination of land development, management, and planning activities for better use of land in resource management with the involvement of these latest developments in the area of Geographic Information System (GIS) technologies helps the public and private sector in a much robust manner than conventional methods. Generating thematic maps on various scales keeping in mind end users’ requirements has turned into a very easy and time effective task due to advances in the high resolution satellite image acquisition.
The positional accuracy of maps is utmost important for certain Large Scale applications like cadastral survey, infrastructure/utility maps, urban land use, land planning and land consolidation works etc. demand accuracy in the position and measurements of the area. It is possible to achieve an accuracy of +/- 2 meters using one-meter resolution imagery and GPS controls (Cay et al., 2004). All these improvements in satellite imaging have led to availability of more accurate and high resolution satellite images for mapping applications (Ajai, 2002). Mamoru, 2002 suggested that IKONOS imagery is more advantageous in preparing and updating moderate-scale topographical map (around 1:25,000) compared with analogue aerial photo while considering flat areas where the horizontal accuracy of IKONOS ortho-imagery varies between 1.0-1.2m and is worse in mountainous areas. To record the changes of ownership and division of property in a timely fashioned manner for documentation, updating land related information is very essential. The advantage of using HRSI images is that they provide a temporal record of the areas that can be resurveyed in the future to observe the changes that have taken place. Old images can prove very useful in resolving the disputes regarding the existence of physical parcel boundaries (Dale, 1999). Furthermore, the time consuming traditional land surveying methods and cadastral survey in remote areas especially in mountainous areas under unfavourable weather condition is not advisable. In such a case HRSI provides an alternative to traditional land surveying approach for spatial data acquisition where most of the measurement and calculations can be done on a computer (Tuladhar, 2005).
Taking all the above mentioned factors into consideration, this research work uses the various methods of assessment of HRSI as an input to GIS-based cadastral land information system. This research work focuses on various features and attributes of the parcel that can be used for parcel boundary surveying and delineation to improve quality of existing cadastral maps with land records department. This study also highlights the cost and time effective approach to map the cadastral parcel boundaries using the HRSI data while identifying the parcels for any future resurvey.
2. DATA USED AND METHODOLOGY 2.1 Datasets Used
There are six sets of data used in the present study viz., Old RoR, Updated RoR, existing Cadastral Maps, ETS-GPS Survey maps, CARTOSAT-2 and GEO-EYE raster images. RoR data and existing Cadastral Maps were obtained from the Revenue Department, Government of Gujarat. Cadastral Surveying Techniques
Direct Technique Indirect Technique
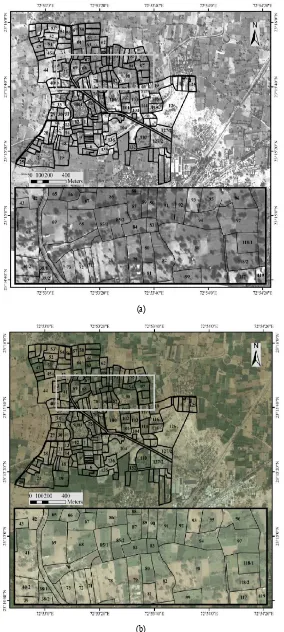
CARTOSAT-2 PAN satellite image of 1.0 m and GEO-EYE multispectral image of 0.5 m were acquired for analysis, details of which are shown in Table 1, Figure 4.
S.
Table 1. Details of satellite images
2.2 Pre-processing of satellite data
In order to make satellite data ready for parcel boundary extraction, a set of pre-processes are needed. Image processing techniques such as DEM generation, ortho-rectification and image enhancement are needed to eliminate distortions which were produced during the image acquisition by the sensor. Such corrected data can then be used for parcel boundary extraction. Some of the pre-processing steps are described below.
2.2.1 DEM Generation: Digital Elevation Model (DEM) is a representation of ground surface topography in digital format. The raster generated from DEM contains elevation information of the terrain at each pixel. There are various techniques to generate DEM, such as, through GPS survey, contour maps or by using stereo pair of remote sensing images. In this paper, CARTOSAT-1 stereo pairs were used to generate raster DEM of 10m pixel size. From the examination of DEM it was depicted that the study area was of almost flat terrain.
2.2.2 Ortho-Rectification: The raw satellite image has geometric distortions due to sensor orientation and varying terrain. The image displacements caused by the above factors are geometrically corrected to match the projection of map co-ordinate system using transformation techniques. In the present study, input raster datasets were geo-corrected with reference to UTM projection system in ERDAS IMAGINE 2014.
2.2.3 Image Enhancement: It is the process of enhancing the image information to produce the better look of the image. There are various image enhancement techniques, such as, contrast manipulation, histogram equalization, etc. In this paper, the input satellite data has been enhanced using histogram equalization.
2.3 Parcel Attribute Extraction
2.3.1 Collection of area information from RoR: The parcel areas from old RoR were matched against the updated RoR data and tabulated for area comparison.
2.3.2 Parcel extraction from existing Cadastral Maps: The existing hard copy Cadastral Map was scanned, rectified with reference to UTM Projection System and subsequently digitized at 1:4000 scale for the purpose of parcel extraction.
2.3.3 Parcel extraction from ETS-GPS: The ETS-GPS data was obtained as CAD drawings which were further imported to ArcGIS and geo-referenced with respect to existing dataset to derive the parcel boundaries.
2.3.4 Parcel extraction from ortho-rectified satellite data:Parcels were digitized over satellite images based on the visual interpretation using the ground surveyed vector layers (i.e. ETS-GPS) as the reference. The feature capturing thresholds for GIS environment were adapted from NNRMS cartographic standards at 1:4000 scale.
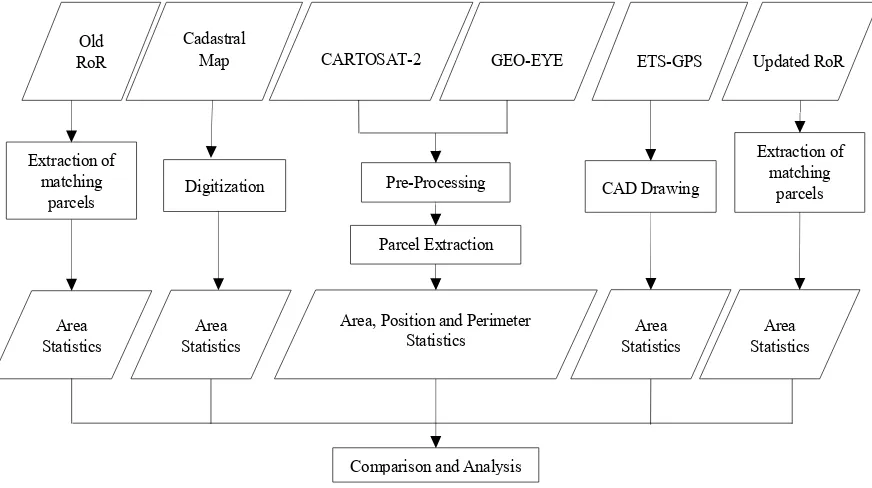
The parcels extracted from various datasets were compared using their attributes. Three parameters were used for comparison and analysis, viz., area, perimeter and position. Perimeter statistics has been included in the analysis to define precise geometrical shapes of the parcels. Sometimes parcel in satellite data may have the same area vis-a-vis the parcel derived in ETS-GPS. Sometimes the position of the parcel in both of the datasets might be different. Thus a positional parameter has also to be compared (in this case the centroid) with precise latitude and longitude in both the datasets. The methodology for the proposed study has been shown in Figure 3.
2.4 Study Area
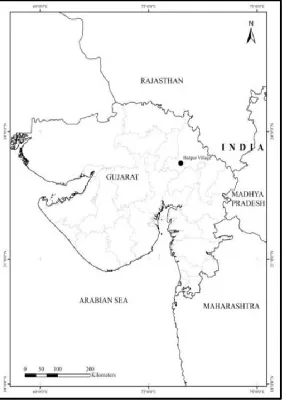
The study area as shown in Figure 2 is Badpur village which is located in Gandhinagar district of Gujarat state. The village has almost flat terrain and covers an area of about 164.08 ha. The upper left scene ordinates and lower left scene co-ordinates are 23° 15' 59.78''N, 72 52 48.07E and 23° 15' 9.93''N, 72° 53' 48.78''E respectively. The effect of urbanisation is minimal in this study area. Badpur Village area consists of agricultural parcels predominantly while the settlements are sparsely distributed at centre of the village. Most of the tree canopy can be found lying along the parcel boundary or the roads. The total number of parcels covered inside the village boundary are 167 with an average size around 1 hectare.
Figure 2. Location of study area ISPRS Annals of the Photogrammetry, Remote Sensing and Spatial Information Sciences, Volume II-8, 2014
Figure 3. Methodology
Figure 4. (a) CARTOSAT-2 and (b) GEO-EYE image of the study area
(a) (b)
Old
RoR Cadastral Map CARTOSAT-2 GEO-EYE ETS-GPS Updated RoR
Digitization Pre-Processing
Parcel Extraction
CAD Drawing
Comparison and Analysis Area, Position and Perimeter
Statistics Area
Statistics Extraction of
matching parcels
Extraction of matching
parcels
Area
Statistics Statistics Area Statistics Area
(a)
(b)
Figure 5. (a) Cadastral Parcel Derived from CARTOSAT-2 (b) Cadastral Parcels derived from GEO-EYE ISPRS Annals of the Photogrammetry, Remote Sensing and Spatial Information Sciences, Volume II-8, 2014
3. RESULTS AND ANALYSIS 3.1 Area Comparisons
For the comparison of areas, 6 datasets were used viz., old ROR Records, old Cadastral Map, Updated ROR records, ETS-GPS Vector Parcels, Parcel Boundary Derived from CARTOSAT-2, Figure 5 (a) and Parcel Boundary derived from GEO-EYE, Figure 5(b). An analysis has been carried out between the values of ROR and corresponding map, new and old RoR, ground survey and parcels derived from HRSI images.
3.1.1 Comparison between Old RoR Records and Cadastral Map:
In this case, 89 matching records were found between the RoR record area values and Digitized Cadastre polygons. The RoR had total 89 Records and Cadastre had total 164 polygons. As in Table 2, about 37% of the parcels have less than 1% error in parcel area which implies accurate records in cadastre. Around 36% of the parcels are in error range of 1% to 3% which shows minimum deviations. 14% of the parcels have error between 3% and 5% which implies a moderate deviation in record values.
% Error No. of Parcels
Table 2. Comparison Between Old RoR Records and Cadastral Map
Figure 6. Plot of number of Parcels against the percentage error between RoR Entry and Cadastral Map
However, 12% parcels have area error more than 5% which indicates deviation over the threshold. This difference have occurred due to representation of surface/actual measured area on the ground in RoR details and planimetric area derived from cadastral map compiled with the adjustment of individual parcels in the map. This problem can be overcome by using the ortho image of aerial as well as satellite data.
3.1.2 Comparison between Updated RoR Records and ETS-GPS Vector Parcels :
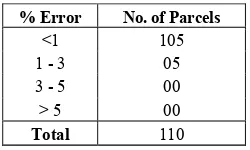
In this case 110 matching records were found between the updated RoR records after the ETS survey and the Digitized Parcels from ETS. The updated RoR had 110 records and the ETS vector file had 167 polygons. As in Table 3, about 95% of the parcels have less than 1% error in parcel area which implies accurate records in cadastre. Around 5% of the
Table 3. Comparison Between updated RoR Records and ETS-GPS Parcels
Figure 7. Plot of number of Parcels against the percentage error between updated RoR records and ETS-GPS Parcels
Even the 1% deviation is due to conversion between various GIS software environments and decimal truncations (Figure 7).
3.1.3 Comparison between Updated RoR Records and Old RoR Records:
In this case, 89 matching records were found between the old RoR record area values and updated RoR record values. The old RoR had total 89 Records and updated RoR had total 110 records. As in Table 4, about 60% of the parcels have less than 1% error in parcel area which implies accurate records in both. Around 21% of the parcels are in error range of 1% to 3% which shows minimum deviations. 14% of the parcels have error between 3% and 5% which implies a moderate
Table 4. Comparison between Old RoR Records and updated RoR records
Comparision - RoR Entry and Cadastral Map
0
Comparision - updated RoR Records and ETS-GPS Vector Parcels
Figure 8. Plot of number of Parcels against the percentage error between old ROR Entry and updated ROR Entry
Only 5% parcels have area error more than 5% which indicates deviations over the threshold. This was due the encroachments into natural regions/government lands, etc. (Figure 8)
3.1.4 Area Comparison among ETS-GPS Parcels, CARTOSAT-2 Derived Parcels and GEO-EYE Derived Parcels:
The Parcels derived from CARTOSAT-2 (1m) and GEO-EYE (0.5m) were used for this analysis. As a reference area the ETS survey Parcels were chosen. The areas of the matching parcels from each layer were extracted and used for analysis. A total of 159 parcels were derived from CARTOSAT-2 whereas a total of 164 parcels were derived in GEO-EYE. ETS-GPS had a total number of 167 parcels. Observing the trend in Figure 9, we can state that 80% of the parcels can be marked with less than 5% error using HRSI.
% Error CARTOSAT-2No of Parcels - No of Parcels - GEO-EYE
<1 47 56
1 - 3 46 51
3 - 5 38 32
> 5 28 20
Total 159 159
Table 5. Comparison of Area deviation with respect to ETS-GPS in CARTOSAT-2 and GEO-EYE
Also, when observed in Table 5, 35% Parcels (56 Parcels) derived from GEO-EYE had area deviation less than 1% with respect to ETS-GPS which shows an accurate match between these two parcel layers. Around 32% Parcels (51 Parcels) derived from GEO-EYE had area deviation between 1% and 3% w.r.t. ETS-GPS which shows a minimal mismatch between these two parcel layers. Around 20% Parcels (32 Parcels) derived from GEO-EYE had area deviation between 3% and 5% w.r.t. ETS-GPS which indicates mismatch between two layers.
Also in case of CARTOSAT-2 30% Parcels (47 Parcels) have area deviations less than 1%, 29% Parcels (46 Parcels) have area deviations between 1% and 3%, 24% Parcels (38 Parcels) have area deviations between 3% and 5% w.r.t. ETS-GPS Parcels.
However 12% Parcels (20 Parcels) in GEO-EYE and 17% Parcels (28 Parcels) in CARTOSAT-2 have area deviation more than 5% w.r.t. ETS-GPS which is considered to be a large deviation. This had occurred due to various factors. In areas concentrated with settlements, the physical parcel boundary was modified/dissolved with surrounding parcels. Most of the tree canopy was found over field bunds or alongside roads obstructing the view of actual boundary. Sometimes there was lack of visual difference between two adjacent fields making it difficult to identify the boundary. The marking of parcel boundary is limited by the pixel resolution of the satellite imagery used.
From this it can be inferred that a more precise mapping of Parcels was possible as resolution increases. It was also noticed that the parcel area error percentage with respect to ETS is larger in smaller parcels even when the absolute difference of area is comparatively low. Thus we can say that error percentage increases if there are more number of smaller parcels. From this we can infer that more accuracy in terms of parcel area can be maintained if finer resolution images are used to mark parcel boundaries of considerable area. Due to the above stated reasons, nearly 20% of the parcels had a area error greater than 5%.
Figure 9. Plot of number of Parcels against the percentage error of area in CARTOSAT-2 and GEO-EYE with respect to
ETS-GPS Survey
3.2 Perimeter Comparisons
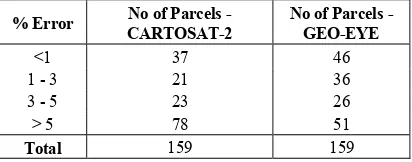
The perimeter of the matching parcels from each layer were extracted and used for analysis. A total of 159 parcels were derived from CARTOSAT-2 whereas a total of 164 parcels were derived in GEO-EYE. ETS-GPS had a total number of 167 parcels.
% Error No of Parcels - CARTOSAT-2 No of Parcels - GEO-EYE
<1 37 46
1 - 3 21 36
3 - 5 23 26
> 5 78 51
Total 159 159
Table 6. Comparison of Perimeter deviation with respect to ETS-GPS in CARTOSAT-2 and GEO-EYE 0
Comparision - updated RoR Records and Old RoR Records
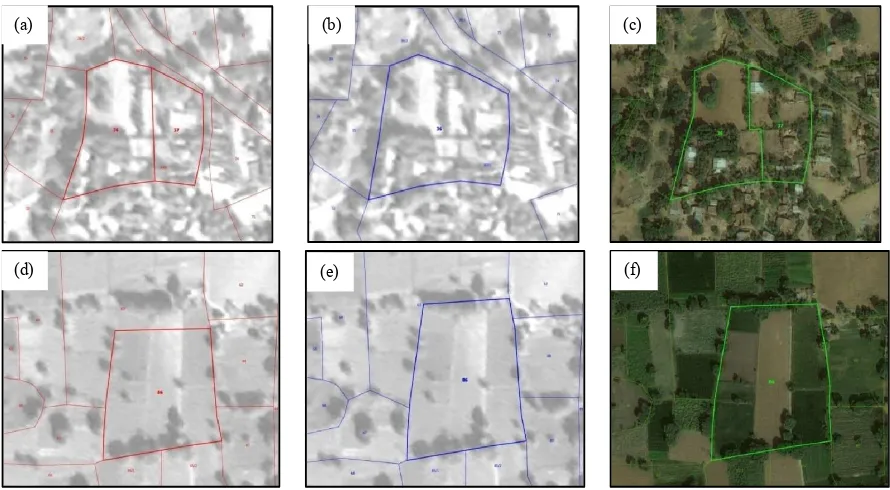
Figure 10. (a) Parcels 36 and 37 plotted in ETS-GPS Survey (b) Parcel 37 was not visible in CARTOSAT-2 hence two parcels were plotted as one and assigned number 36 (c) Parcels 36 and 37 plotted based on GEO-EYE imagery (d) Parcel 86 plotted in ETS-GPS
Survey (e) Parcel 86 plotted as seen in CARTOSAT-2 (f) Parcel 86 plotted as seen in GEO-EYE
Figure 11. Plot of number of Parcels against the percentage error of Perimeter in CARTOSAT-2 and GEO-EYE with
respect to ETS-GPS Survey
When observed in Table 6, 29% Parcels (46 Parcels) derived from GEO-EYE had perimeter deviation less than 1% with respect to ETS-GPS which shows an accurate match between these two parcel layers. Around 23% Parcels (36 Parcels) derived from GEO-EYE had perimeter deviation between 1% and 3% w.r.t. ETS-GPS which shows a minimal mismatch between these two parcel layers. Around 16% Parcels (26 Parcels) derived from GEO-EYE had perimeter deviation between 3% and 5% w.r.t. ETS-GPS which indicates small mismatch between two layers.
Also in case of CARTOSAT-2 23% Parcels (37 Parcels) have perimeter deviations less than 1%, 13% Parcels (21 Parcels) have perimeter deviations between 1% and 3%, 15% Parcels
(23 Parcels) have perimeter deviations between 3% and 5% w.r.t. ETS-GPS Parcels.
However 32% Parcels (51 Parcels) in GEO-EYE and 49% Parcels (78 Parcels) in CARTOSAT-2 have perimeter deviation more than 5% w.r.t. ETS-GPS which is considered to be a large deviation.
The general tendency was to draw more vertices by over-emphasizing the parcel shape which increased the perimeter of the parcel as a whole. Depiction of small parcels with less than 0.5ha also increased the deviation. This has created more number of parcels with a perimeter deviation greater than 5% with respect to ground survey.
3.3 Position Comparisons
For the comparison of position accuracy, 3 datasets were finalized from above methodology viz., ETS-GPS Vector Parcels, Parcel Boundary Derived from CARTOSAT-2 and Parcel Boundary derived from GEO-EYE. A total of 159 parcels were derived from CARTOSAT-2 whereas a total of 164 parcels were derived in GEO-EYE. ETS-GPS had a total number of 167 parcels.
To identify the shift in position of parcels centroid coordinates were derived for each parcel and the distance from the centroid of corresponding ETS parcel was measured in terms of Euler's distance (1) according to below formula:
∆ = {( − ) + ( − ) } (1)
where Dd is shift in meters
(x,y) is co-ordinate values of the point 0
10 20 30 40 50 60 70 80 90
<1 1 - 3 3 - 5 > 5
N
o.
of
P
arc
el
s
% Error
Percentage Error W.R.T. ETS-GPS
CARTOSAT-2 GEOEYE
(f) (e)
(d)
(c) (b)
(a)
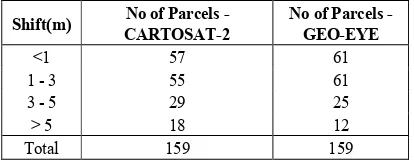
When observed in Table 7, 38% Parcels (61 Parcels) derived from GEO-EYE had centroid shift less than 1m with respect to ETS-GPS which shows an accurate match between these two parcel layers. Around 38% Parcels (61 Parcels) derived from GEO-EYE had centroid shift between 1m and 3m w.r.t. ETS-GPS which shows a minimal mismatch between these two parcel layers. Around 16% Parcels (25 Parcels) derived from GEO-EYE had centroid shift between 3m and 5m w.r.t. ETS-GPS which indicates small mismatch between two layers.
Also in case of CARTOSAT-2 36% Parcels (57 Parcels) have centroid shift less than 1m, 35% Parcels (55 Parcels) have centroid shift between 1m and 3m, 18% Parcels (29 Parcels) have centroid shift between 3m and 5m w.r.t. ETS-GPS Parcels.
However 8% Parcels (12 Parcels) in GEO-EYE and 11% Parcels (18 Parcels) in CARTOSAT-2 have centroid shift more than 5m w.r.t. ETS-GPS.
From this, it can be seen that more number of parcels can be depicted using HRSI with good accuracy.
Shift(m) CARTOSAT-2No of Parcels - No of Parcels - GEO-EYE
<1 57 61
1 - 3 55 61
3 - 5 29 25
> 5 18 12
Total 159 159
Table 7. Comparison of Position deviation with respect to ETS-GPS in CARTOSAT-2 and GEO-EYE
Figure 12. Plot of number of Parcels against the percentage error of position in CARTOSAT-2 and GEO-EYE with
respect to ETS-GPS Survey
4. CONCLUSIONS
The present study has shown good potential for use of HRSI images for survey/re-survey of cadastral maps. The parcels extracted from various datasets were compared using their attributes viz. area, perimeter and position. Around 80% of the parcels can be derived with precision, meeting the standards for survey/re-survey. The comparison of areas,
shapes and position has strengthened the premise for use of HRSI. From this study, it is also observed that accuracy of parcel identification increases with increase in spatial resolution of the satellite imagery. In addition, use of HRSI will result in increased throughput, area prioritization for ground survey, faster maintenance and updation of cadastral maps in more economical manner.
However, some parcels could not be depicted due to thick tree canopy over boundaries, expansion in settlements, lack of physical boundary visibility due to areas of similar spectral reflectance, cumulative effect of pixel resolution, etc.
In the end, the potential use of HRSI for survey/re-survey along with conventional ground methods, through an integrated approach can fasten the process of achieving the conclusive land titling system in India.
ACKNOWLEDGEMENTS
This work was performed under Technology Demonstration Program (TDP) funded by Indian Space Research Organisation (ISRO) at NRSC, Hyderabad. The project team sincerely thanks Dr. V. K. Dadhwal, Director, NRSC for his encouragement and technical guidance. The authors thank Dr. T. P. Singh, Director, BISAG, Ahmedabad and Shri. M. V. Joshi, Settlement Commissioner and Director of Land
Ajai, 2002. Mapping for Micro-Level Planning: The Issues & Challenges, Indian Cartographer, vol. 22.
Ali, Z., 2012. Assessing Usefulness of High-Resolution Satellite Imagery (HRSI) in GIS-based Cadastral Land Information System. Journal of Settlements and Spatial Planning, 3(2), pp. 93-96.
Ali, Z., Tuladhar, A., Zevenbergen, J., 2012. An integrated approach for updating cadastral maps in Pakistan using satellite remote sensing data. International Journal of Applied Earth Observation and Geoinformation, 18, pp. 386-398.
Cay, T., Corumluoglu, O., Iscan, F. 2004. A Study on Productivity of Satellite Images in the Planning Phase of Land Consolidation Projects, presented at the XXth ISPRS Congress "Geo-Imagery Bridging Continents", Istanbul, Turkey.
Dahl O. C., R. Forsberg, 1999. Different ways to handle topography in practical geoid determination, Physics and Chemistry of the Earth, Part A: Solid Earth and Geodesy, 24(1), pp. 41-46.
Dale, P. F., McLaughlin, J., 1999. Land Administration. Oxford: Oxford University Press.
0
Shift in Parcel Centroid W.R.T. ETS-GPS
CARTOSAT-2 GEO-EYE
Gopal Rao K., T.R. Nisar Ahamed, J.S.R. Murth, 2000. GIS-based fuzzy membership model for crop-land suitability analysis, Agriculture System, 63(2), pp. 75–95.
Kaczynski, R., 2012. Transfer of technology for cadastral mapping in Tajikistan using high resolution satellite data.
International Archives of the Photogrammetry, Remote Sensing and Spatial Information Sciences, Melbourne, Australia, Vol. XXXIX, Part B6, pp. 41-43.
Krishna Murthy, Y.V.N., Srinivasa Rao, S., Srinivasan, D. S. and Adiga, S. 2000a. Land Information System (LIS) for rural development. Technical proceedings, Geomatics-2000.
Mamoru, K., Toshihiro, K., Nobuyuki, W., Kaoru, M. J., 2002. Interpretation Characteristics of IKONOS Imagery and its Coordinate Accuracy Validation, Journal of the Geographical Survey Institute, vol. 94, pp. pp. 38-47.
Onkalo, P., 2006. Cadastral survey methodologies and techniques in developing countries; case Cambodia and Kosovo. In: XXIII FIG Congress “Shaping the Change" , 8–13 October, Munich, Germany.
Piotr Cichocinski, 1999, Digital Cadastral Maps in Land Information Systems. LIBER QUARTERLY, Munich, Germany, pp. 211-221, ISSN 1435-5205.
Srinivasa Rao, S., Krishna Murthy, Y.V.N., Joshi, A.K., Shantanu, B., Das, S.N. and Pandit, D.S. 2003b.
Computerisation and Geo-referencing of cadastral maps in Chhattisgarh State. Technical Document, Regional Remote Sensing Service Centre/ISRO, Nagpur.
Srinivasa Rao and Krishna Murthy Y V N. 2008. Accuracy Assessment in Vectorisation and Geo-Referencing of Cadastral Maps. INCA 2008 presentation.
Tuladhar, A. M., 2005. Innovative Land Tools, Surveying and Geo-information Technologies, presented at the Global Network for Pro-poor Land Tool Developers, Stockholm, Sweden, 2005.