Distributive effect of state subsidy to undergraduate
education: the case of Illinois
Seong Soo Lee, Rati Ram, Charles W. Smith
*Department of Economics, Illinois State University, Normal, IL 61790-4200, U.S.A.
Received 11 November 1993; accepted 17 February 1998
Abstract
An assessment is made of the distributive effects of state subsidies to undergraduate education in public universities and community colleges in Illinois during 1989. The main finding is that the existing system of public subsidy to undergraduate education favors lower-income and middle-income groups. Public subsidies lead to redistribution of income from higher-income to lower-income and middle-income families, with the most significant transfer being from the highest-income group to families with income of less than $40 000 per year. A comparison of the patterns for universities and community colleges indicates that middle-income groups are the major beneficiaries of community colleges; the net transfer from the highest-income group is larger, and the net gain of the poorest group is smaller, in community colleges than in universities. [JEL I22, H7]1999 Elsevier Science Ltd. All rights reserved.
1. Introduction
An understanding of the redistribution effects of pub-lic subsidies to education is important so that popub-licy issues concerning the financing of higher education can be addressed from an equity perspective.
Hansen and Weisbrod (1969) used a net-benefit approach to assess the distributive effects of public sub-sidies to higher education in California. They compared the amount of taxes paid with the subsidies received by families with children enrolled in community colleges, State University campuses and the University of Califor-nia system. Their conclusion was that the net benefits received were positively correlated with family income, and that, therefore, the system led to a redistribution from lower to upper income families. Although a pion-eering work, the Hansen-Weisbrod study was criticized by several scholars, including Cohn (1970); Gifford (1970); Hartman (1970); Pechman (1970) and Sharkan-sky (1970). The main weaknesses noted by these
schol-* Corresponding author. E-mail: [email protected]
0272-7757/99/$ - see front matter1999 Elsevier Science Ltd. All rights reserved. PII: S 0 2 7 2 - 7 7 5 7 ( 9 8 ) 0 0 0 2 7 - 2
ars in the Hansen-Weisbrod study were (a) correlating the average net benefit by institution-type with family income, instead of considering the net benefit by income groups, (b) comparing total state taxes paid with the benefits received only from the public higher education system, (c) omission of student financial aid, (d) heavy reliance on data for parent-supported students, and (e) some of the suggested conclusions not being reasonable implications of the reported results.
Pechman (1970) argued that a better approach to an assessment of the distributive effects of public subsidies to higher education would be a comparison of net bene-fits received by different income groups. On the basis of the distribution by family income of (a) the burden of the proportion of state and local taxes that supported public higher education in California, and (b) benefits of the public higher education system in the state, Pechman concluded that there was a redistribution from higher-income to lower-higher-income families.1 Like the
Weisbrod work, Pechman’s study also did not consider financial aid to students in estimating benefits (and costs). As McGuire (1976) noted, omission of financial aid is likely to lower the relative net benefit received by students from low-income families.
A study by Windham (1970) for Florida supported the Hansen-Weisbrod conclusion that public financing of higher education leads to a redistribution in favor of higher income groups. His methodology is similar to Pechman’s, but he included federal financial aid and taxes in the estimation of costs and benefits. One major weakness of Windham’s research was the application to Florida of tax incidence estimates that were averages for the entire United States.
A careful study on the subject was conducted by Hight and Pollock (1973). They compared the net-transfer effects resulting from public higher education programs in California, Florida and Hawaii by using a modified version of the Pechman-Windham methodology. In a simple and elegant manner, they compared, for six fam-ily-income groups, the percentage distribution of stu-dents and the percentage distribution of state and local tax burden. Although they found that the patterns dif-fered across the three states, the overall picture (p. 324) seemed to be that of a transfer from high-income groups to middle-income or lower middle-income groups. The lowest-income group was a net loser in all cases. The Hight-Pollock study, however, did not take account of financial aid received by the students.
Our study makes an assessment of the distributive effect of public subsidies to undergraduate education at state universities and community colleges in Illinois dur-ing the year 1989. It estimates, for various income classes, the tax cost of such subsidies and the benefits received from participation in the public higher edu-cation system, including the financial aid received by stu-dents from the state, and thus determines the net benefit received by each income group. At the time of the Hight-Pollock study, state-funded financial aid to undergrad-uate students may have been smaller than at present, and thus it is more important to include it now.
The motivation for the research is threefold. First, Illi-nois ranked seventh in the nation in terms of current-fund expenditures of public institutions of higher education in 1988–89 (U.S. Department of Education, 1992, p. 336). Therefore, a study that examines the redistributive effects of such a substantial outlay on public higher edu-cation should have considerable policy relevance. Second, we include in the analysis the state-funded fin-ancial aid given directly to undergraduate students, which most earlier studies did not consider. Third, much time has elapsed since the earlier studies were conducted. During this period, the structure of taxes, the distribution of income and thus the tax base, and income distribution of students enrolled in higher education may have
changed. Any of these changes could alter the con-clusions reported in the earlier studies.
2. The design of the study, and the main results
In 1989, Illinois public higher education system con-sisted of 12 university campuses and 50 community col-leges. As indicated by Illinois Board of Higher Education (1990, p. 54), and Illinois Community College Board (1990), in 1989, the 12 university campuses had a full-time-equivalent (FTE) enrollment of 133 234 undergrad-uates, and the 50 community colleges had an FTE enrollment of 174 437. Public universities are supported largely by state’s general-revenue funds (State of Illinois, 1989). Besides the tuition income, some funding also comes from the federal government and private sources, but the amounts from federal and private sources are relatively small. Community colleges are financed mainly from the state’s general-revenue funds, local pro-perty-tax revenues, and the state’s corporate personal property replacement tax (CPPRT) revenue.2
The methodology adopted in our study consists of the following steps:
1. Compute the amount of the state’s tax revenue appro-priated for operations of state universities and public community colleges. Compute also the local property-tax revenue and CPPRT revenue appropriated for operations of public community colleges.
2. Estimate the proportion of the state appropriations to the universities that is attributable to undergraduate education. This requires campus-specific information on the proportion of costs attributable to undergrad-uate education.
3. Compute the amount of direct financial aid to under-graduate students in public universities and com-munity colleges from the state’s general-revenue funds.
4. Using data on family-income distributions of under-graduate enrollment and financial-aid recipients, con-struct the distributions of items 2 and 3 by broad income groups, and obtain their sum for universities and community colleges. These would be the “bene-fits” of undergraduate education in state universities and community colleges for each income group. Note again that these benefits accrue from the use of tax-revenue funds for undergraduate education at public institutions, and the funding contributed by tuition monies or federal or private sources is not included. 5. Estimate the tax share of each income group in
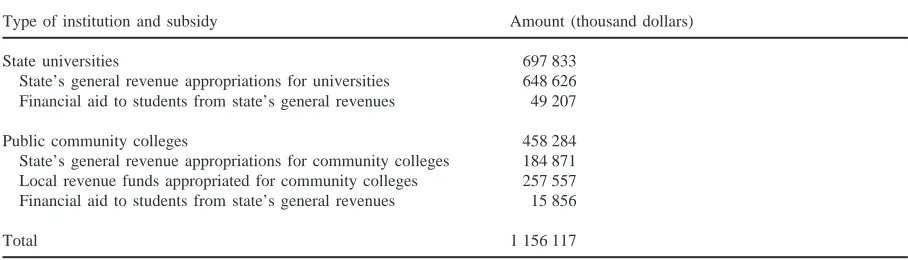
Table 1
State and local tax revenues used for subsidizing undergraduate education in public higher education institutions in Illinois, 1989
Type of institution and subsidy Amount (thousand dollars)
State universities 697 833
State’s general revenue appropriations for universities 648 626 Financial aid to students from state’s general revenues 49 207
Public community colleges 458 284
State’s general revenue appropriations for community colleges 184 871 Local revenue funds appropriated for community colleges 257 557 Financial aid to students from state’s general revenues 15 856
Total 1 156 117
Note. These are the means for the fiscal years 1988–89 and 1989–90, and are based on the following sources: Hines (1990, p. 17); Illinois Board of Higher Education (1991a, p. 16); Illinois Community College Board (1990, pp. 79, 82); Illinois Student Assistance Commission (1990, pp. 16, 21).
evant state taxes and in local property taxes. Using these shares, compute the distribution of tax-revenue costs, which consist of items 2 and 3, for various income groups.
6. From the distributions mentioned in 4 and 5, compute the net benefit for each group for the entire system and also separately for the universities and the com-munity colleges.3
Table 1 reports the estimated appropriations from the state’s general-revenue funds for universities and com-munity colleges and for direct financial aid to students and the local-revenue appropriations for community col-leges. The appropriations for community colleges and financial aid are entirely for undergraduate education and no adjustment is needed. The appropriations for state universities have been adjusted to reflect the proportion attributable to the undergraduate programs at each uni-versity. The proportion varies from 0.50 to 0.87 at the 12 campuses.4
Table 2 reports the estimated distribution of family income of students enrolled at public universities and community colleges. These are based on surveys that covered a fairly large segment of undergraduate students at the universities and community colleges, and provide a reasonable indication of the distribution of the benefits of undergraduate education at public institutions of higher education in Illinois in 1989. It will be seen from Table 2 that the distribution of university students is more skewed toward higher-income groups than is the
3This method assumes that all benefits are internal to the student and the family, and, as already noted, the benefits equal the appropriations from state and local revenues for undergrad-uate education.
4Additional details concerning the adjustments are provided by Lee (1993, pp. 40–42).
case for community colleges which are dominated by students from middle-income families. It may be noted that the distribution for the universities is derived from campus-specific information, but that for community col-leges is based on family-income data for the entire sys-tem.5
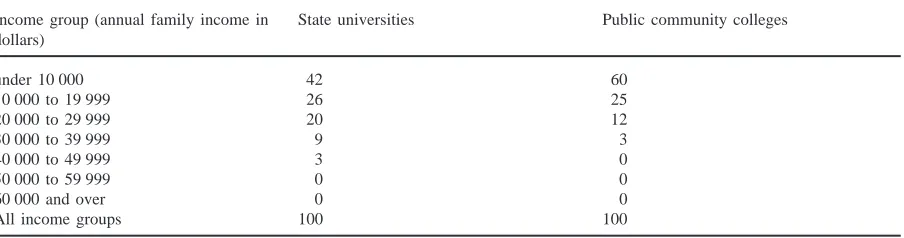
Table 3 presents the family-income distributions of students in state universities and community colleges who received direct financial aid from the state’s gen-eral-revenue funds through the Monetary Award Pro-gram (MAP).6These represent the distribution of state’s
tax-revenue benefit in the form of direct financial aid. Since MAP is a need-based program, most recipients are from families whose annual income is below $30 000.7
Using the information on which Table 2 and Table 3
5Lee (1993, pp. 32–33, 46–48), provides more details about the sources and the procedure.
6We include state financial aid that is in the form of a “grant” and is neither a loan nor a payment for work. Federal financial aid is not considered since the focus is on the distributional consequences of the state subsidies. The report by Illinois Board of Higher Education (1991b, p. 55) indicates that, in terms of the amount disbursed, federal Pell grants are close to the state’s monetary award program that we have included. Since Pell grants are also need-based, and since federal taxes are largely progressive, as noted by Pechman (1985, p. 62), inclusion of federal aid is likely to indicate larger net transfers to middle-and low-income groups.
Table 2
Percentage distribution of undergraduate enrollment at Illinois public higher education institutions by income group, 1989
Income group (annual family income in State universities Public community colleges dollars)
under 10 000 7.1 7.3
10 000 to 19 999 10.3 13.3
20 000 to 29 999 14.9 21.4
30 000 to 39 999 18.6 25.7
40 000 to 49 999 15.2 15.3
50 000 to 59 999 12.6 8.2
60 000 and over 21.3 8.8
All income groups 100.0 100.0
Note. The distribution for the public universities is a weighted average of the corresponding distribution for each campus, and the weights are the student enrollments. The numbers are derived from the following sources: American College Testing Program (1988),
The ACT Class Profile Report: Freshmen, Table 4.5 and Table 15; American College Testing Program (1989), The ACT Class Profile: Illinois Public Junior Colleges Composite Report, Table 4.5; Morris et al. (1990).
Table 3
Percentage distribution of undergraduate recipients of financial aid by income group in Illinois public higher education institutions, 1989
Income group (annual family income in State universities Public community colleges dollars)
under 10 000 42 60
10 000 to 19 999 26 25
20 000 to 29 999 20 12
30 000 to 39 999 9 3
40 000 to 49 999 3 0
50 000 to 59 999 0 0
60 000 and over 0 0
All income groups 100 100
Note. This is based on Illinois Student Assistance Commission (1990, pp. 48–49).
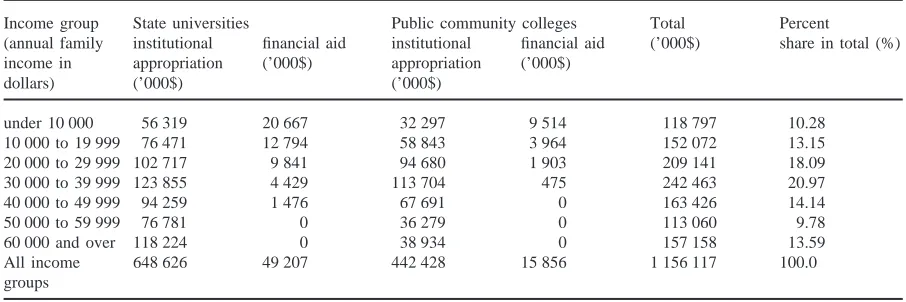
are based, the distribution of benefits (shown in Table 1) across the various income groups is estimated and presented in Table 4.8It may be noted again that while
all community colleges are treated as single system, for the public universities the family-income distribution of enrollment in Table 2 and of the state’s institutional
8For distributing the benefits of financial aid, we proceed on the basis that the average award is the same for each income group. This is a reasonable procedure since Illinois Student Assistance Commission (1990, tables 2.4b and 2.4c) indicates only small variations in the average award across the various income groups. It may be noted here that the concepts of “fam-ily income” used in the surveys on which Table 2 is based may not be the same as that underlying Table 3. However, these seem close enough to enable compilation of the distribution of benefits for the sum of institutional appropriations and finan-cial aid.
appropriations in Table 4 are based on campus-specific information.9
The next step is to determine who pays for the benefits (and costs) reported in Table 1. To estimate the tax share of each income group, the amounts shown in Table 1 are allocated according to the estimates of the incidence of state and local taxes that are relevant to the financing of higher education. State taxes that go into the
Table 4
Distribution by income group of benefits of state’s general revenue and local-fund appropriations for undergraduate education and of direct financial aid to students in Illinois public higher education institutions, 1989
Income group State universities Public community colleges Total Percent
(annual family institutional financial aid institutional financial aid (’000$) share in total (%) income in appropriation (’000$) appropriation (’000$)
dollars) (’000$) (’000$)
under 10 000 56 319 20 667 32 297 9 514 118 797 10.28
10 000 to 19 999 76 471 12 794 58 843 3 964 152 072 13.15
20 000 to 29 999 102 717 9 841 94 680 1 903 209 141 18.09
30 000 to 39 999 123 855 4 429 113 704 475 242 463 20.97
40 000 to 49 999 94 259 1 476 67 691 0 163 426 14.14
50 000 to 59 999 76 781 0 36 279 0 113 060 9.78
60 000 and over 118 224 0 38 934 0 157 158 13.59
All income 648 626 49 207 442 428 15 856 1 156 117 100.0
groups
Note. These numbers are derived from the sources on which Tables 1–3 are based. It may be recalled that both distributions for community colleges and the distribution of financial aid for the universities are based on system-wide information, but that for institutional appropriation for the universities is derived from campus-specific data on state appropriations. Since neither students’ family income nor state appropriation per student is identical across campuses, the percentage distribution of state appropriations across family-income groups for the universities is not the same as that for enrollments given in Table 2. The distribution of appropriations by family income given above is more accurate than that obtained by simply dividing the total appropriation of 648.6 million dollars on the basis of the enrollment percentages in Table 2. See also note 9.
revenue pool, which finances higher education, consist of individual and corporate income taxes, general and selective sales taxes, and taxes on alcoholic beverages, tobacco products, insurance, amusements, death, gifts, and real estate transfers. Incidence of several other taxes, including state’s motor fuel tax and license taxes, and local sales taxes, that go into other funds, is not directly relevant to the distribution of costs of public subsidy to higher education. For the local-revenue appropriations to community colleges, the incidence of local property taxes is relevant.
Estimates of the incidence of state and local taxes in Illinois for 1989 are not available. Since a direct esti-mation for that year is beyond the scope of this study, the estimates prepared by Phares (1980) for 1976 are used after making several adjustments. These adjust-ments include (a) calculation of effective tax rate for each income group used by Phares, (b) modifying the income groups after taking into consideration inflation from 1976 to 1989, and (c) then calculating the tax-share of each income group used in our study for state- and local-revenue appropriations.10 The adjusted
tax-inci-dence estimates seem to provide a reasonable picture for 1989, especially since, largely due to the relatively con-stant tax rates and tax base, the tax reliance of the state
10See Lee (1993, pp. 51–61) for details of the procedure. He also explained that several sensitivity tests about the incidence of taxes indicate the same broad pattern.
of Illinois has remained fairly stable between 1976 and 1989.11
Allocation to each income group of the costs of appro-priations from state and local funds for undergraduate education in public institutions can now be done on the basis of the tax-incidence estimates for state and local revenues. As Table 1 shows, the total cost is 1156.12 million dollars. Out of that, an amount of 898.56 million dollars comes from the state’s general revenues, and the rest (257.56 million dollars) is from local taxes. There-fore, the former amount is allocated to each income group on the basis of the distribution of the state- tax burden, and the latter sum is allocated on the basis of the distribution of the local property tax burden. The resulting distribution is shown in Table 5.
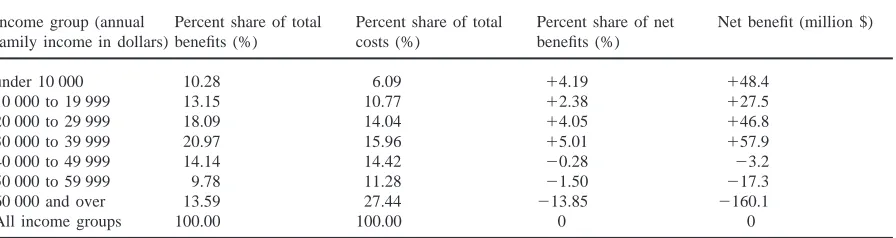
The final step is to use the distributions of benefits and costs to estimate the net benefit for each income group. This is shown in Table 6. Several points may be noted from Table 6.
First, there is a net transfer from high-income families to middle-income and low-income groups. The transfers from families whose annual income lies between $40 000 and $60 000 are relatively small, but there is a fairly large transfer from the highest-income group with an income of over $60 000.
Table 5
Distribution by income group of costs of public subsidies to undergraduate education at Illinois public higher education insti-tutions, 1989
Income group (annual subsidy from state taxes Subsidy from local taxes Total subsidy (’000$) Percent share in total
family income in dollars) (’000$) (’000$) (%)
under 10 000 46 456 23 927 70 383 6.09
10 000 to 19 999 91 384 33 173 124 557 10.77
20 000 to 29 999 126 337 35 981 162 318 14.04
30 000 to 39 999 147 274 37 191 184 465 15.96
40 000 to 49 999 135 143 31 602 166 745 14.42
50 000 to 59 999 106 569 23 876 130 445 11.28
60 000 and over 245 397 71 807 317 204 27.44
All income groups 898 560 257 557 1 156 117 100.0
Note. This is based on Table 1 and the authors’ calculations using the material reported by Phares (1980, pp. 179–272).
Table 6
Distribution by income group of the net benefits of public subsidies to undergraduate education at Illinois public higher education institutions, 1989
Income group (annual Percent share of total Percent share of total Percent share of net Net benefit (million $) family income in dollars) benefits (%) costs (%) benefits (%)
under 10 000 10.28 6.09 14.19 148.4
10 000 to 19 999 13.15 10.77 12.38 127.5
20 000 to 29 999 18.09 14.04 14.05 146.8
30 000 to 39 999 20.97 15.96 15.01 157.9
40 000 to 49 999 14.14 14.42 20.28 23.2
50 000 to 59 999 9.78 11.28 21.50 217.3
60 000 and over 13.59 27.44 213.85 2160.1
All income groups 100.00 100.00 0 0
Note. This is based on Tables 4 and 5
Second, the distribution of positive net benefits does not differ dramatically across the four income ranges. For three of these groups, the net transfer is of the order of 4% to 5% of the total benefit, and the amount of net gain lies between 47 and 58 million dollars. For families whose income lies between $10 000 and $20 000, the net transfer is smaller at 2.38% (or 27.5 million dollars). The net transfer from the highest-income group is 13.85%, which represents an amount of about 160 million dollars. In other words, the magnitude of the transfers seems sub-stantial.
Third, the pattern resembles in some respects the scen-ario in Table 3 of the study by Hight and Pollock (1973), p. 324. The middle-income and lower-middle groups gain, and the highest-income group is a net loser. How-ever, one notable difference is that while the Hight-Pol-lock study shows the poorest group to be a net loser in all the three states, our study indicates the poorest group to be a significant net gainer. Although the income groups in our study differ from those of Hight and Pol-lock, the broad categorization appears fairly similar.
The patterns noted in our study reflect a combination
of the incidence of taxes and the usage of the benefits. The tax shares rise up to a point and then fall until the highest-income group is reached. The benefit usage rises up to the middle-income group ($30 000-$40 000) and shows an erratic downward tendency thereafter.
3. Some further reflections
Table 7
Comparison of the distribution of net benefits of public subsidies to undergraduate education at Illinois public universities and community colleges, 1989
Income group State universities Public community colleges
(annual family benefit share (%) cost share (%) net benefit share benefit share (%) cost share (%) net benefit share
income in (%) (%)
dollars)
under 10 000 11.03 5.17 15.86 9.12 7.49 11.63
10 000 to 19 999 12.79 10.17 12.62 13.70 11.69 12.01
20 000 to 29 999 16.13 14.06 12.07 21.08 14.01 17.07
30 000 to 39 999 18.38 16.39 11.99 24.91 15.29 19.62
40 000 to 49 999 13.72 15.04 21.32 14.77 13.48 11.29
50 000 to 59 999 11.00 11.86 20.86 7.92 10.41 22.49
60 000 and over 16.95 27.31 210.36 8.50 27.63 219.13
All income 100.00 100.00 0 100.0 100.0 0
groups
Note. This is based on Tables 1, 4 and 5.
of varying rigor at the state universities.12Table 7 shows
the distribution of net benefits for each category. It is clear that, as may be predicted, the highest-income group is a bigger net loser in community colleges than in the universities. Its share of costs is similar in both categor-ies, but its relative participation is much lower in com-munity colleges.13 It is also interesting to note that the
net gain of the poorest group is much smaller in com-munity colleges than in universities. This may seem unexpected, but is due to the fact that (a) the poorest group bears a larger share of local taxes than of state taxes and (b) its relative participation in community col-leges is somewhat lower than in public universities. The community colleges seem to be dominated by middle-income groups who gain the most from this part of the system.14
We may also reflect a little on the reasons for the
dif-12There are other differences too. For instance, as Table 2 shows, community colleges are dominated by middle-income families. Also, a larger proportion of programs at the com-munity colleges may be more directly career-oriented. Illinois Community College Board (1990) provides information on some of these aspects.
13Note that the net loss of the highest-income group in dollar terms is 72.3 and 87.7 million dollars respectively in univer-sities and community colleges, which indicates a considerably smaller difference than the loss in percentage terms.
14If a more detailed study is done of the patterns across cam-puses with different degrees of “prestige”, it may be expected that the net gain of the lower-income groups as well as the net loss of the higher-income groups will be smaller in more prestigious campuses. The size of the total transfer may thus vary inversely with the prestige of the institution. A perceptive referee suggested that we give some consideration to this point. It seems to deserve more careful attention in future research on the topic.
ference between our results and those reported by Hight and Pollock (1973) whose methodology is similar to ours. First, we take into account direct financial aid to students, which increases the relative benefits received by low-income groups. That partly explains why, unlike what Hight and Pollock found, there is a significant posi-tive net transfer to the poorest group in our study. Although the total amount of financial aid given by the state to students is small relative to the institutional appropriations, as Table 4 shows, financial-aid recipients are concentrated in the lower-income brackets. For example, if financial aid is excluded, the net benefit of the lowest-income group is reduced by about 2.16 per-centage points, which is a reduction of more than one-half, as can be seen from Table 6. Moreover, since the pattern of net benefits depends on the structure of taxes and tax base and participation in public higher education, these may be expected to vary from state to state to some extent. For example, the tax share of the top income group in our work (Table 6) is much larger than for any of the states included in their study, although the top income groups in the two studies are fairly comparable. Similarly, the tax share of the poorest group in our study is much lower than was the case for Florida, and even for California, in the Hight-Pollock work. It seems a major reason for these differences is that the regressivity of state and local taxes in Illinois was considerably less severe than in California and Florida and even Hawaii.15
4. Concluding remarks
This work studies the redistribution effects of sub-sidies to undergraduate education at Illinois public insti-tutions of higher education in 1989. The work is mot-ivated mainly by (a) the absence of a study for Illinois, which ranks high in terms of the magnitude of expendi-ture in public higher education institutions, and (b) the desirability of refining somewhat the procedures fol-lowed in earlier studies on the subject, especially by including financial aid received directly by the students from the state.
Our main finding is that subsidies to public undergrad-uate education in Illinois imply a redistribution from high-income to middle-income and low-income families. The most significant transfer occurs from the highest-income group to families whose annual highest-income is less than $40 000. Within the latter group, net benefits are fairly evenly distributed, except for families whose income is between $10 000 and $20 000, who receive a smaller net transfer.
Five additional points may also be noted. First, the magnitude of the transfers is fairly substantial in both percentage and dollar terms. The transfers are of the order of 15.6% or about 181 million dollars. Second, while the broad pattern of distribution of net benefits across the income groups in public universities is similar to that for community colleges, the net loss of the high-est-income group is larger, and the net gain of the poor-est group is smaller, for community colleges than in the public universities. It seems that the major beneficiaries of community colleges are the middle-income families. Third, although we focus explicitly on undergraduate education at public institutions, it seems reasonable to conjecture that if all programs, including graduate and professional education, are included, the net gain of the lower- income groups and the net loss of the highest-income group will be smaller, implying a smaller magni-tude of the transfers. A similar pattern may be observed if the transfers at more prestigious state universities are considered. These two aspects appear to deserve atten-tion in future research on the subject. Fourth, although direct financial aid to the students is a small part of the total costs (and benefits), it seems to have a significant impact in improving the net benefits of the lower-income groups. Last, to the extent the persistent increase in tui-tion at state institutui-tions over the last several years may have reduced participation by low-income groups, the structure of net benefits may have changed significantly, and the equity effect of public subsidization of higher
8) indicate that, in terms of the ratio of mean incomes of the top and the bottom fifths, the four state were fairly similar in 1979.
education may have become weaker than what Tables 6 and 7 indicate.16
Acknowledgements
Two anonymous referees gave numerous useful com-ments on earlier versions. The first author acknowledges generous help from John F. Chizmar, William T. Gorrell, Anthony L. Ostrosky and David D. Ramsey during his dissertation research at Illinois State University, on which this paper is based. Maryam Arabshahi provided research assistance while the revisions were undertaken. The usual disclaimer applies.
References
American College Testing Program (1989) The ACT Class
Pro-file Report: Illinois Public Junior Colleges Composite Report, 1988–89. Iowa City.
American College Testing Program (1988) The ACT Class
Pro-file Report:Freshmen, 1988–89. Iowa City.
Baranick, S. and Shapiro, I. (1992) Where Have All the Dollars
Gone? Center on Budget and Policy Priorities,
Wash-ington, DC.
Cohn, E. (1970). Benefits and costs of higher education and income redistribution: Three comments. Journal of Human
Resources, 5, 222–226.
Gifford, A. (1970). Benefits and costs of higher education and income redistribution: Three comments. Journal of Human
Resources, 5, 227–229.
Hansen, W.L., & Weisbrod, B.A. (1969). The distribution of costs and direct benefits of public higher education: The case of California. Journal of Human Resources, 4, 176– 191.
Hartman, R.W. (1970). A comment on the Pechman-Hansen-Weisbrod controversy. Journal of Human Resources, 5, 519–523.
Hight, J.E., & Pollock, R. (1973). Income distribution effects of higher education expenditures in California, Florida, and Hawaii. Journal of Human Resources, 8, 318–330. Hines, E.R. (1990) Appropriations: State Tax Funds for
Operating Expenses of Higher Education (1989–1990).
National Association of State Universities and Land Grant Colleges, Washington, DC.
Illinois Board of Higher Education (1990) Fall 1990 Enrollments in Illinois Higher Education, Item #12.
Spring-field, IL.
Illinois Board of Higher Education (1991a) 1989-90 Academic
Discipline Unit Cost Study and 1989-90 Comparative Cost Study for Illinois Public Universities. Springfield, IL.
Illinois Board of Higher Education (1991b) Report on the Fiscal
Year 1990:Illinois Student Financial Aid Survey.
Spring-field, IL.
Illinois Community College Board (1990) Illinois Public
Com-munity College System: Data and Characteristics.
Spring-field, IL.
Illinois Student Assistance Commission (1990) ISAC Databook. Springfield, IL.
Lee, S.S. (1993) Public finance of higher education and income distribution: Some evidence from the state of Illinois. Unpublished dissertation, Illinois State University, Nor-mal, IL.
McGuire, J.W. (1976). The distribution of subsidy to students in California public higher education. Journal of Human
Resources, 11, 343–353.
Morris, C.E. et al. (1990) Assessment of the Status of Minorities
in Education: Undergraduate Inventory. Center for Higher
education, Illinois State University, Normal, IL.
Pechman, J.A. (1970). The distributional effects of public higher education in California. Journal of Human Resources, 5, 361–370.
Pechman, J.A. (1985) Who Paid the Taxes, 1966-85? Brookings Institution, Washington, DC.
Phares, D. (1980) Who Pays State and Local Taxes? Oelgesch-lager, Cambridge, MA.
Sharkansky, I. (1970). Benefits and costs of higher education and income redistribution: Three comments. Journal of
Human Resources, 5, 230–236.
State of Illinois (1989) Illinois Annual Report 1989. Comptrol-ler’s Office, Springfield, IL.
U.S. Department of Education (1992) Digest of Education
Stat-istics. U.S. Government Printing Office, Washington, DC.
Windham, D.M. (1970) Education, Equality, and Income