Markets in Pakistan
Fire artikler om handel, utlendingers direkte investeringer og markeder I Pakistan.
Philosophiae Doctor (PhD) Thesis
Burhan Ahmad
NMBU School of Economics and Business Norwegian University of Life Sciences
Ås 2014
Thesis number 2014: 24. ISSN: 1503-1667. ISBN: 978-82-575-1194-4.
I start praising and paying thanks to Almighty Allah (God) for his blessings and bestowing me the opportunity and ability to conduct my PhD studies. This has been a long and circuitous journey with ups and downs, and hard times, and Allah has imparted me the courage and patience to face them.
My studies were financed by Higher Education Commission Pakistan (HEC) and
coordinated by Norwegian Higher Education Commission (SIU). I am highly grateful to HEC for awarding me the scholarship to conduct PhD studies at NMBU School of Economics and Business, Norwegian University of Life Sciences (NMBU). I also appreciate the administrative support and cooperation of SIU.
This dissertation would not have been possible without the guidance, comments, cooperation and help of many people. First of all, I am highly grateful to my Supervisor, Associate Professor Roberto J. Garcia. His advices, guidance, critiques, and meticulous and tattered analysis of my work provided the strong foundations to my work. His training substantially improved my analytical abilities and writing skills, and advanced me in my academic life. Second, I express my sincere gratitude to Professor Ole Gjølberg. It would not have been possible to complete my dissertation without his support, guidelines, comments, instructions and critical analysis of my work. His cooperation really boosted the speed of my work.
Thanks are also due to Associate Professor Olvar Bergland for help in applying
econometrics. I extend my appreciations to Professor Gerald E. Shively, Professor Klaus Mohn, Associate Professor Genaro Sucarrat and Dagfinn Rime for their helpful comments. I am grateful to the national research school in business economics and administration (NFB) for financing my participation in FIBE conferences and to the NMBU School of Economics and Business for financing Forskemøte conferences.
All faculty members and staff at the NMBU School of Economics and Business,
Norwegian University of Life Sciences have been very kind and supportive; I express my deepest gratitude to all of them. Special appreciations are for Inger-Lise Labugt, Reidun Aasheim, Lise Thoen, Berit Pettersen and Stig Danielsen for their administrative support. My Gratitude is also due to the staff of Student Information Centre (SIT) especially Vilma Veronica Bischof and Iben Andersen for coordinating with HEC and SIU for my scholarship.
beautiful company of my past and current PhD colleagues at NMBU School of Economics and Business and friends, which I had. I am grateful to all PhD colleagues for providing a friendly environment and for fruitful discussions. Special thanks to John Herbert, Daniel, Daumantas, Kenneth, Meron, Livingstone, Thabbie, Akther Zaman, Akther-ul-AAlam, Erik and Faisal for fruitful discussions and comments. I highly appreciate the company of my friends at Ås, Yehia, Yousaf, Tahir Mehmood, Tahir Mehmood Junior, Mehmood Ayaz, Nadeem, Noor, Tahir Quraishi, Shahid Nadeem, Asif Khan, Asif, Saqib, Tanveer, Shahid Mehmood, Rizwan, Kahsif Khan, Abbas, Shakir, Abdul Samad, Shehzad, Zahid, Naveed and all the Pakistani community at Ås.
I pay heartiest thanks to my father, Nazir Ahmad and mother Majeeda Bano, in Pakistan, for their love, prayers, encouragement and patience. Love you very much, Mom and Dad. I appreciate the moral support given by my sisters, Robina and Roheena; and brothers, Imran and Rehan, and their families, in Pakistan. Thank are also due to my in-laws for their prayers and words of encouragement. Last but not the least, I express my gratitude to my wife, Maryam for her love, care, prayers and especially the words of encouragement in the times of depression. Special thanks to her for cooking and baking delicious food. Most special thanks to the smiles and innocent talks of my sweet daughter, Wardah, which used to release my tensions and tiredness. Love you so much, Wardah.
Abstract
This dissertation seeks to study aspects of economic growth and development in Pakistan that have been pursued through enhancing commodity-specific exports, attracting foreign investment and improving the functioning of commodity markets. It is comprised of four research articles. Article 1 investigates the factors affecting commodity exports and identifies markets that have unexploited export potential. Rice exports from Pakistan during 1991-2010 are taken as the example and studied using panel data and techniques. It is found that Pakistan's economic growth, importers income, export prices, specialization, the currency exchange rate and transactions costs are the major factors affecting rice exports from Pakistan. A high unexploited export potential is also found in 49 export markets out of the 92 countries. The second article measures the economic and institutional determinants of Foreign Direct Investment (FDI) inflows into Pakistan and answers why FDI has been low and uneven despite investment-friendly policies
during 1996-2010. Pakistan’s market size, governance, infrastructure, human capital, favorable
business environment and income and governance of the foreign investors are the major factors responsible for attracting foreign direct investment in Pakistan. Low economic growth, bad governance, and a lack of skilled human capital are possible reasons for low and variable net FDI inflows. Article 3 answers the question whether commodity markets such as rice are integrated domestically and with the international markets. It also examines the effects of government policies on the extent of market integration employing time series data and techniques. It is found that Pakistan’s domestic markets are integrated domestically and with the international markets. The price support policy abolition seems to have contributed to greater domestic integration,
while the subsequent export policies seem to have decreased the extent of Pakistan’s integration
with the international markets. Article 4 examines the spatial differences in volatility across regional rice markets of Pakistan using time series data and techniques. Volatility clustering is found in all markets. Volatility and its persistence differ spatially reflecting differences in infrastructure that make some regions more exposed to risk. A positive association of volatility across markets is found, and its degree is reviewed in light of market geography and
infrastructure. Overarching conclusions of this dissertation are the following: Higher productivity and economic growth, specialization, developing infrastructure and human capital, and improving institutional quality are the important factors that can contribute to the economic development of Pakistan. Investments on education and research and development, bringing in technology, improving infrastructure and institutional quality and implementing bilateral trade and investment agreements would strengthen the foundation for economic development of Pakistan through accelerating exports, foreign direct investment and improving the functioning of markets.
0 Acknowledgement
Abstract
1 Introduction ... 2
2 The Economy of Pakistan ... 5
2.1 The economy of Pakistan: A comparative view ... 5
2.2 The economy of Pakistan: A historical view ... 7
3 Exports, FDI, functioning of commodity markets and economic growth ... 15
3.1 Empirical evidence on the export-growth relationship ... 15
3.2 Empirical evidence on FDI-growth relationship ... 16
3.3 Functioning of commodity markets and economic growth ... 18
4 Data and methods ... 19
4.1 Data sources ... 20
5 Summary of the main findings ... 21
5.1 Article 1 ... 21 5.2 Article 2 ... 22 5.3 Article 3 ... 23 5.4 Article 4 ... 24 6 Conclusions ... 25 7 References ... 26
Paper1: Measuring Commodity-Specific Trade Determinants and Export Potential: A Gravity Model of Pakistan’s Rice Exports(Published)………..…..………33
Paper 2: Governance, Market size and Net Foreign Direct Investment Inflows: Panel Data
Estimation of Home and Host Country Effects (Submitted) …..………... 61
Paper 3: Are Pakistan’s Rice Markets Integrated domestically and with the International
Markets? (Submitted)……….………...………101
2
Burhan Ahmad 1 Introduction
Sustainable growth and economic development can be achieved by increasing exports and promoting foreign investment, improving the functioning of markets and through effective
government policies. In developing countries this is particularly important to raise people’s
incomes and to reduce poverty. Capital scarcity, the lack of technology, low productivity, high levels of unemployment, weak institutions, market access and poor infrastructure affect the process of economic growth and development in the developing economies (Zaidi 2005; Todaro and Smith 2012; Gov.uk 2013).
Exports facilitate the process of economic development through specialization, generating employment and enhancing income levels (Majeed et al. 2006). The export-led growth
hypothesis suggests that exports are the important driver of overall economic growth. Exports can engender positive spillovers on non-export sectors, enhance productivity, reduce foreign- exchange limitations and hence, can expand access to international markets. The literature on endogenous growth theory argues that exports can play an important role in long-run growth by bringing in new technology and through learning-by-doing from abroad (Feder 1982; Helpman and Krugman 1985; Lucas 1988; and Edwards 1992 in Ahmed et al. 2003). The Asian tiger economies are an example of the success of this growth strategy (Shirazi and Manap 2005). Foreign direct investment (FDI) can generate employment, develop human capital, bring in more advanced technology, bridge investment-savings gaps and provide necessary capital to enhance economic growth in developing economics. Well-functioning markets particularly of food
3 across seasons which benefit both producers and consumers by increasing sales and access and availability of the products. Nobel Prize winner of economics, Amartya Sen, enunciated that the main reasons for famine are the low incomes and poor market access instead of low production (Tadesse 2010). Hence, well-functioning markets can improve the allocation of resources by the economic agents and contribute to economic growth and development.
The economy of Pakistan is comprised of about 180 million people with a 47 million person labor force and is endowed with abundant natural resources. Successive governments have pursued trade liberalization and have pro-investment policies (Siddique and Kemal 2002; BOI 2013). However, the economic growth has been lower than other South-Asian countries and has been led by consumption rather than investment (Economist Intelligence Unit (EIU) 2014; World Bank 2013a; World Bank 2013b). The trade deficit has remained higher while domestic savings and investment, foreign exchange reserves, and foreign direct investment have been lower than many Asian countries. Exports are concentrated in few markets and products. The economy is also lacking good quality and appropriate infrastructure. That is, roads are of poor quality and safety, there is low productivity of transportation and an energy shortfall, particularly of electricity and natural gas (World Bank 2013b; World Bank 2013c).
This dissertation seeks to study aspects of economic growth and development in Pakistan that have been pursued through enhancing commodity-specific exports, attracting foreign investment and improving the functioning of commodity markets. It is comprised of four research articles. Article 1 investigates the factors affecting commodity exports and identifies the markets having unexploited export potential taking the example of rice exports from Pakistan during 1991-2010 using panel data and techniques. It aims at enhancing exports particularly of rice from
4 through reducing trade deficit, earning foreign exchange and generating employment. The second article measures the economic and institutional determinants of net FDI inflows into Pakistan and answers why FDI has been low and uneven despite investment-friendly policies during 1996-2010 by employing panel data and techniques. It aims at increasing FDI inflows into Pakistan which would enhance economic growth and development of Pakistan through reducing the investment-savings gap, providing capital, bringing in technology, generating employment and developing human capital. Article 3 answers the question whether commodity markets such as rice are integrated domestically and with the international markets. It also examines the effects of government policies on the extent of market integration. Article 4 is an extension of article 3 which measures the volatility in regional rice markets of Pakistan. It also examines the spatial difference in the volatility as well as measures the relationship between the volatility of geographically separated markets. Both of the articles employ time-series data and techniques. These studies on market integration and price volatility identify infrastructural bottle necks and examine policy effects on functioning of commodity markets helping in decision making regarding allocation of resources by the economic agents and policy makers and contributing to economic growth and development of Pakistan.
The rest of this chapter is comprised of four sections. Section 2 provides the comparative and historical view of the economy of the Pakistan. Section 3 presents some empirical evidences on the export-growth, FDI-growth and market functioning-growth relationships. Section 4 briefly describes the data and methods used in this dissertation. Section 5 presents the summary of main findings while section 6 concludes the dissertation.
5 Pakistan is the world’s 6th populous economy and ranks 36th with respect to area, having strategic geographical location in central and Southeast Asia. It provides low-cost labor and a large market for consumer goods (Yousaf et al 2008; EIU 2014). It is the second most urbanized country in southern Asia (World Bank 2013a). The country is endowed with natural resources such as fertile agricultural land, water resources (with one of the largest irrigation systems in the world), mining and fuel resources. However, efficient use of these human and natural resources is a major concern. The country has experienced democracy and dictatorship since its existence in 1947. The democracy index 2008, produced by the Economist Intelligence Unit (EIU), categorized it as “Hybrid Regime” and ranked Pakistan as the 108th out of 167 countries. Economic policies are aimed at liberalized trade and investment (EIU 2008, World Bank 2013a). This section provides the economic performance of Pakistan compared with other Asian countries and historical development in the economic indicators and policies indicting the importance of research on enhancing exports, foreign investment and markets.
2.1 The economy of Pakistan: A comparative view
Table 1 compares the economic growth, trade, foreign exchange reserves, savings and investment in Pakistan with other Asian countries; Bangladesh, India, Indonesia, Malaysia, Sri Lanka, Thailand and Viet Nam during the 1990s and the average over 2001-11. The intention is to compare the economic performance of Pakistan with other countries in the region particularly with the less populated than Pakistan and consider ways of improving its economic performance, e.g., by promoting exports and foreign investment and improving the functioning of markets.
6 Indicator Years Bangla-desh India Indo-nesia Malay-sia Paki-stan Sri Lanka Thai-land Viet Nam Pop. mln 1990s 121.2 964.4 195.5 21.0 128.7 18.2 59.5 72.5 2001-12 147.1 1166.2 232.6 27.1 165.6 20.1 65.9 84.7 GDP % chg 1990s 4.8 5.6 4.4 7.2 4.0 5.2 4.6 7.6 2001-12 5.9 7.1 5.4 4.8 4.1 5.6 4.2 6.5 Exports bln $ 1990s 3.9 30.1 46.1 65.7 7.7 3.8 48.5 6.9 2001-12 14.8 170.1 125.0 172.5 18.8 6.6 152.4 57.1 Imports bln $ 1990s 5.6 37.0 34.7 58.1 10.1 4.6 47.7 7.6 2001-12 16.1 199.1 83.1 111.5 23.7 7.7 112.8 50.6 Trade bal. bln $ 1990s -1.7 -6.9 11.5 7.6 -2.4 -0.8 0.8 -0.8 2001-12 -1.3 -29.0 41.9 61.0 -4.9 -1.1 39.6 6.5 Dom. sav. bln $ 1990s 5.6 86.2 50.2 33.2 9.1 2.2 46.8 4.1 2001-12 12.9 336.0 145.0 75.8 15.9 5.7 72.7 21.9 Dom. sav. % of GDP 1990s 14.1 22.9 30.2 41.8 15.6 16.3 35.0 18.1 2001-12 17.5 29.5 31.2 41.8 12.6 16.7 31.7 26.3 Dom inv. bln $ 1990s 7.8 86.6 43.2 28.1 9.8 3.3 46.4 6.6 2001-12 18.1 338.0 128.4 24.6 2.3 21.6 7.7 59.7 Dom inv. % of GDP 1990s 19.7 23.0 25.8 35.5 16.9 25.2 34.2 25.9 2001-12 24.3 29.4 25.9 22.6 15.6 24.1 25.9 30.4 Net FDI inflows (mln$) 1990s 83.5 1840.8 1593.2 4276.9 507.1 168.1 3237.9 1449.6 2001-11 619.1 19218.0 5986.7 5490.6 2365.9 434.1 7146.8 4493.0 FOREX (bln$) 1990s 2.0 24.0 18.0 40.7 2.0 1.6 29.5 2.3 2001-12 5.6 189.1 53.6 77.9 11.1 3.6 89.7 12.6
Source: World Bank 2013b
Among these selected countries, the population of India and Indonesia are larger than Pakistan
while the rest these countries are less populated than Pakistan. Pakistan’s GDP growth averaged
at about 4% in both the periods which was lower than the other Asian countries. The value of Pakistan's exports was greater than that of Bangladesh, Sri Lanka and Viet Nam during the
7 remained higher than that of Bangladesh and Sri Lanka in both period. Indonesia, Malaysia and Thailand have maintained a trade surplus. Viet Nam while a trade deficit country in the 1990s exported its way into a trade surplus during 2001-11. Foreign exchange reserves of Pakistan have also remained lower than other Asian countries except Sri Lanka. Domestic savings as a percent of GDP also remained lower than other Asian countries except Bangladesh in the 1990s. Domestic investment as a percent of GDP has also been low compared with other Asian
economies during both periods while net foreign direct investment inflows were only higher than Bangladesh and Sri Lanka. This comparison indicates that there is a high potential of in economic growth, exports and investment in Pakistan.
2.2 The economy of Pakistan: A historical view
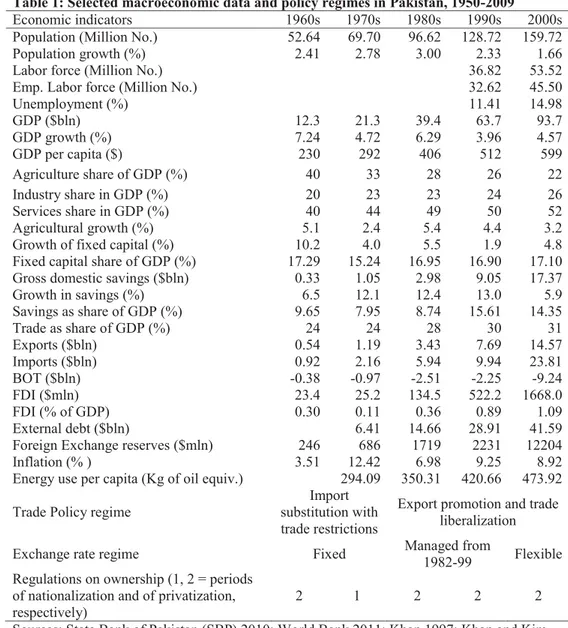
Table 2 provides the historical development in policies and different economic indicators of the economy of Pakistan. The private sector remained the main vehicle for domestic and foreign industrial investment during the 1950s and 1960s and the involvement of the public sector was restricted to three out of 27 basic industries (Khan and Kim 1999). At the start of the 1970s, the economy was largely dominated by the private sector in important areas such as banking, insurance, certain basic industries, and international trade in major commodities. Trade policies such as import quotas and tariffs protected domestic industries, which continued into the 1970s. In addition, the exchange rate was overvalued, implicitly subsidizing the inflow of imported inputs into priority areas. In the late 1960s, the government started promoting export growth by taking a number of measures to reduce the anti-export bias of the trade regime through policies such as: providing an export bonus (monetary incentive given after meeting a firm met some specific export target); preferential access to foreign exchange for firms engaged in exports; and
8 materials and consumer goods). The degree of trade liberalization was minimal (Khan 1997, Khan and Kim 1999). A sudden shift toward nationalization of private sector industrial units in
the 1970s adversely affected private investors’ confidence. However, there was an expansion in
direct investment by the public sector in new industries ranging from the basic manufacture of steel to the production of garments (Khan and Kim 1999). In the 1980s liberalization of the trade policy regime began: quotas were removed and replaced by tariffs; average tariff rates declined from 22% in 1980 to 12% in 1999; and import licensing was eliminated in 1993. These reforms created an efficient and competitive manufacturing industry through easier access to raw materials, intermediate goods and machinery and also contributed in poverty reduction (Siddique and Kemal, 2002). Price support and procurement policies had been applied for a number of agricultural commodities including staple foods, wheat and rice. However, for rice this policy ceased in 2001-02 while it is continued for wheat. Rice exports were privatized in 1989.
GDP growth has been uneven over decades in Pakistan since its birth in 1947. GDP grew at an average rate of 3.1% during the 1950s but economic growth rates have surpassed that in every decade since. GDP growth recovered to 4.6%, on average, in 2000s after the slow average growth in the 1990s at 4%. The external debt almost doubled in each decade from the 1970s to the 1990s and reached $41.6 billion in the 2000s, about 44% of GDP. Foreign exchange and gold reserves increased from $0.26 billion in the 1950s to $12.2 billion in the 2000s, but remained insufficient to finance imports and the external debt. Inflation hit a 30-year high in 2008 at 20%, which can be attributed to the global financial crisis 2007-08 and the international price surge for a number of commodities. However, in the late 1990s and the early 2000s there were the periods with relatively low inflation.
9 Economic indicators 1960s 1970s 1980s 1990s 2000s Unemployment (%) 11.41 14.98 GDP ($bln) 12.3 21.3 39.4 63.7 93.7 GDP growth (%) 7.24 4.72 6.29 3.96 4.57 GDP per capita ($) 230 292 406 512 599 Agriculture share of GDP (%) 40 33 28 26 22 Industry share in GDP (%) 20 23 23 24 26 Services share in GDP (%) 40 44 49 50 52 Agricultural growth (%) 5.1 2.4 5.4 4.4 3.2
Fixed capital share of GDP (%) 17.29 15.24 16.95 16.90 17.10
Gross domestic savings ($bln) 0.33 1.05 2.98 9.05 17.37
Savings as share of GDP (%) 9.65 7.95 8.74 15.61 14.35 Trade as share of GDP (%) 24 24 28 30 31 Exports ($bln) 0.54 1.19 3.43 7.69 14.57 Imports ($bln) 0.92 2.16 5.94 9.94 23.81 BOT ($bln) -0.38 -0.97 -2.51 -2.25 -9.24 FDI ($mln) 23.4 25.2 134.5 522.2 2407.5 FDI (% of GDP) 0.30 0.11 0.36 0.89 1.09 External debt ($bln) 6.41 14.66 28.91 41.59
Foreign Exchange reserves ($mln) 246 686 1719 2231 12204
Trade Policy regime
Import substitution with trade restrictions
Export promotion and trade liberalization
Exchange rate regime Fixed Managed from
1982-99 Flexible
Regulations on ownership (1, 2 = periods of nationalization and of privatization, respectively)
2 1 2 2 2
Sources: State Bank of Pakistan (SBP) 2010; World Bank 2011; Khan 1997; Khan and Kim 1999; Hyder and Mehboob 2006
The transformation from primarily an agricultural economy in the 1950s, when
agriculture’s share of GDP averaged 48%, towards an industry- and services-based economy has been on a steady march. Industry’s share of GDP doubled from 13% in the 1950s to 27% in
2000s and services’ share increased from 38% to 53%. The agricultural sector’s rate of growth
has persistently been slower than GDP growth and the rates of growth have decreased since the 1980s. Despite the economic transformation that has occurred, the major industrial export sub-sector is textile manufacturing which is dependent on agriculture, reflecting the economy’s agro -industrial composition. The agricultural sector contributed to about 23% of GDP, employed about
10 (GoP 2013; SBP 2010). However, yield growth of major crops has remained slow since the 1960s (World Bank 2013a).
Apart from the 1950s, Pakistan is a trade deficit country and this deficit has been
increasing over decades. The trade deficit increased from about $2.25 billion in the 1980s and the
1990s to $9.24 billion in the 2000s. Pakistan’s major exports have been concentrated in a few
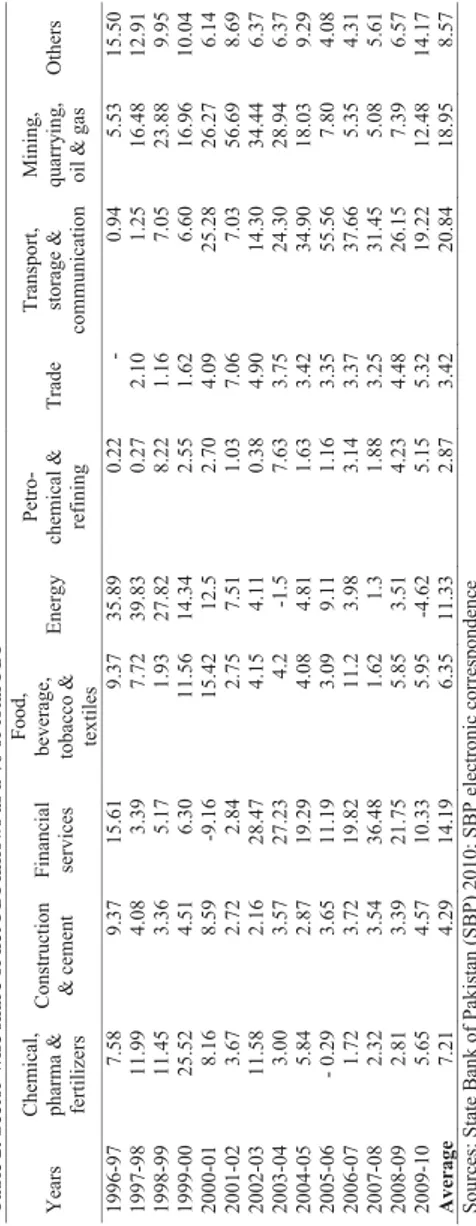
export items, comprised mostly of cotton manufactures, rice, leather, fish and fish preparations and sporting goods. Table 3 provides decade-wise share of exports of these major commodities as a share of the total value of exports from Pakistan. During the 1960s, these commodities
contributed to about 39% of the total value of exports from Pakistan while this share almost doubled to 70% in the 1970s and then decreased to 62% in the 1980s. Textile manufacturers have been the biggest exports items ranging from 59.5% to 64.5% of total value of exports during the
1990s and 2000s. Rice has remained Pakistan’s second largest export item after cotton and cotton
products and contributes (SBP 2010). The share of rice exports in the total value of exports of Pakistan increased from 5% in the 1960s to 18% in the 1970s (SBP 2010). This can be attributed to the green revolution in the 1960s and the increase in supply of water in the early 1970s. This share steadily decreased from 10% and to 6% in the 1980s and 1990s, respectively, before recovering slightly to 8% in the 2000s (UN FAO 2012; GOP 2013). Nevertheless, it captures a large share of almost two-thirds of the value of exports of all primary commodities. Rice production accounts for almost 6% of the value added in agriculture, while contributing to 1.3% of GDP (SBP 2010; UN FAO 2012; GOP 2013).
11
Exports 1960s 1970s 1980s 1990s 2000s
Fish & Fish Preparations 3.02 2.58 2.57 1.88 1.20
Rice 4.80 18.12 10.04 5.71 7.81
Cotton 11.80 10.19 13.37 3.03 0.58
Leather 3.31 5.39 5.31
Textile Yarn and Thread 5.06 12.37 11.83 16.38 8.07
Cotton Fabrics 5.37 12.40 10.61 13.36 11.64 Sports Goods 0.72 1.50 1.59 3.06 2.09 Sub-total 34.08 62.55 55.32 43.41 31.39 Other Commodities 65.92 37.45 44.68 56.59 68.61 Total 100.00 100.00 100.00 100.00 100.00 Primary Commodities 13.56 12.47 Textile manufactures 64.49 59.50 Other manufactures 14.14 18.44
Source: State Bank of Pakistan (2010)
In addition to Pakistan’s exports being concentrated on a few products, the markets to which they are exported are also concentrated indicating potential to identify and explore more markets to increase exports. The US, the UK, Germany, France, Japan, China, Hong Kong, Kuwait and Saudi Arabia have been the major export markets since 1960s. Table 4 exhibits shares of major export markets of Pakistan in total value of exports of Pakistan. These markets
accounted for between 45-48% of the total value of Pakistan’s exports from the 1960s through
the 1980s. This share increased to 50% on average during the 1990s and the 2000s. The UAE, Italy and Netherlands are the other major markets. These markets, together with the UAE, Italy and the Netherlands, amounted to 62% of the total value of Pakistan's exports. The US alone has remained the single biggest market for the last two decades, capturing a share of between 17% and 23%. This share increased from 10% in the 1960s (SBP 2010). The concentration of Pakistan’s exports in few markets and fluctuating behavior reflects the lack of success in identifying and exploring new markets as well as sustaining the existing markets.
12 1960s 1970s 1980s 1990s 2000s USA 9.74 5.64 10.75 17.02 23.28 France 3.32 2.22 3.03 3.49 2.43 Germany 3.88 5.18 2.88 5.70 4.76 UK 13.19 6.74 6.18 6.94 6.18 China 4.61 2.61 2.74 1.34 3.14 Hong Kong 4.84 8.73 3.86 7.15 4.23 Japan 6.01 9.00 9.78 6.07 1.26 Kuwait 1.17 2.02 1.17 0.53 0.54 Saudi Arabia 1.08 4.47 4.87 3.12 2.71 Sub-Total 47.84 46.61 45.26 51.36 48.52 Singapore 1.22 0.55 UAE 4.19 7.92 Italy 4.01 3.26 Netherlands 3.13 2.53 Total 63.90 62.77
Source: Source: State bank of Pakistan (2010)
Domestic investment and savings have been low and fluctuating over the decades. The share of gross fixed capital formation as a percent of GDP was about 17% from the 1980s through the 2000s, an improvement over the 1970s, but still a low rate given the stage of Pakistan’s development. The national savings rate has been low amounted to about 15% of GDP through the 1990s and the 2000s. The low savings rate might be due to high consumption and low income. The low domestic savings and capital formation reflect the need for foreign investment (Zaidi 2005; SBP 2010; GOP 2013; World Bank 2013b) to boost GDP growth but also address rising unemployment rates that have crept up to 15% in the 2000s from about 11% in the 1990s. FDI could be an important instrument to overcome many of the structural weaknesses necessary for transition towards sustainable growth and development. Probably the most important role of FDI in a developing economy is the supply of capital, as the deficiency in the capital stock is a fundamental problem (Zaidi 2005, Khan and Kim 1999).
13 base, 0.30% of GDP in the 1960s, reaching 1% of GDP in the 2000s (SBP 2010). Trends on net inflows of FDI into Pakistan present a fluctuating picture. Regulations on investment were liberalized in the 1990s; however, the rate of investment increased after 2001 when the US allied itself with Pakistan to fight its war on terror (Khan and Khan 2011). The Board of Investment (BOI) was the main agency to help government in formulating investment-friendly policies. The BOI has recently formulated the Investment Policy 2013 that has set out a target of 25% annual growth in FDI inflows into Pakistan.
The five major source countries of FDI are Netherlands, Switzerland, the USA, the UK,
and the UAE, which account for about 62% of total net FDI inflows into Pakistan during 1996-2010. The USA alone accounts for about 24% of total net FDI inflows into Pakistan while UAE and the UK capture 15% and 13% of net FDI inflows into Pakistan. The USA, UK and UAE are also the major sources of FDI as mentioned earlier (SBP 2010).
Major cities/markets in Pakistan are Karachi, Lahore, Islamabad, Rawalpindi, Faisalabad, Peshawar, Quetta, Sukhar and Hyderabad in the four provinces of Pakistan. Peshawar (1.3 million inhabitants) and Quetta (0.8 million) are the provincial capitals of Khyber Pakhtoonkhan and Baluchistan provinces, respectively. Rawalpindi (1.8 million) is the neighbor city of the provincial capital of Pakistan, Islamabad. Hyderabad (10.4 million) is located close to Karachi, the provincial capital of Sindh and a port city. Sukhar (0.4 million) is located in Sindh province close to Hyderabad and also to Multan (1.55 million), Hyderabad and Sukhar are located relatively close to the major rice production regions, while Quetta and Peshawar are relatively remote. Rawalpindi lies between Multan and Peshawar but is closer to Peshawar. Peshawar is
14 Afghanistan. Both countries are among the largest markets for rice exports from Pakistan.
These markets are connected with national highways and motorways. Road infrastructure has improved in Pakistan as paved roads increased from about 53% of total roads in 1991 to about 72% of total roads in 2010. This percentage of paved roads is greater than in China, India, Indonesia, and Viet Nam and less than Thailand and Malaysia. Thailand had 99% paved roads in 2000 while 80% of total roads were paved roads in Malaysia in 2010 (World Bank 2013b). However, about half of the national highways are in poor conditions in Pakistan and poor road safety is a major concern along with low productivity of the transportation system. Trucks usually travel at a speed of 40-50 km per hour which is half of the speed in Europe. This low speed is mainly because of overloaded trucks and poor quality of vehicles. Railway freight accounts for about 5% of total freight services indicating a low productivity. Pakistan’s railways freight productivity is 8 times less than that of China, 3 times of India and 2 times less than that of Thailand (World Bank 2013c). The economy suffers periodic energy shortfalls, particularly of electricity and natural gas that results in several hours of load shedding each day, adversely affecting domestic households and industries (World Bank 2013a).
Given the description of comparative and historical perspectives of Pakistan, there can be many ways to enhance economic growth and development of Pakistan, however, this dissertation focuses on enhancing economic growth and development through increasing exports and foreign direct investment and improving functioning of the commodity markets. The following section reviews some literature on the relationship between exports, FDI and market functioning with economic growth particularly on Pakistan.
15
3.1 Empirical evidence on the export-growth relationship
The export-growth relationship has been the topic of many studies; however, there is no general consensus on this relationship / causality between exports and economic growth in the literature. This is partly due to data and methods used in these studies (Dreger and Herzer, 2013). Similarly, literature on the export-growth relationship presents mixed results for the case of Pakistan. Khan and Saqib (1993); Khan et al. (1995); Anwar and Sampath (2000) and Kemal et al. (2002) found bidirectional causality between exports and economic growth in the case of Pakistan. Din (2004) found a long- run relationship between exports, imports and economic growth for two economies of southern Asia, Pakistan and Bangladesh; however, he did not find such a relationship for three other countries in the region, India, Sri-Lanka and Nepal. Shirazi and Manap (2004) examined the export-led-growth hypothesis for Pakistan and found evidence for a long-run association among exports, imports and real output. They also found bi-directional causality between import and economic growth and unidirectional causality between exports and economic growth. Quddus and Saeed (2005) and Siddiqui et al. (2008) also found support for the hypothesis for Pakistan. Samiullah et al. (2009) found support for the hypothesis and concluded that increased exports led to economic growth. They also found a unidirectional causality among exports, imports and economic growth. Lee (2010) tested the export-led and import-led hypothesis for Pakistan but he neither found support for the export-led hypothesis nor for import-led hypothesis of growth in the long-run; however, there was support for bidirectional causality between exports, imports and growth in the short run. Ismail et al. (2010) found positive and significant effects of exports and investment and negative effects of inflation on growth in short and long run in the case of Pakistan. However, exports were found to be insignificant in the long run and they
16 (2010) do not find any evidence for export-led growth hypothesis as well as causality among growth-exports and growth-imports but they found bidirectional causality in import-export in their study on Pakistan. They also found negative effects of income shocks on exports as well as imports and more variation in imports relative to exports due to changes in income. However, the effects of exports on income and imports were moderate. Imports caused more variation in exports compared with income.
These differences in results can be attributed to data and methods used in these studies. However, given the theoretical importance of exports in the economies of developing countries such as Pakistan and the need for foreign exchange to finance imports and the external debt, empirical research is necessary. The first research article in this dissertation investigates factors affecting commodity-specific exports from Pakistan to identify markets with unexploited export potential. This is done by taking the example of rice. GDP and exports are treated as endogenous because of possible bi-directional causal relationship.
3.2 Empirical evidence on FDI-growth relationship
The theory and the empirical literature lack a consensus on the costs and benefits of FDI inflows. Arguments in favor say that FDI plays a key role in the development process of a country if the recipient country has attained a certain level of development such as a minimum level of education, technology and infrastructure. The counter-argument is that some costs are too high, such as the deterioration of the balance of payments as profits are repatriated back to the foreign investor’s home country, the exploitation of labor or the non-transparent management of national resources by foreign multinational or the ability of the government to properly supervise their actions (Hansen and Rand, 2006).
17 These studies found positive as well as negative effects of FDI on economic growth in Pakistan and both unidirectional and bi-directional causality. Ahmad et al. (2003) found a long-run relationship among FDI, exports and domestic output and found support for the export-led growth hypothesis and significantly positive effects of FDI on domestic output. Klasra (2011) studied the relationship between growth, FDI and trade openness in Pakistan and Turkey during 1975-2004 by using a bound testing co-integration approach. He found bi-directional association between exports and trade openness and argued that adoption of a more liberal attitude to imports and foreign investments fostered domestic competition through efficient allocation of domestic resources and also enhanced the economy’s productivity and local firms’ export competitiveness. Iqbal et al. (2010) found a long-run relationship among the factors and bi-directional causality between FDI, exports and economic growth with a positive impact of FDI on growth. Mughal (2008) found positive effects of FDI on growth rates in the short term but also found a less important role of FDI compared with domestic investment with negative effects of FDI on human capital. He concluded that FDI had neither been an absolute boon nor a downright bane for growth. Falki (2009) examined the impact of FDI on economic growth of Pakistan during 1980-2006 through applying OLS on the (aggregate) production function under endogenous growth theory. He found a negative and statistically significant impact of FDI on economic growth. He suggested that green-field investment and FDI in the manufacturing sector should be encouraged so that exports can be increased, which, in turn, enhance growth. Khan and Khan (2011) found a positive effect of FDI on output and causality running from GDP to FDI in the long run while in the short run a two-way causality between FDI and GDP was evident in the case of Pakistan. Moreover, they argued that FDI caused growth in the primary and services sectors, while growth attracted FDI in the manufacturing sector.
18 used. However, given the theoretical importance of FDI in the development of the economies of developing countries (e.g., providing capital to fill the investment-savings gap, bringing in technology, developing human resources and generating employment) article 2 focused on determining the economic and institutional factors related to Pakistan and home countries that can affect the FDI inflows into Pakistan.
3.3 Functioning of commodity markets and economic growth
Market integration and volatility are two important concepts regarding the functioning of commodity markets. Market integration can be defined as a measure of the extent to which demand and supply in one location are transmitted to another (Negassa et al., 2003). Spatial market integration refers to both short-term co-movements and long-run relationships among prices. It is defined as the smooth transmission of price signals and information across
geographically separated markets (Goletti et al., 1995). Well-functioning commodity markets and price transmissions play an important role in efficient resource allocation and economic growth. Slow and imperfect price transmissions leave producers and consumers to make decisions based on prices that do not reflect their real social costs and benefits, leading to slow economic growth (World Bank, 2012a).
In the same vein, less volatile markets promote efficient decisions by the economic agents regarding allocation of resources and hence enhancing economic growth. Primary products or exports are subject to greater price volatility, which negatively affects economic growth. Blattman, Hwang and Williamson (2007) found that countries dependent on commodities with relatively low price volatility enjoy more rapid growth, more foreign direct investments and less volatile terms of trade as opposed to countries specializing in more volatile commodities. Even
19 with price booms and real exchange rate appreciations. Sachs and Warner (1995) find that commodity price volatility leads to volatility of output growth, which is more pronounced in economies with large share of natural resources. To our knowledge, empirical evidence on the relationship between market functioning and economic growth is lacking in the case of Pakistan, hence, this is a potential area for research.
4 Data and methods
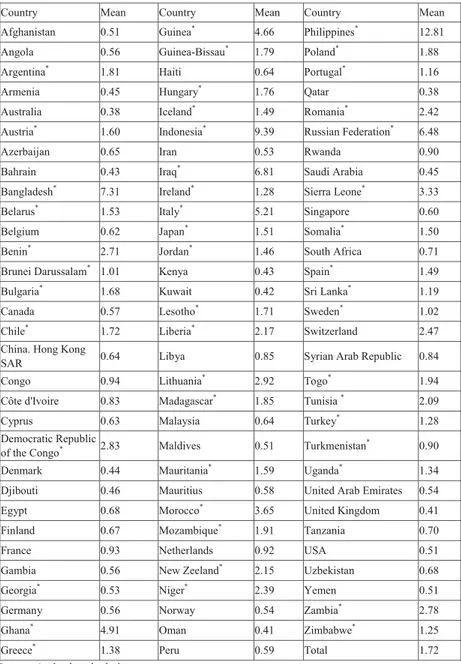
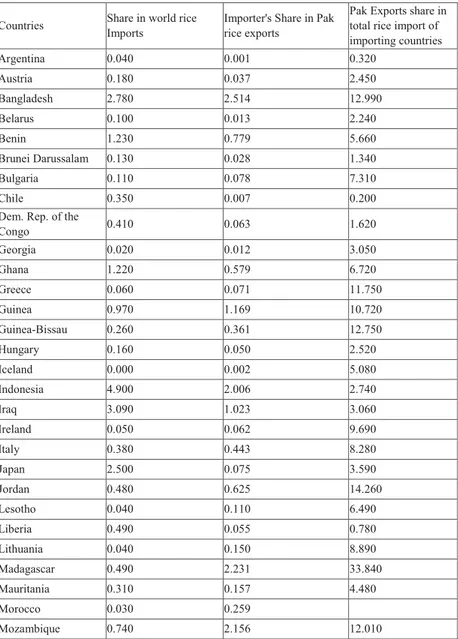
Article 1 used panel data and employed pooled regression, fixed effects, random effects and Hausman-Taylor estimation techniques. In this article, the dataset spans 92 countries that make up about 84% of total rice volume exported from Pakistan, on average, during 1991-2010. The analysis is done under the framework of the gravity model. The gravity model has performed well when used to analyze international trade flows since the early 1960s, but strong theoretical foundations were not produced until the end of the 1970s. Among others, Anderson (1979); Bergstrand (1985, 1989); and Deardorff (1998) provided the theoretical foundations of the gravity model through deriving it from various economic theories.
The gravity model has been the most popular approach employed to predict the
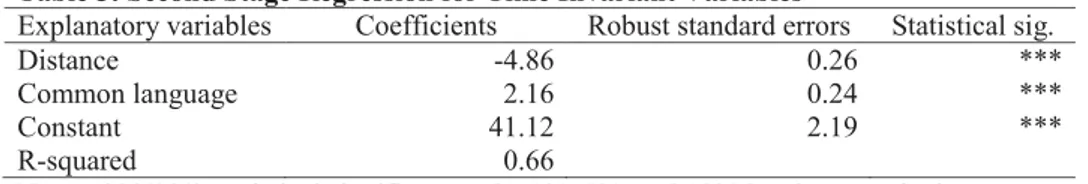
international trade flows (Abler 2007). However, its application to Pakistan has been very limited and at aggregate exports e.g. Butt (2008), Gul and Yasin (2011). There is no application on rice exports from Pakistan. The dependent variable is rice export volume from Pakistan to 92 markets. Explanatory variables include real GDPs and per capita GDPs of Pakistan and of respective export markets, unit export prices in these markets, exchange rate of Pakistani rupee to each export market’s currency, the distance between the capital cities and a dummy variable for common history of British colonization.
20 countries) that accounts for about 77% of total net FDI inflow into Pakistan, on average, during 1996-2010. This is the dependent variable in the regression model. The explanatory variables included in the model are the GDPs of Pakistan and of home countries, an average of the governance indicators of Pakistan and home countries (which include: the rule of law; political stability and terrorism; voice and accountability; government effectiveness; and regulatory quality), human capital, energy use per capita, the distance between capital cities and dummy variables for common language and bilateral investment treaties between Pakistan and home countries.
Articles 3 and 4 employed time series data for rice prices in the regional markets of Pakistan and in the international market. Stationarity and co-integration test were performed and vector error correction models (VECM) were estimated. Analysis in the article 4 was enhanced to include variance tests; moving window of standard deviations of differenced log prices;
autoregressive conditional heteroscadisticity (ARCH), generalized autoregressive conditional heteroscadisticity (GARCH), and dynamic conditional correlations (DCC) model which is a simple class of multivariate GARCH models to model volatility in prices.
4.1 Data sources
The data in all the articles are taken from secondary sources which include the Handbook of Statistics for Pakistan 2010 available at the Central Bank’s on-line database (SBP 2010), Kaufmann et al. (2010), World Development Indicators, available on the online database of the
World Bank (2011, 2013b), World bank’s pink sheet (World Bank 2012a), web pages of the
central intelligence agency (CIA 2013); travel distance calculator between Cities” under the
21 Development on-line database (UN CTAD 2012); the web pages of the Commonwealth
Organization (Common Wealth 2011); Agricultural Statistics of Pakistan (GoP, 2012) and exchange rate data under Oanda's website (2012).
5 Summary of the main findings
5.1 Article 1
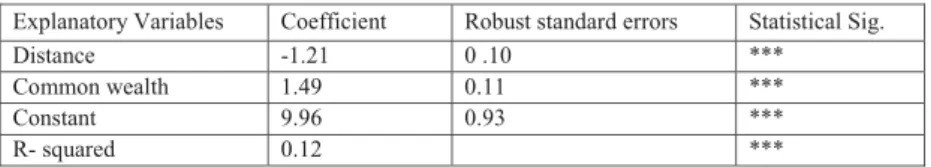
The real GDP of Pakistan and unit export prices are modeled as endogenous variables using the Hausman-Taylor estimation technique for panel data. Both of these variables have the expected positive sign and are statistically significant at the 1% level. The real GDP of Pakistan is strongly elastic (3.56) on export supply while price elasticity is unitary. The negative and statistically significant coefficient on Pakistan’s real per capita GDP illustrates that rice exports are labor -intensive and follows the Hecksher-Ohlin explanation of trade, strengthening the case for greater specialization in rice production.
The exchange rate is also found to be positively and significantly affecting rice exports from Pakistan. The distance between partner countries was used as a proxy of transportation costs is also statistically significant having a negative effect on trade and common British historical ties have positive and significant effect on rice exports from Pakistan. The poor infrastructure in developing countries, e.g., in African markets, could be a factor that limits Pakistan’s short-term ability to exploit potential in those markets.
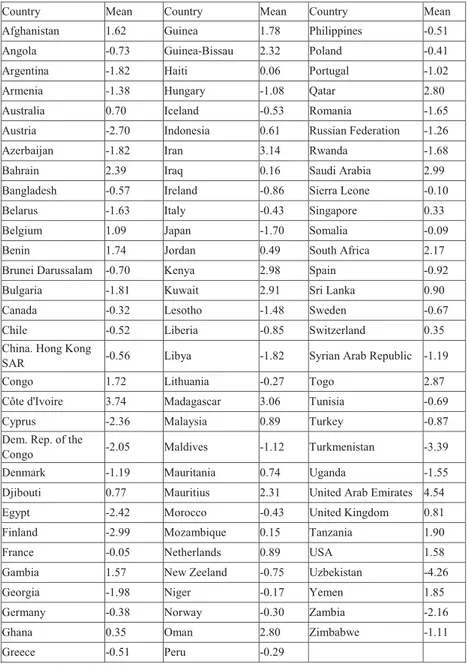
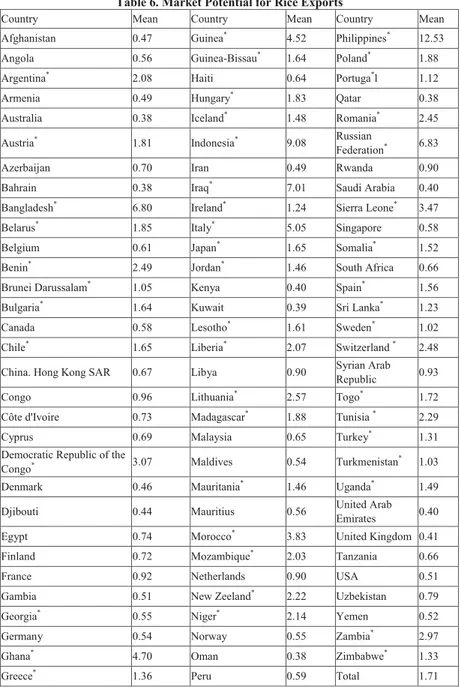
There is unexploited potential of Pakistan’s rice exports in 49 export markets out of the 92 which includes emerging and developed economies and some of them impose high tariffs on rice exports from Pakistan. Unexploited potential in these markets can be exploited through
22 countries and better marketing efforts. An increase in rice exports will also help in reducing the trade deficit of the country and earn more foreign exchange, which will help in financing the country’s imports and paying its foreign debt.
5.2 Article 2
The estimates of GDP and governance in Pakistan are positive and statistically significant factors affecting net FDI inflows into Pakistan. Human capital positively and significantly affects the FDI inflows into Pakistan. A positive and statistically significant relationship between the per capita energy use and net FDI inflows into Pakistan is also found. Positive and statistically significant estimates of GDP and governance of investing countries suggest that these would create a favorable environment for increasing FDI inflows into Pakistan. Significant negative and positive coefficients on the distance and common language between partner countries
respectively suggest that reducing the cost of and improving the ease of doing business would attract more FDI into Pakistan.
According to the results, it can be stated that despite investment-friendly policies being pursued in Pakistan, low and uneven economic growth of Pakistan, bad governance, the lack of skilled human capital, energy crises and global financial crises are the possible reasons for the uneven and low level of net FDI inflows into Pakistan during 1996-2010. Hence, raising GDP and improving good governance, increasing the share of the budget on education and research and development, overcoming the energy crisis, would play an important role in getting investor’s confidence and attracting FDI.
The findings of the study support polices, under the investment policy 2013, of providing ease and reducing cost of doing business in Pakistan through establishing industrial zones and
23 practice of the BOI's role; however, there is gap in the policy regarding improving the quality of institutions and good governance which are very important to uplift investors' confidence and to attract FDI into Pakistan. The Investment Policy of 2013 sets out a target of 2.5 billion of FDI inflows in 2014 and 25% annual growth which can be achieved with about 2.5% increase in GDP, energy use, human capital and quality of institutions in Pakistan.
5.3 Article 3
The results from the EG and Johansen tests for co-integration strongly indicate that all the
domestic markets are cointegrated, possibly excepting Hyderabad–Peshawar, Hyderabad–
Rawalpindi, Hyderabad–Multan and Hyderabad–Quetta indicating infrastructural bottlenecks in
the marketing system. The VECM estimates of the domestic markets reveal that prices converge in the long run; however, the speed of adjustment towards long-run equilibrium is generally low. The long-run coefficient varies from 0.89 to 1, revealing that about 90 to 100% of price changes are transmitted across different pairs of the markets in the long run. The ending of the support price policy seems to have resulted in an improvement in the integration of domestic markets as the number of non-integrated market pairs decreased after 2002.
All the domestic markets in Pakistan appear to be integrated with the international market, with the possible exception of Hyderabad and Sukhar, although the speed of adjustment is rather low. The estimated coefficients of adjustments indicate that the domestic markets tend to converge with the international market in the long run. The long-run elasticity of price
transmission ranges from 0.68 to 0.98 across markets, suggesting that 68–98% of changes in the
international price are transmitted to domestic prices in the long run. Among the export markets for rice, Pakistan’s rice markets seem to be integrated with the markets of Thailand and Vietnam.
24 with, and responsive to, changes in the international market and domestic markets,
responsiveness to own (local) shocks is relatively higher. Support price policy reforms have improved market integration within Pakistan; however, they do not seem to have affected the integration of Pakistan with the international market, while export policies have reduced the extent of market integration of Pakistan with the international market. Therefore, it is reasonable to conclude that reducing government intervention would increase international market
integration further. Investment on infrastructure between non-integrated markets can help them to integrate.
5.4 Article 4
A clear rising trend in volatility particularly after the food crisis during 2007-08 is observed while differences exist across markets. The results of variance tests also exhibit spatial differences in volatility across markets. In general, distant markets show statistically significant differences in variances while closer markets have statistically equal variance. Multan, Rawalpindi and Quetta contain only ARCH effects while Peshawar, Hyderabad and Sukhar possess both ARCH and GARCH effects.
Positive conditional correlations in dynamic conditional correlation (DCC) model reveal that volatility in one market is positively associated with the other across regional rice markets of Pakistan. Moreover, high and low correlations were found between closer and distant markets, respectively. Differences in behavior of volatility across markets reflect differences in infrastructure, transportation and communication services. Given the poor quality of national highways, slow driving freight vehicles and inefficient railway freight, investments on
25 volatile environment resulting in increase in the inventories that in turn can negatively affect food security. Maintaining buffer stocks might help to control volatility particularly due to a high surge in prices such as during the food crisis of 2007-08.
6 Conclusions
Pakistan's economic growth, importers income, export prices, specialization, the exchange rate and transactions costs are the major factors affecting rice exports from Pakistan. Whereas, Pakistan’s market size, governance, infrastructure, human capital, promising business environment and income and governance of the foreign investors are the major factors
responsible for attracting foreign direct investment in Pakistan. Most of Pakistan’s rice markets are integrated domestically and with the international market. Termination of price support policy enhanced the domestic market integration while export policies reduced integration of domestic markets with the international markets. Rice prices are volatile and volatility differs across markets reflecting bottlenecks in the infrastructure and transportation.
Higher productivity and economic growth, specialization, infrastructure development through improving road and rail freight system and overcoming energy crisis, developing human capital, and improving institutional quality are the important factors that can contribute to the economic development of Pakistan. Investments on education and research and development, bringing in technology, improving infrastructure and institutional quality and implementing bilateral trade and investment agreements would strengthen the foundation for economic development of Pakistan through accelerating exports, foreign direct investment and improving the functioning of markets.
26 Abler, D. 2007. “Approaches to Measuring the Effects of Trade Agreements”. Journal of
International Agricultural Trade and Development 3 (2):155-171
Ahmad, M.H., Alam, S., and Butt, M.S. 2003. “Foreign Direct Investment, Exports, and Domestic Output in Pakistan”. The Pakistan Development Review 42(4): 715-723. Anderson, J.E. 1979. "A Theoretical Foundation for the Gravity Equation." American Economic
Review 69 (1):106-116.
Anwar, M. S., Sampath, R.K. 2000. “Exports and Economic Growth”. Indian Economic Journal pp: 79-88.
Atique, Z., Ahmad, M.H., Azhar, U., and A.H. Khan. 2004. “The Impact of FDI on Economic
Growth under Foreign Trade Regimes: A Case Study of Pakistan”. The Pakistan
Development Review 43(4): 707-18.
Bergstrand, J.H. 1985. "The Gravity Equation in International Trade: Some Microeconomic Foundations and Empirical evidence." The Review of Economics and Statistics 67(3):474-481.
Bergstrand, J.H. 1989. "The Generalized Gravity Equation, Monopolistic Competition, and the Factor-Proportions Theory in International Trade." The Review of Economics and Statistics 71(1):143-153.
Blattman, C., Hwang, J., and Williamson, J.G. 2007. “Winners and losers in the commodity
lottery: The impact of terms of trade growth and volatility in the Periphery 1870–1939”.
Journal of Development Economics 82 (2007): 156-179.
Butt. 2008. "Pakistan's Export Potential: A Gravity Model Analysis." Working Paper Series No. 23, State Bank of Pakistan.
http://www.sbp.org.pk/publications/wpapers/2008/wp23.pdf
Chemical-ecology, 2012. http://www.chemical-ecology.net/java/capitals.htm Chemical-ecology, 2013. http://www.chemical-ecology.net/java/capitals.htm
CIA (2013) Languages. Central intellegence agency (CIA). https://www.cia.gov/index.html Deardorff, A. 1998. “Determinants of Bilateral Trade: Does Gravity Work in a Neoclassical World?” In: The regionalization of the world economy. Edited by J. Frankel. Chicago University of Chicago Press, pp. 7-29.
Din, M. 2004. “Exports, Imports, and Economic Growth in South Asia: Evidence Using a
Multivariate Time-Series Framework”. The Pakistan Development Review. pp: 105-124.
Dreger, C., & Herzer, D. (2011). “A Further Examination of the Export-Led Growth hypothesis”. Empirical Economics, 1-22.
Edwards, S. 1992. Trade Orientation, Distortion and Growth in Developing Countries. Journal of Development Economics 39, 31–57.
Falki, N. 2009. “Impact of Foreign Direct Investment on Economic Growth in Pakistan”. International Review of Business Research Papers 5:110-120
27 73.
G.o. Pakistan. 2010. “Economic Survey of Pakistan”. Economic Affairs Wing, Finance Ministry, Islamabad.
G.o. Pakistan. 2012. “Economic Survey of Pakistan: Various Issues”. Economic Affairs Wing, Finance Ministry, Islamabad, Pakistan.
Goletti, F., Ahmed, R., Farid, N. 1995. “Structural Determinants of Market Integration: The Case
of Rice Markets in Bangladesh”. Developing Economies, 33(2), 196–198. GOV.UK. 2013. 2Helping Developing Countries' Economies to Grow”. Department for
international and HM Treasury.
developing- countries-economies-to-grow
Government of Pakistan (GoP), 2011. Economic Survey of Pakistan (2010–11). Economic
Advisor’s Wing, Finance Ministry, Islamabad.
Government of Pakistan (GoP), 2012. Agricultural Statistics of Pakistan (2010–11). Federal
Bureau of Statistics of Pakistan.
Gul, N. and Yasin, H.M. 2011. " The Trade Potential of Pakistan: An Application of the Gravity Model." The Lahore Journal of Economics 16(1):23-62.
Hansen, H., and Rand, J. 2006. “On the Causal Links between FDI and Growth in Developing
Countries. The World Economy 29(1): 21-41.
Helpman, E., and Krugman, P.R. 1985. “Market Structure and Foreign Trade”. Cambridge: MIT Press.
Hyder, Z., and A. Mahboob. 2006. “Equilibrium Real Effective Exchange Rate and Exchange rate Misalignment in Pakistan.” State Bank of Pakistan. Research bulletin no.2 pp 238
263. http://www.sbp.org.pk/research/bulletin/2006/Equilibrium_Real_Effective_
Exchange_Rate.pdf
Iqbal, M. S., Shaikh, F. M., & Shar, A. H. 2010. Causality relationship between foreign direct investment, trade and economic growth in Pakistan. Asian social science, 6(9): P82. Ismail, A., Zaman, K., Atif, R.M., Jadoon, A., and Seemab, R. 2010. The role of Exports,
Inflation and Investment on Economic Growth in Pakistan. International Journal of
Economics and Resources 1: 1-9.
Kaufmann D, Kraay A, Mastruzzi M. 2010. “The Worldwide Governance Indicators: Methodology and Analytical Issues. World Bank Policy Research Working Paper,
5430. http://papers.ssrn.com/sol3/papers.cfm?abstract_id=1682130
Kemal, A.R., Din, M., Qadir, U., Lloyd, F., and Sirimevan, S.C. 2002. “Exports and Economic Growth in South Asia”, A Study Prepared for the South Asia Network of Economic
Research Institutions.
Khan, A. H. 1997. “Foreign Direct Investment in Pakistan: Policies and Trends”. Pakistan Development Review 36(4): 959-983.
Khan, A.H., and Kim, Y.H. 1999. “Foreign Direct Investment in Pakistan: Policy Issues and
28 International Economic Journal, pp: 53-64.
Khan, A.H., Malik, A., and Hasan, L. 1995. “Export Growth and Causality: An Application of
Co-Integration and ECM Model”. The Pakistan Development Review, pp 145-161. Khan, M. A., & Khan, S. A. 2011. Foreign direct investment and economic growth in
Pakistan: a sectoral analysis. PIDE-working papers, 2011:67.
Klasra, M.A. 2011. “Foreign Direct Investment, Trade Openness and Economic Growth in Pakistan and Turkey: An Investigation using Bounds Test”. Quality & Quantity 45(1):223-231.
Lee, C.G. 2010. “Exports, Imports and Economic Growth: Evidence from Pakistan”. European Journal of Scientific Research 45:422-429.
Lucas, R.E. 1988. “On the Mechanics of the Economic Development”. Journal of Monetary Economics 22, 3–42.
Majeed, M.T., Ahmad, E., and Khawaja, M.I. 2006. “Determinants of Exports in Developing
Countries”. The Pakistan Development Review 45(4):1265-1276.
Mughal, M. 2008. “Boon or Bane-Role of FDI in the Economic Growth of Pakistan”. Munich Personal RePEc archive.
Negassa, A., Meyers, R., Maldhin, E.G. 2003. “Analyzing the Grain Market Efficiency in
Developing Countries: Review of Existing Methods and Extensions to the Parity Bound Model”. Market Trade and Institutions Division, Discussion Paper 63. International Food Policy Research Institute (IFPRI), Washington, D.C.
http://ageconsearch.umn.edu/bitstream/16132/1/mt030063.pdf Oanda, 2012. http://www.oanda.com/
Quddus, M.A., and Saeed, I. 2005. “AnAnalysis of Export and Growth in Pakistan”. Pakistan Development Review, pp: 921-937.
Sachs, J.D., and Warner, A.M. 1995. “Natural Resource Abundance and Economic Growth”. NBER Working Paper No. 5398.
Samiullah, Bedi-uz-Zaman, Farooq, M. and Javid, A. 2009. “Co-integration and Causality
between Exports and Economic Growth in Pakistan. European Journal of Social Sciences. 10:264-272
Shirazi, N.S., and Manap, T.A.A. 2004. “Export-Led Growth Hypothesis: Further Econometric Evidence from Pakistan”. Pakistan Development Review 43(4), 563-581.
Shirazi, N.S., and Manap, T.A.A. 2005. “Export-Led Growth Hypothesis: Further Econometric Evidence from South Asia”. The Developing Economies pp: 472-488.
Siddiqui, R., A.R. Kemal. 2002. Remittances, trade liberalization, and poverty in Pakistan: The role of excluded variables in poverty change analysis. The Pakistan development review, 45: 383-415.
Siddiqui, S., Zehra, S., Majeed, S., Butt. M. S., (2008), “Export-Led Growth Hypothesis in
Pakistan: A Reinvestigation Using the Bounds Test”, The Lahore Journal of Economics,
29 http://www.sbp.org.pk/departments/stats/PakEconomy_HandBook/Chap-8.1.pdf
Tadesse, G. 2010. “Commodity Prices and Market Institutions in Ethiopia”. Doctoral Thesis. Department of Economics and Resource management.
The Commonwealth. 2011. “Member states”, on line data base.
http://www.thecommonwealth.org/Internal/191086/142227/members/ The Economist Intelligence Unit (EIU). 2008. Country Profile: Pakistan.
http://www.eiu.com/FileHandler.ashx?issue_id=1603760545&mode=pdf The Economist Intelligence Unit (EIU). 2014. Country Report: Pakistan. http://www.eiu.com/FileHandler.ashx?issue_id=1491317133&mode=pdf
Todaro, M.P. and Smith, S.C. 2012. Economic Development. 111th edition. Addison-Wesley
Press, New York.
United Nations, Conference on Trade and Development (UN CTAD). 2012. On Line Data
Base. http://unctad.org/en/pages/Statistics.aspx
United Nations, Food and Agriculture Organization (UN FAO). 2012. On Line Data Base. www.fao.org
United Nations, Food and Agriculture Organization (UN FAO). 2013. FAO Rice Market Monitor: Various Volumes. Trade and Markets Division, Food and Agriculture Organization of the United Nations.
World Bank, 2012a. Pink sheet data,
http://econ.worldbank.org/WBSITE/EXTERNAL/EXTDEC/EXTDECPROSPECTS/0,,con tentMDK:21574907~menuPK:7859231~pagePK:64165401~piPK:64165026~theSitePK:47 6883,00.html
World Bank, 2012b. Transmission of Global Food Prices to Domestic Prices in Developing Countries: Why It Matters, How It Works, and Why It Should Be Enhanced. Contribution from the World Bank to the G20 Commodity Markets Sub Working Group. The World Bank.
http://siteresources.worldbank.org/EXTPREMNET/Resources/489960-1340717984364/WB_CPV_Input_Transmission_of_Global_Food_Prices.pdf World Bank. 2011. World development indicators. Online data base.
http://databank.worldbank.org/
World Bank. 2013a. “World Bank Group - Pakistan partnership: country program snapshot”. Washington DC: World Bank.
pakistan-artnership-country-program-snapshot
World Bank. 2013b. World development indicators. Online data base. http://databank.worldbank.org/
World Bank. 2013c. Pakistan Transport Sector. The World Bank.
http://web.worldbank.org/WBSITE/EXTERNAL/COUNTRIES/SOUTHASIAEXT/EXTSA RREGTOPTRANSPORT/0,,contentMDK:20699058~menuPK:869060~pagePK:34004173~
30 Investment in Pakistan”. Pakistan Economic and Social Review, 37-56.
Zaidi, H. H. 2005. Snags in the inflow of FDI. Dawn-Business http://archives.dawn.com/2004/08/09/ebr7.htm
Volume 8, Number 2 © 2012 Nova Science Publishers, Inc.
M
EASURING
C
OMMODITY
-
S
PECIFIC
T
RADE
D
ETERMINANTS AND
E
XPORT
P
OTENTIAL
:
A
G
RAVITY
M
ODEL OF
P
AKISTAN
’
S
R
ICE
E
XPORTS
Burhan Ahmad
and Roberto J. Garcia
† UMB School of Economics and Business, Norwegian University of Life Sciences (UMB), NorwayA
BSTRACTPakistan's milled rice exports to 92 markets during 1991-2010 are analyzed applying
an augmented gravity model, treating Pakistan’s real GDP and export prices as
endogenous, and regressing using Hausman-Taylor estimation technique. Rice is a necessity whose export follows the Heckscher-Ohlin rationale. Real GDP in import markets positively affects demand. Pakistan's real GDP, export prices and the exchange rate affect export supply. Distance negatively affects exports. Historical ties positively affect exports. Raising Pakistan's GDP, improving market access through trade agreements and better marketing would help exploit export potential, earning Pakistan foreign exchange, reducing its trade deficit and improving rural welfare.
JEL codes: F14, F17, C23
Keywords: Pakistan, rice, gravity model, export potential, determinants, panel data
I
NTRODUCTIONSince its existence in 1947, Pakistan has had a positive trade balance in very few years, mostly in the 1950s. Hence, Pakistan is a trade deficit country that has had a narrow range of export items and few sources of foreign exchange earnings. The major export items include rice, raw cotton and textile manufactures, leather and related products, all of which account for about 76% of the total export earnings during 2000-2010. In these years, almost half of all of Pakistan’s exports were comprised by a narrow range of five major export markets that included the USA, the UK, Saudi Arabia, Japan and Hong Kong. Agriculture remains a key sector of the economy contributing to about 23% of GDP, employing about 42% of the total
Corresponding author: Burhan Ahmad, E-mail addresses: burhan.ahmad@umb.no, burhan_uaf@yahoo.com
Phone (+47) 46230489; Fax (+47) 64965001
employed labor force during 2000-2009, and is the source of most exports (SBP 2010; GOP 2010; Hyder and Mehboob 2006).
Rice is Pakistan’s second largest export item after cotton and cotton products and contributes nearly 15% to the country’s foreign exchange (GOP 2010, Siddique and Kemal 2002). The major export markets in the Middle East amount to 40% of Pakistan’s total exports of milled rice. The major African markets account for another 16% of total rice exports (UN FAO 2012). About 40% of the rice produced is exported due to the relatively low annual per capita domestic consumption of about 10 kg (Anwar 2004). Rice production covers about 20% of the total cropped area under food grains in the country, accounts for almost 6% of the value added in agriculture, contributes to 1.3% of GDP, and employs a number of people who are economically active in its production, domestic marketing and export (GOP 2010).
Given the importance of rice to Pakistan’s economy, the identification of factors that affect its international trade and marketing and understanding the factors that can help to exploit market potential is essential. Use of this type of information would help the sector to develop, contribute to foreign exchange earnings, reduce the country’s overall trade deficit, and enhance economic growth.
The gravity model is the most popular approach employed to predict the international trade flows (Abler 2007). It is widely used to measure the potential for and factors affecting bilateral trade flows at an aggregate level (e.g. Martínez-Zarzoso and Nowak-Lehmann 2003; Ricchiuti 2004; Brülhart and Kelly 2004; Hatab, Romstad and Huo 2010). However, few studies have attempted to apply it at a commodity-specific level (e.g. Dascal Mattas and Tzouvelekas 2002; Eita and Jordaan 2007; Vollrath et al. 2009) and its application to Pakistan has been very limited (But 2008, Gul and Yasin 2011). This study is an addition to that literature by applying a gravity model to measure the commodity-specific export potential of Pakistan’s milled rice using panel data on exports to 92 rice markets for 1991-2010 and to investigate the economic, geographical and cultural factors that affect rice exports. Given the commodity-specific nature of rice, the study analyzes supply-side effects such as Pakistan’s GDP, GDP per capita and export prices and, demand-side factors such as income and income per capita in importing countries. Exchange rates and distance to export markets are included in the model to consider macro-financial and geographical factors, respectively, while a cultural factor is included to consider the effect of a common history under British colonization.
The real GDP of Pakistan and export prices are entered into the models as endogenous variables and estimated using the Hausman-Taylor estimation technique. However, pooled, fixed effects and random effects models are also estimated and the results are compared.
A
NO
VERVIEW OF THER
ICES
ECTOR OFP
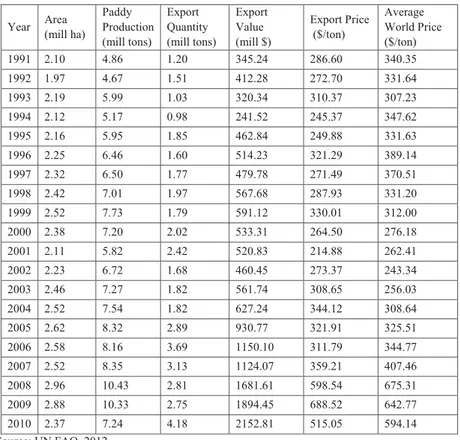
AKISTANTable 1 presents the data for the area, production, exports and average unit export value of Pakistan’s rice. While the area under rice cultivation has varied by 50%, between 1.97 and 2.96 million hectares, production has nearly doubled during 1991-2010, reaching to a maximum of 10.43 million tons (UNFAO 2012). The fluctuations in area and production are primarily due to the lack of timely availability of fertilizer and pesticides, water availability, inaccessibility to credit to purchase inputs, adverse weather conditions, the effect that
unstable farm income has on the timing of sowing, and the ability to respond to external shocks. Moreover, the domestic marketing system is constituted by intermediaries who have buying power relative to the rice producers and who make payments to farmers that are often late. Storage facilities are limited and markets are distant from the production areas. These factors, in turn, affect the farmer’s ability to exploit the full production potential (Iqbal et al. 2009, GOP 2010).
Table 1. Pakistan’s Rice Area, Production, Export and Prices
Year Area (mill ha) Paddy Production (mill tons) Export Quantity (mill tons) Export Value (mill $) Export Price ($/ton) Average World Price ($/ton) 1991 2.10 4.86 1.20 345.24 286.60 340.35 1992 1.97 4.67 1.51 412.28 272.70 331.64 1993 2.19 5.99 1.03 320.34 310.37 307.23 1994 2.12 5.17 0.98 241.52 245.37 347.62 1995 2.16 5.95 1.85 462.84 249.88 331.63 1996 2.25 6.46 1.60 514.23 321.29 389.14 1997 2.32 6.50 1.77 479.78 271.49 370.51 1998 2.42 7.01 1.97 567.68 287.93 331.20 1999 2.52 7.73 1.79 591.12 330.01 312.00 2000 2.38 7.20 2.02 533.31 264.50 276.18 2001 2.11 5.82 2.42 520.83 214.88 262.41 2002 2.23 6.72 1.68 460.45 273.37 243.34 2003 2.46 7.27 1.82 561.74 308.65 256.03 2004 2.52 7.54 1.82 627.24 344.12 308.64 2005 2.62 8.32 2.89 930.77 321.91 325.51 2006 2.58 8.16 3.69 1150.10 311.79 344.77 2007 2.52 8.35 3.13 1124.07 359.21 407.46 2008 2.96 10.43 2.81 1681.61 598.54 675.31 2009 2.88 10.33 2.75 1894.45 688.52 642.77 2010 2.37 7.24 4.18 2152.81 515.05 594.14 Source: UN FAO, 2012.
Despite the various constraints and inefficiencies in the domestic marketing channel, the volume of exports has steadily increased, having been briefly interrupted in 2000-2002. Exports have increased by more than 300% to 4.13 million tons amounting to USD 2.2 billion, permitted by a slower rate of growth in domestic per capita consumption.