Procedia - Social and Behavioral Sciences 102 ( 2013 ) 64 – 73
1877-0428 © 2013 The Authors. Published by Elsevier Ltd.
Selection and/or peer-review under responsibility of Professor Dr Mohd. Zaidi Omar, Associate Professor Dr Ruhizan Mohammad Yasin, Dr Roszilah Hamid, Dr Norngainy Mohd. Tawil, Associate Professor Dr Wan Kamal Mujani, Associate Professor Dr Effandi Zakaria. doi: 10.1016/j.sbspro.2013.10.714
ScienceDirect
6th International Forum on Engineering Education (IFEE 2012)
Evaluation of Graduates’ Performance using Fuzzy Approach
Yuzainee Md Yusoff
a,*, Mohd Zaidi Omar
b, Azami Zaharim
ba
College of Engineering, Universiti Tenaga Nasional, Kajang, 43000, Malaysia b
Centre for Engineering Education Research, Faculty of Engineering and Built Environment, Universiti Kebangsaan Malaysia,43600 UKM Bangi Selangor, Malaysia
Abstract
This study offers an argument on the use of ordinal values in Likert scale that represents the linguistic terms of the level of satisfaction perceived by employers on the graduates’ performance. Generally, ordinal data are regarded as nonparametric and cannot be added. This paper recommends the use of fuzzy sets to represent linguistic terms in Likert scale. The evaluation of employers’ satisfaction level for the graduates’ performance applied the technique using fuzzy conjoint method. The investigation findings show that the analysis using fuzzy conjoint method yields consistent outcome compared to the analysis using the statistics mean and percentage. In addition, the fuzzy membership values obtained from fuzzy conjoint method ranks the attributes that used to measure employers’ satisfaction level. Therefore, this finding provides useful information for decision-making in finding the attributes that need to be enhanced in engineering graduates.
© 2013 The Authors. Published by Elsevier Ltd.
Selection and/or peer-review under responsibility of Mohd Zaidi Omar, Ruhizan Mohammad Yasin, Roszilah Hamid, Norngainy Mohd. Tawil, Kamaruzaman Yusoff , Mohamad Sattar Rasul
Keywords: Performance; graduates; employability skills; attributes; decision-making; Conjoint analysis.
1. Introduction
Employability skills are very vital in today’s job market. These skills also be termed varies across different continentals such as soft skills, transferable skills, basic skills, core skills, fundamental skills and few other terms. Skill shortage is one of the major constraints to the economy growth. Therefore, Malaysian government emphasises the need for graduates to show their own employability skills in order to compete successfully in today's highly competitive market place for graduate jobs. In job interview, having a good degree is no longer a
* Corresponding author. Tel.: +0-603-8928-7243 E-mail address: [email protected] © 2013 The Authors. Published by Elsevier Ltd.
set you apart from other candidates. Additional to graduates’ responsibility to secure their degree, they also have to be able to market themselves and stand out from the crowd to get the job that they want. The market and demand for employability skills is increasing in the Malaysia industries, where the performances of graduates become crucial in job interview. This is forcing university to ensure that their graduates can compete successfully in the graduate job market.
Graduates’ performance is an important aspect to determine the achievement of engineering program of a university. The graduates’ performance represents the performance of the education providers. The outcome of a study on graduates’ performance could be useful in providing information for the quality improvement in teaching-learning process. In the literature, there are a large number of studies realised by different method to measure performance of graduates. Daniel [1] used 5-Likert Scale to carry out the performances analysis of employer and new graduate satisfaction. Daniel conducted a measurement on the employer’s satisfaction with the overall performance of the new graduate in the workplace within the first year following convocation and analyzed it using statistical mean and percentage. Rasmani [2] evaluated student performance based on Criterion-Referenced Evaluation (CRE) and Norm-Criterion-Referenced Evaluation (NRE). Berkow [3] carried out a study to measure the performances of new graduate nurses using percentage of efficiency. Basri [4] conducted a study to compare the performance of engineering graduates of year 2006 and 2010 using percentage of employers’ agreement on toward graduates’ performance.
This study will focus on the attributes that should be performed efficiently by graduates. The instrument used for evaluation of graduates’ skills performance consists of a number of attributes that are very subjective depending on employers’ perception. For each attribute, the respondents of the survey need to give their answer in the form of preferences such as ‘satisfied’ and ‘unsatisfied’. A Likert scale that employs ordinal values to represent linguistics terms frequently used in the studies on level of satisfaction of performance. The collected responses were analysed using fuzzy set theory approach. The use of fuzzy approach in performance evaluation is becoming popular [5]. Therefore this study present an argument on the use of ordinal values in Likert scale that represents the linguistic terms of the level of satisfaction of employers on the graduates’ performance.
2. Methodology
2.1.Fuzzy Set Conjoint Model and Linguistic Variable
This section elucidates the theory of fuzzy sets relating to satisfaction on performance and the fuzzy conjoint analysis method. In classical set theory, a set is defined as a collection of well-defined elements or objects. Each element can either belongs or does not belong to the set. Conversely, in real world problems this is not always true as some sets may not have clear boundaries [7]. The linguistic terms used for measurements of preferences or agreements such as Likert scale or Likert-type scale have been used by researchers especially on subjective questions. Commonly, the discrete-ordinal value used to represent linguistic term in Likert scale. The collected responses were analysed to determine statistical mean, percentage, correlation and statistical tests. However, the use of mean value obtained from Likert scale does not imply to linguistics terms because the ordinal value assign to the linguistic term is just for coding. The discrete-ordinal value is discrete data that may be arranged ascending or descending order but differences between values are meaningless. The interval between values such as ‘3.45’ is not interpreted since it cannot be determined in an ordinal measure. The use of discrete values in Likert scale is also inappropriate because the linguistic terms such as ‘satisfied’ and ‘unsatisfied’ are measured as degrees of preferences which in nature are fuzzy terms.
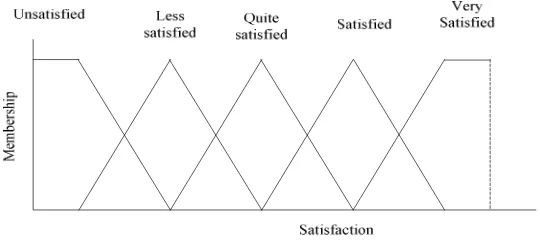
In general, performance evaluation is conducted based on human interpretations which are very subjective and uncertainty. The fuzzy sets and fuzzy membership values have been proven can be used to generate model for evaluations process [5,8]. In fuzzy set theory, the Likert scale used to represent the linguistic terms in different way. The linguistic terms are perceived in ascending or descending order and thus can be replaced with fuzzy sets representing level of agreement or preference. The value of an element in fuzzy set is defined in terms of degrees in an interval between 0 and 1. A value approaching 1 means is becoming true and a value approaching 0 means is closer to not true. The linguistic variable is a variable whose values are not numbers but are in linguistic words in a natural language. In this study, the linguistic variables are represented by “very satisfied”, “satisfied”, “quite satisfied”, “less satisfied”, “unsatisfied” rather than quantitative variables. Figure 1 illustrates an example of fuzzy sets for level of satisfaction.
Fig. 1. Fuzzy set represents level of satisfaction
The variable of linguistic for domain element is “Satisfaction”. The crisp weight is a rating of attribute’s satisfaction using rating Likert scaled ranged from 1: “Unsatisfied” to 5: “Very Satisfied” as shown in Table 1.
Table 1 Membership for Likert-Scale of Linguistic Variable Represent Level of Satisfaction
Scale Level of Satisfaction Fuzzy Linguistic Value
This evaluation made by employers on the performance of engineering graduates was analysed using set conjoint model adapted from [9,10]. The performance was based on 13 skills listed in MOHE [6]. The Fuzzy Conjoint Model is developed by integrating fuzzy measurement of evaluations into the vector preference model [11]. The model adapted from Turksen is:
1
μ
= the estimated overall membership degree of linguistic value for R towards skill A.1
¦
= Score of linguistic values for respondent i with respect to other respondents;The result of performance of graduate as perceived by employer obtained is compared to outcomes of analysis using statistical method. The analysis result shown in Table 2 demonstrated the comparison of level of satisfaction obtained based on three methods; mean, percentage and fuzzy conjoint model.
2.2.Degree of Similarity
formula of dot product based on Euclidean Inner Product formulated by [10]. The fuzzy similarity degree
The analysis process begins with:
1) Obtained the level of satisfaction for all respondents on graduate’s performance based on five linguistic values.
2) Defined the five scales measured for satisfaction into fuzzy set.
3) Obtained the weights by dividing the measurement of respondent with sum of measurement of all respondent.
4) Obtained membership degree of every respondent by multiplying the weight and every fuzzy set membership value accordingly.
5) Obtained the overall membership degree by total up the membership degree of every linguistic respect to linguistic value.
6) Determine the overall linguistic value by obtained the fuzzy set similarity degree for overall measurement with five fuzzy set value defined. The result of this analysis is determined based on the maximum similarity degree.
(Adapted from Biswas, 1995)
By using this method similarity values for each level of satisfaction is determined. The outcome of this analysis is determined based on the maximum similarity value among the level of satisfaction. For example, there may be a few level of satisfaction which is similar, such as “satisfaction” but with the different linguistic value. The hierarchy of the skills can be established by comparing the fuzzy set similarity value for each skill performed. The results are shown in Table 3.
3. Result and discussion
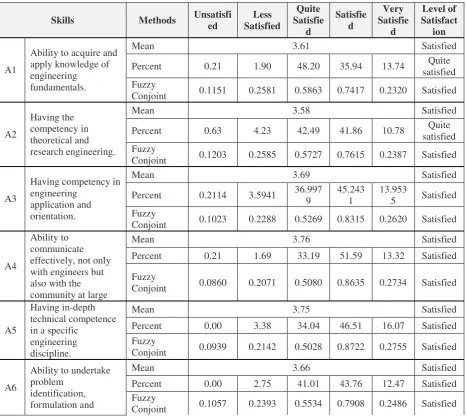
The overall results presented in Table 2 show that employers satisfied with the performance of engineering graduates. The outcomes show that the results produced by fuzzy conjoint method are consistent with the result analysed by percentage and mean except for a few skills. Using fuzzy conjoint method, employers satisfied with the performance on all listed skills except A13. Meanwhile, the results of analysis using mean show that the employers satisfied on all skills except A7, A11, A12 and A13. However, analysis using percentage shows, percent of employers satisfied on the graduates’ performance is on A3, A4, A5 and A6.
and orientation (A3), ability to communicate effectively, not only with engineers but also with the community at large (A4), having in-depth technical competence in a specific engineering discipline (A5) and ability to undertake problem identification, formulation and solution (A6)” using fuzzy conjoint method are consistent with the level of satisfaction based on analysis using the percentage and mean. All three methods show result as “satisfied”. However, the analysis using fuzzy conjoint method created different level of satisfaction that is “satisfied” but the analysis result using percentage and mean is “quite satisfied” on “ability to utilise a systems approach to design and evaluate operational performance (A7), ability to design and conduct experiments, as well as to analyse and interpret data (A11), and having the knowledge of contemporary issues (A12)”. The last skill “having basic entrepreneurial skills (A13)” obtained similar result that is “quite satisfied” performance from all three methods. From these observations, it can be concluded that fuzzy conjoint method generally produces consistent results with the analysis using the percentage and statistical mean.
Table 2 Comparison of level of satisfaction on skills performed by engineering graduates
Skills Methods Unsatisfi ed
Ability to acquire and apply knowledge of engineering fundamentals.
Mean 3.61 Satisfied
Percent 0.21 1.90 48.20 35.94 13.74 Quite
satisfied Fuzzy
Conjoint 0.1151 0.2581 0.5863 0.7417 0.2320 Satisfied
A2
Having the competency in theoretical and research engineering.
Mean 3.58 Satisfied
Percent 0.63 4.23 42.49 41.86 10.78 Quite
satisfied Fuzzy
Conjoint 0.1203 0.2585 0.5727 0.7615 0.2387 Satisfied
A3
Having competency in engineering
application and orientation.
Mean 3.69 Satisfied
Percent 0.2114 3.5941 36.997 9
Conjoint 0.1023 0.2288 0.5269 0.8315 0.2620 Satisfied
A4
Mean 3.76 Satisfied
Percent 0.21 1.69 33.19 51.59 13.32 Satisfied
Fuzzy
Conjoint 0.0860 0.2071 0.5080 0.8635 0.2734 Satisfied
A5
Mean 3.75 Satisfied
Percent 0.00 3.38 34.04 46.51 16.07 Satisfied
Fuzzy
Conjoint 0.0939 0.2142 0.5028 0.8722 0.2755 Satisfied
A6
Ability to undertake problem
identification, formulation and
Mean 3.66 Satisfied
Percent 0.00 2.75 41.01 43.76 12.47 Satisfied
Fuzzy
Skills Methods Unsatisfi
Ability to utilise a systems approach to
Percent 0.85 Quite
satisfied 43.13 36.36 11.21 Quite satisfied Fuzzy
Conjoint 0.1451 0.2848 0.5784 0.7467 0.2330 Satisfied
A8
Ability to function effectively as an individual and in a group with the capacity to be a leader or manager as well as an effective team member.
Mean 3.63 Satisfied
Percent 0.00 2.33 46.09 38.27 13.32 Quite
satisfied
Fuzzy
Conjoint 0.1127 0.2531 0.5768 0.7555 0.2367 Satisfied
A9
Mean 3.54 Satisfied
Percent 0.42 5.29 45.45 37.21 11.63 Quite
satisfied
Fuzzy
Conjoint 0.1302 0.2721 0.5850 0.7418 0.2318 Satisfied
A10
Mean 3.51 Satisfied
Percent 0.42 6.13 46.72 35.52 11.21 Quite
satisfied Fuzzy
Conjoint 0.1378 0.2824 0.5952 0.7266 0.2267 Satisfied
A11
Ability to design and conduct experiments,
Conjoint 0.1562 0.2981 0.5869 0.7310 0.2275 Satisfied
A12
Conjoint 0.1638 0.3195 0.6370 0.6688 0.2074 Satisfied
A13 Having basic
entrepreneurial skills. Mean 3.35
Skills Methods Unsatisfi
Conjoint 0.1639 0.3255 0.6609 0.6439 0.1995 Quite satisfied
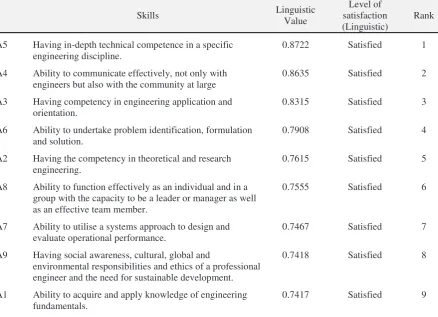
Table 3 shows the hierarchy of the satisfaction level as perceived by employers which analysed by Fuzzy Conjoint Turksen Model [12]. The results show that the first three skills satisfied by employers are “having in-depth technical competence in a specific engineering discipline (A5), ability to communicate effectively, not only with engineers but also with the community at large (A4), and having competency in engineering application and orientation (A3)”. These three skills obtained linguistic value more than 0.8 showing that employers’ satisfaction on these skills are closed to very satisfied or perfect satisfaction. The only skill having assessment as “quite satisfied” is “having basic entrepreneurial skills (A13)”. The linguistic value for this skill is 0.6605 for quite satisfied showing that employers’ satisfaction level is closer to satisfied rather than to less satisfy. The other nine skills are perceived as satisfied with lesser linguistic value compared to the first three skills. Employers perceived that the skills performed by graduates have met their expectation.
Table 3 Hierarchy of the satisfaction level as perceived by employers on graduates’ performance.
A5 Having in-depth technical competence in a specific engineering discipline.
0.8722 Satisfied 1
A4 Ability to communicate effectively, not only with engineers but also with the community at large
0.8635 Satisfied 2
A3 Having competency in engineering application and orientation.
0.8315 Satisfied 3
A6 Ability to undertake problem identification, formulation and solution.
0.7908 Satisfied 4
A2 Having the competency in theoretical and research engineering.
0.7615 Satisfied 5
A8 Ability to function effectively as an individual and in a group with the capacity to be a leader or manager as well as an effective team member.
0.7555 Satisfied 6
A7 Ability to utilise a systems approach to design and evaluate operational performance.
0.7467 Satisfied 7
A9 Having social awareness, cultural, global and
environmental responsibilities and ethics of a professional engineer and the need for sustainable development.
0.7418 Satisfied 8
A1 Ability to acquire and apply knowledge of engineering fundamentals.
Skills Linguistic
Value
Level of satisfaction (Linguistic)
Rank
A11 Ability to design and conduct experiments, as well as to analyse and interpret data.
0.7310 Satisfied 10
A10 Recognising the need to undertake lifelong learning, and possessing/acquiring the capacity to do so.
0.7266 Satisfied 11
A12 Having the knowledge of contemporary issues. 0.6688 Satisfied 12
A13 Having basic entrepreneurial skills. 0.6609 Quite Satisfied 13
4. Conclusion
This paper has presented an application of fuzzy approach in evaluation of graduate’s performance. The results from the fuzzy conjoint method are shown in this study is consistent with the results obtained from analysis based on percentage and statistical mean. Therefore, the fuzzy conjoint method can be used as an alternative method for analysing graduate’s performance. The approach employed in fuzzy conjoint method could be very useful in term of the methods to be used for evaluation of performance satisfaction in real-world. It has been shown that the evaluation of graduate’s performance can be carried out using fuzzy conjoint method. The linguistic value in fuzzy conjoint method can be used as indicator presenting the degree of satisfaction for each skill performed by graduate.
Acknowledgements
The authors wish to thank the Centre for Engineering Education Research, Faculty of Engineering and Built Environment, Universiti Kebangsaan Malaysia, for sharing with us the data of employers’ perception on graduates’ performance collected September 2009 to January 2010 and June 2010 to December 2010.
References
[1] Daniel G. Butler,Employer and new graduate satisfaction with new graduate performance in the workplace within the first year following convocation from the Ontario Veterinary College. Canadian Veterinary Journal, Vol. 44. 2003
[2] Rasmani K.A. & Shen,Q. Data-driven fuzzy rule generation and its application for student academic performance evaluation. Applied Intelligence, Vol. 25, 2006, 305–319
[3] Berkow, Steven JD; Virkstis, Katherine ND; Stewart, Jennifer BA; Conway, & Lindsay MSEd. Assessing New Graduate Nurse Performance. Journal of Nursing Administration: Vol. 38 - Issue 11 - 2008, 468-474 [4] Basri, H., Zaharim, A., Omar, M.Z., & Yuzainee, M.Y.. Performance Of Engineering Graduates As Perceived By Employers: Past And Present. IEEE Engineering Education Conference 2012 – Collaborative Learning & New Pedagogic Approaches in Engineering Education. Marrakesh, Morocco, 2012
[5] Rasmani, K.A., & Shahari, N.A., Job Satisfaction Evaluation Using Fuzzy Approach, Proceedings of Third International Conference on Natural Computation, Hainan, China, 2007
[7] Wang, L. X. A Course in Fuzzy Systems and Control. New Jersey: Prentice-Hall International, 1997 [8] Gupta,S. & Chakraborty, M. "Job Evaluation in Fuzzy Environment," Fuzzy Sets and Systems, vol. 100, 1998, 71-76.
[9] Turksen, I. B. & Wilson, I. A. "A Fuzzy Preference Model for Consumer Choice," Fuzzy Sets and Systems,
vol. 68, 1994. 253-266.
[10] Biswas R.. An Applications of Fuzzy Sets in Students’ Evaluation. Fuzzy Sets and System, vol.74, Issue 2, 1995,187-194
[11] Wan Rosmanira Ismail, Vmmul Khair Salma Hi. Din, Norngainy, M.T. Pemeringkatan Faktor Pemilihan Pelajar Matrikulasi ke Universiti Menggunakan Model Set Kabur. Latihan Ilmiah. Universiti Kebangsaan Malaysia. 2004