DETERMINANTS OF GROWTH AND PROFITABILITY
BY BANK SPECIFIC VARIABLE AND MARKET SHARE
IN ISLAMIC BANKING IN INDONESIA
Irma Setyawati
Abstract
This study aims to assess bank specific variable (finance to deposit ratio, capital adequacy ratio, operating expenses to total assets ratio, non-financing income to total assets ratio, non performing financing) and market share to profitability and Islamic banking growth in Indonesia. This research is explanatory survey with seemingly unrelated regression methods by using data from financial reports from 2011 January until 2013 December.
Overall, this research model can explain that the bank specific variables and market structure increase the profitability and total assets growth of Islamic banks significantly. Finance to deposit ratio was not significantly and negative effect both to the return on assets and total assets growth. Capital adequacy ratio was not significantly and negative effect to return on assets but was significantly and negative effect to total assets growth. Operating expenses to total assets ratio was significantly and negative effect both to return on assets and total assets growth. Non-financing income to total assets ratio was not significantly and positive effect to return on assets and significantly and positive effect to total assets growth. Non-performing financing was significantly and negative effect both to return on assets and total assets growth. Market share was significantly and negative effect both to return on assets and total assets growth.
INTRODUCTION
Subprime mortgage crisis ever experienced by the United States is a credit crisis or credit crunch that can be used as an indicator of the financial crisis. The crisis brought a tremendous disaster for the economy of the United States because of a lack of funds and credit is too great in the economy (Farook, 2009). Therefore, the performance of banks, both very important in the national or international economy, as well as the need supervision at all times. The role of banks is very important in the economy, such as stability and economic growth. Bank can play a role through the efficiency of the allocation and utilization of funds and the last resource in the economy (Al-Omar and Al-Mutairi, 2008). After facing many obstacles, reserve growth of Islamic banks experienced a remarkable improvement, as well as an increase in the number of customers (Alam, et al., 2011).
Profitability is very important for the bank and can be measured at the micro and macro levels (Aburime, 2009). In the macro level, profit is an important prerequisite to compete in the banking industry and as a source of cheap funds. The high profits are not entirely good, because of the high profit indicates the strength of the market, especially for banks with large scale. It inhibits the function of financial intermediation due to the high strength of the market, the bank may offer a low return on savings/deposits but charge a high interest rate loan. Profitability is very low, may give rise to conflicts of agency (the bank's management and shareholders) on the activities of the bank, resulting in the bank failed to attract enough capital to operate and usually occur at banks with low capitalization (Olweny & Shipho, 2011).
The growth is a measurement of the performance of the most important for evaluating the development of the company, as the financial markets and investors tend to reward the stock price for a company that is growing rapidly, so that the manager is under pressure from shareholders and financial analysts to boost the company's growth (Kim & Haleblian, 2011).
However, the performance of Islamic bank strongly linked to welfare aspects. According to Chapra (2000), the benefit of the pillars of business success of Islamic bank, because it must comply with the rules of fiqih muamalah. Muamalah means that the activities of Islamic banks have benefits, so that the resulting performance of the benefit in the form of the aspect of non-financial that Islamic banks as intermediary institutions do fundraising and channeled back into productive real sector as well as social functions to conduct fund raising in the form of zakat, infaq and shadaqoh (ZIS).
The spread of the practice of Islamic banks starting from East to West, from Indonesia and Malaysia to Europe and America. Since the first Islamic bank was established in Egypt in 1963, then developed throughout the world. The number of financial institutions banking around the world at the moment grew more than 300 and in 75 countries with concentrated in the Middle East and Southeast Asia (the largest in Bahrain and Malaysia), began to grow in Europe and the United States (Ahmad & Ahmad, 2011). The interesting phenomenon of the development of Islamic banks in Indonesia, that Indonesia is a country with the largest Muslim population, where a number of Islamic micro-finance unit, formal and semi-formal evolved since 1990, is now recognized as part of the dual banking system. Thus the ability of Islamic banks in Indonesia to earn profits and grow rapidly is one of the requirements to be able to compete with conventional banks
The purpose of this study to assess bank specific variable and market structure to profitability and the growth of Islamic banking in Indonesia. This research was conducted for the study of Islamic banks and Islamic finance. The phenomenon of Islamic banks and Islamic finance has not been done in the global financial markets and not widely spread because of the limited range.
LITERATURE REVIEW
THE RELATIONSHIP BETWEEN LIQUIDITY AND PROFITABILITY
research conducted Shen, et al. (2009), Athanasoglou (2006), Al-Omar (2008), and Kosmidou & Constantin (2008) stated that liquidity have a negative impact on profitability.
Liquidity risk may be low quality of assets that led to low liquidity levels and is the cause of bank failure (Al-Omar, et al., 2008; Awojobi & Amel, 2011). In addition, liquidity risk lowering the bank's profitability (return on average assets/ROAA and return on average equity/ ROAE). Shen, et al., (2009) state bank with a big gap, less stable and low-cost funds, then use the liquid assets or external financing to meet demand for funds, will raise the cost of funds, resulting in lower profitability of banks, thus the high liquidity risk will increase return on average assets (ROAA), return on average equity (ROAE) and net interest margin (NIM).
THE RELATIONSHIP BETWEEN CAPITAL AND PROFITABILITY
To help banks reduce losses and avoid the event of bankruptcy in the long term, the necessary reserves are called capital (O 'Hara, 1983; Dowd, 1999; Chen, 2003; Toby, 2008; Petersen, 2008; Awojobi & Amel, 2011).
Ahmad et al. (2009) in the Center for Research in Finance (CARF) Working Paper examines the variables that affect the capital ratios of banks in developing countries. Capital ratio (CAR) as the dependent variable is affected by the 9 explanatory variables consisted of 6 accounting based variables, NLP, ZRISK (risk index), NIM (net interest margin), EQTL (ratio of total equity to total liabilities), LACFF (ratio of total liquid assets to total deposits), SIZE (natural log of the total assets of the bank) and 3 dummy variable, REGRWC (1 for law capital banks; 0 otherwise), POST 99 (1 for 1999 - 2002; 0 for 1995-1998), Y96 (1 to 1996; 0 for the other). The study resulted in the conclusion that the non-performing loan (NPL) and risk index has a positive relationship between bank capital and risk-taking, arguing that the bank's capital and risk-related, due to the high capital ratios of banks behavior of the banks more willing to take risk.
THE RELATIONSHIP BETWEEN OPERATIONAL COSTS AND PROFITABILITY
The relationship between operational costs by an estimated negative profitability, because if banks can run their business more productive and efficient, banks will be able to have a low operating costs (Sufian & Habibullah, 2010; Sufian & Majid, 2011).
The empirical test results from several studies suggest that operating costs have a negative relationship, it is shown to improve the profitability of banks, the efficiency of the management cost is a prerequisite (Ghazali, 2008; Sufian & Habibullah, 2010, Sufian & Majid, 2011; Wasiuzzaman & Tarmizi, 2011; Hidayah & Abduh 2012).
THE RELATIONSHIP BETWEEN THE NON-EARNING FINANCE AND PROFITABILITY
In the study Sufian and Habibullah (2010), the relationship between income diversification and profitability to a positive and significant, so that the result means that the proportion of higher bank earnings derived from sources such as non-financing income-based services tend to obtain higher profitability.
THE RELATIONSHIP BETWEEN THE QUALITY OF ASSETS AND PROBABILITY
In the study Olweny and Shipo (2011), showed a negative relationship and strong between the asset quality (credit risk) as measured by non-performing loan (NPL), which is the ratio between the total of non performing loans to total loans, with profitability, meaning that if banks can not manage credit well will reduce profitability which ultimately lowers the quality of the assets.
The results of empirical tests conducted by Richard & Thomas (1997); Athanasoglou (2005); Shen, et al (2009); Olweny & Shipho (2010); Sufian & Habibullah (2010); Sufian & Majid (2011); Misman (2012); Hidayat & Abduh (2012); Sapuan, et al (2013), as statistics show that credit risk resulted in low profitability of banks in both conventional and Islamic banks. It shows that the management should pay attention on credit risk which in turn can be a problem in the future, because of the failure of the banks most of which come from how the bank can recognize the weakness of these assets and creating a backup for written off of this asset (Sufian & Majid, 2011).
THE RELATIONSHIP BETWEEN THE MARKET SHARE AND PROBABILITY
The market share explain the position of competition between companies in the market. Companies that have a large market share, will be able to give satisfaction to customers and eventually will enjoy a competitive advantage (Schawalbach, 1991). The market share refers to the customer, especially about the company's product quality (Jacobson, 1988).
Market share is a key determinant of profitability. Market size indicates the strength of banks in controlling the prices and services offered for various bank customers (Haron, 2004). Sharkin study (1988) found that companies with a high level of market share (51%) enjoy above average profit. Research conducted by Markell, et.al (1988) showed in the plastic industry are positive and significant relationship between market share and profitability.
THE RELATIONSHIP BETWEEN LIQUIDITY AND GROWTH IN TOTAL ASSETS
Research conducted by Oliveira and Fortunato (2005) using the cash flows as a proxy of liquidity, cash flow showed significant positive effect on the company growth.
THE RELATIONSHIP BETWEEN CAPITAL AND GROWTH IN TOTAL ASSETS
Ability to pay indicates a healthy company. To calculate the capital ratio or solvency ratio, stockholders' equity divided by total assets. Health companies can be determined by the greater this ratio. Companies that have a solvency ratio indicates that the small shareholder capital is smaller than its debts. Companies with a solvency ratio of small very high risk to go bankrupt (Loi & Khan, 2012; Benhayoun, et.al, 2014). These results are consistent with studies conducted by Loi & Khan (2012) that the solvency ratio is calculated by dividing total
shareholders capital assets have a significant negative effect on the level of α = 5% to the growth
of the company.
THE RELATIONSHIP BETWEEN OPERATIONAL COST AND GROWTH IN TOTAL ASSET
Research in India, related to the problem of efficiency in banking is based on financial ratios (Sarkar., et.al; 1998; Das, 1999; Sanchez, et.al, 2013). While research Subramanyam (1993) and Reddy (2005) outlines the company's growth due to changes in efficiency and technical change. Market power in the banking sector resulted in a high cost of intermediation. This causes the price to be high, decreasing the amount of savings and investment; resulting in decreased growth of the company (Ningaye, et.al, 2014).
Kumar et.al (2010) empirical test results, which examines the determinants of changes in the growth of the banking sector (total factor productivity) and its components, namely technical
and changes, stating that the level of α = 5%, the growth of banks in India during the study
period (1995-2006) is almost dominated by technical changes compared with efficiency changes, means that technology and innovation have a greater impact on the growth of bank compared the change in efficiency.
THE RELATIONSHIP BETWEEN NON-EARNING FINANCE AND GROWTH IN TOTAL ASSET
Research conducted by Pennathura (2009), where the variable non-interest income divided by total assets have significant negative influence on the growth of the company. While Bush & Kick (2009) who conducted a study of three types of banks stated that non-interest income (by using the term fee income) have a negative impact significantly on the growth of the company at the level of α = 1%, both for cooperative banks and saving banks, while for
commercial banks, fee income has a significant positive effect on the level of α = 10%.
THE RELATIONSHIP BETWEEN QUALITY OF ASSETS AND GROWTH IN TOTAL ASSET
Logically, the smaller the rate of financing problems, the investment of financing is smaller, so good quality of Islamic banking assets.
THE RELATIONSHIP BETWEEN MARKET SHARE AND GROWTH IN TOTAL ASSET
DATA AND METHODOLOGY
Data were taken from the site Indonesian Bank, in the form of monthly financial reports of eleven Islamic bank in Indonesia period 2010 - 2013. Data were processed with statistical program Stata version 11, using seemingly unrelated regression (SUR) analysis.
Table 1 shows the variables that are used as a proxy for profitability, growth and the
Return on asset (ROA) This ratio is used to determine a company's ability to earn a return on
the investment made by company NA
Growth of total asset (GTA)
Resources of the company as a result of operational activities
NA Independent Variable
Finance deposit ratio (FDR)
The parameters that determine the success of the distribution of funds of banks (financing) to third parties. Measured by comparing the
financing with third party funds
-
Capital adequacy ratio (CAR)
Parameter that indicates the minimum capital to be provided by the bank. Measured by comparing the capital with risk-weighted assets
(RWA)
-
The ratio of operating expenses to total assets
(OE/TA)
Parameters that indicate the extent to which the management
efficiency. Measured by dividing operating expenses to total assets. -
The ratio of non-financing income to total assets
(NFI/TA)
Parameters that indicate different types of income earned bank.
Measured by dividing non-financing income to total assets +
Non performing finance (NPF)
Parameters that indicate the extent to which the bank is able to provide sufficient funds and reserves. Measured by comparing the amount of financing problems divided the total financing extended
financing provided to bank depositors.
-
The market share of banks (MS)
Parameter that indicates the market share of the bank. Calculated by comparing the total assets of Islamic banks with total assets of the
banking industry
+
Estimation model to analyze the data of this study variables are as follows:
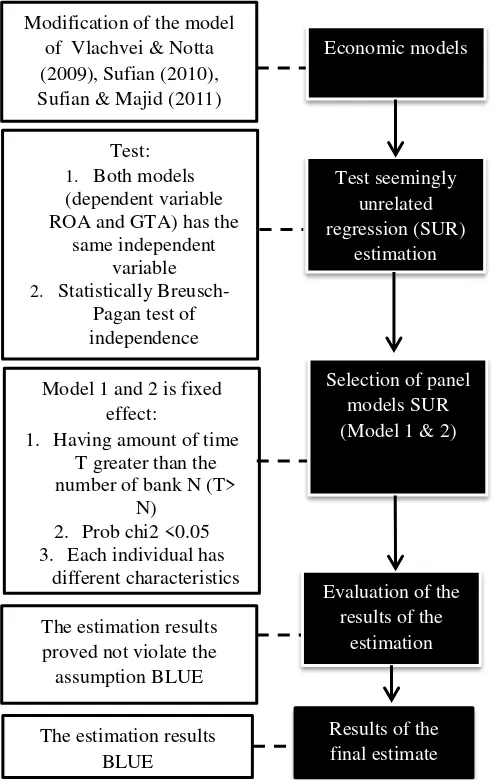
EMPIRICAL FUNDINGS SUMMARY ESTIMATES RESEARCH
The results of the estimation process above can be summarized that in the selection panel models, the first model and the second model using a fixed effect model. Summary results of the estimation process is presented in Figure 1.
Figure 1
Summary of Research Estimates
RESULTS ESTIMATES
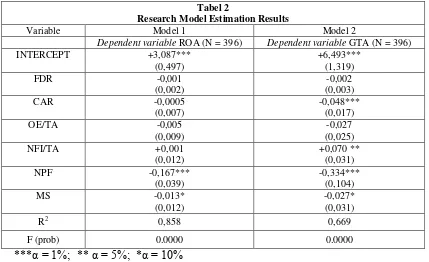
The estimation results of the research model presented in Table 2.
Tabel 2
Research Model Estimation Results
Variable Model 1 Model 2
Dependent variable ROA (N = 396) Dependent variable GTA (N = 396)
INTERCEPT +3,087***
In first model, test F stat (global test) stated that this model is significant because the p-value<0.05, so the model is acceptable in describing the dependent variable. With R2 of 0.858, or 85.8%, which means that the variation of ROA can be explained by variations of FDR, CAR, OE/TA, NFI/TA, NPF and MS, while the remaining 14.2% is explained by variations in the value of other variables that are not included in the model.
Based on appendix 2, Bank Muamalat Indonesia has a constant value most because since its presence on 27 Shawwal 1412 Hijri, Bank Muamalat Indonesia has opened the door to people who want to take advantage of Islamic banks. The presence of Bank Muamalat Indonesia is not only to position itself as the first bank to enforce sharia law, yet equipped with the advantages of real time network on line broadest in Indonesia and provides services through 312 outlets in 33 provinces, supported by a network of more than 3,800 post office online throughout Indonesia.
In second model, F test stat (global test) states that this model is significant because the p-value<0.05, so the model is acceptable in describing the independent variables. With the R2 of 0.669 means that 66.9% of the variation of GTA can be explained by variations of FDR, CAR, OE/TA, NFI/TA, NPF, and MS, while the remaining 33.1% is explained by variations in the value of other variables that are not included in the model.
Based on appendix 3, Bank Panin Syariah has a constant value most because Bank Panin Syariah began focusing its financing to the retail sector, consumer and commercial form of projects, construction services and trading. With this strategy, the bank is able to raise the target of financing up to 200% and 300% growth in total assets.
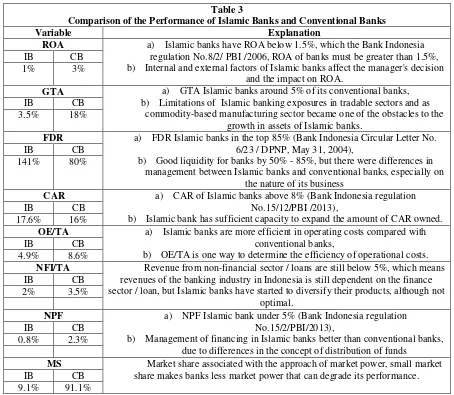
COMPARISON OF THE PERFORMANCE OF ISLAMIC BANKS AND CONVENTIONAL BANKS
Table 3
Comparison of the Performance of Islamic Banks and Conventional Banks
Variable Explanation
ROA a) Islamic banks have ROA below 1.5%, which the Bank Indonesia
regulation No.8/2/ PBI /2006, ROA of banks must be greater than 1.5%, b) Internal and external factors of Islamic banks affect the manager's decision
and the impact on ROA.
IB CB
1% 3%
GTA a) GTA Islamic banks around 5% of its conventional banks,
b) Limitations of Islamic banking exposures in tradable sectors and as commodity-based manufacturing sector became one of the obstacles to the
growth in assets of Islamic banks.
IB CB
3.5% 18%
FDR a) FDR Islamic banks in the top 85% (Bank Indonesia Circular Letter No.
6/23 / DPNP, May 31, 2004),
b) Good liquidity for banks by 50% - 85%, but there were differences in management between Islamic banks and conventional banks, especially on
the nature of its business
IB CB
141% 80%
CAR a) CAR of Islamic banks above 8% (Bank Indonesia regulation
No.15/12/PBI /2013),
b) Islamic bank has sufficient capacity to expand the amount of CAR owned.
IB CB
17.6% 16%
OE/TA a) Islamic banks are more efficient in operating costs compared with
conventional banks,
b) OE/TA is one way to determine the efficiency of operational costs.
IB CB
4.9% 8.6%
NFI/TA Revenue from non-financial sector / loans are still below 5%, which means revenues of the banking industry in Indonesia is still dependent on the finance sector / loan, but Islamic banks have started to diversify their products, although not
optimal.
IB CB
2% 3.5%
NPF a) NPF Islamic bank under 5% (Bank Indonesia regulation
No.15/2/PBI/2013),
b) Management of financing in Islamic banks better than conventional banks, due to differences in the concept of distribution of funds
IB CB
0.8% 2.3%
MS Market share associated with the approach of market power, small market
share makes banks less market power that can degrade its performance.
IB CB
9.1% 91.1%
IB is Islamic banking, CB is conventional banking
CONCLUDING REMARKS AND DIRECTIONS FOR FUTURE RESEARCH
This research found that return on asset Islamic banks in Indonesia affected by the non-performing financing and market share. While the growth of the total assets of Islamic banks in Indonesia is influenced by the capital adequacy ratio, the ratio of non-financing income by total assets, non-performing financing and market share.
It is interesting that the market share has a negative impact both on the profitability and growth of the total assets of Islamic banks. This shows that banks with low levels of market share, it will lack the potential of market forces in the industry, resulting in lower profitability and growth in total assets.
5%, means that Islamic banks are still operating below the minimum efficient scale, Islamic banks began operating under optimal level. although the first Islamic Bank operations in Indonesia already in 1992, but the business cycle of Islamic banks is still at the stage of introduction and maintain sustainability.
ACKNOWLEDGMENT
We are grateful for the financial support from the Indonesian Ministry of Research, Technology and Higher Education for Doctoral Dissertation Research Grant Scheme (Grant Number: 212/K3/KM/2014,May 2014, 7).
Thanks also to the strengthening of the Directorate General of Research and Development, of Research, Technology and Higher Education, which approved aid overseas seminars for researchers / lecturers in universities No. 894/E5.3/PB /2016, at June 13, 2016.
References
Aburime. Uhomoibhi Toni. (2009). Determinants of bank profitability: company-level evidence from Nigeria. Retrieved November 20, 2012, from http://www1.feb.vva.nl/rof/59.pdf.
Ahmed. Adel. (2010). Global Financial Crisis : an Islamic finance perspective. International Journal of Islamic and Middle Eastern Finance and Management, 3: 306 – 320.
Alam. Hassan Mobeen., Noreen, Hafsa., Karamat, Monazza., Ilyas, Muhammad (2011). Islamic banking: insulation against US credit crisis, International Journal of Business and Social Science, 2: 193-201.
Al-Omar&Al-Mutairi (2008). Bank-specific determinants of profitability:the case of Kuwait, Journal of Economic & Administrative Sciences, 24 (4) : 20- 34.
Athanasoglou, Panayiotis P. et, al (2008). Bank-specific, industry-specific and macroeconomic determinants of bank profitability. Journal of International Financial Markets, Institutions and Money, 18 (2) : 121–136.
Awojobi, Omotola. & Amel, Roya (2011). Analysis risk management in banks : evidence of bank efficiency and macroeconomic impact, Journal of Money, Investment and Banking, 22 : 147 – 162.
Benhayoun, Nesrin. Chairi Ikram. Gonnouni Amina El. Lyhyaoui Abdelouahid. (2014) Islamic banking challenges lie in the growth of Islamic economy despite of the free interest loans policy: evidences from support vector machine approach. ACRN Journal of Finance and Risk Perspectives, 3 : 19 – 31.
Bennaceur. Samy. & Goaied. Mohamed (2008). The determinants of commercial bank interest margin and profitability: evidence from Tunisia, Frontiers in Finance and Economics,5 (1) : 106 – 130.
Broome. Tracey. Robinson, Justin. Moore, Winston (2009). Liquidity and the firm size-growth nexus in Barbados, The Annual Review Seminar Research Department Central Bank of Barbados: 27-30.
Chapra. Umer M. & Khan, Tariqullah (2000). Regulation and spervision on Islamic bank, Islamic Development Bank, Islamic Research and Training Institue.
Das. Sanghamitra (1995). Size, age and firm growth in an infant industry: the computer hardware industry in India, International Journal of Industrial Organization, 13 : 111-126.
Dowd. Kevin (1999). Does asymetric information justify bank capital adequacy regulation?, Cato Journal, 19 (1): 39-47
Haron. Sudin (2004). Determinants of Islamic bank profitability, Working Paper Series 002 published in The Global Journal of Finance and Economics. USA. 1 (1).
Farook. Riyazi (2009). Global financial crisis unthinkable under Islamic banking principles. Retrieved November 20, 2012, from http://www.scribd.com/doc/14941038/Global-Financial-Crisis-Unthinkable-Under-Islamic-Banking-Principles-by-Riyazi-Farook.
Ghazali. Melaty binti (2008). The Bank-specific and macroeconomic determinants of Islamic bank profitability :
some international evidence. Retrieved November 20, 2012, from
http://dspace.fsktm.um.edu.my/bitstream/1812/752/3/FULL%20REPORT.pdf.
Hidayat. Sutan Emir. & Abduh. Muhamad (2012). Does financial crisis give impacts on Bahrain Islamic banking performance? a panel regression analysis international, Journal of Economics and Finance, 4 (7): 79 – 87. Irma. Setyawati., Dwi Kartini., Sulaeman Rachman., Erie Febrian (2015). Assesing the Islamic banking financial
performance in Indonesia, International Journal of Education and Research, 3 (10) : 233 – 348.
Jacobson. Robert (1988). Distinguishing among competing theories of the market share effect, Journal of Marketing, 52 (4) : 68 - 80
Kosmidou, Kyriaki. Zopounidis, Constantin (2008). Measurement of bank performance in Greece. South-Eastern Europe Journal of Economics, 1 : 79-95.
Kumar. Lakshmi. Malathy, D. Ganesh, L.S (2010). Productivity growth and efficiency change in Indian banking technology effect vs catch-up effect. Journal of Advances in Management Research, 7(2) : 194-218.
Loi. Teng Hou. Khan. Aslan Aslam (2012). Determinants of firm growth : evidence from Belgian companies, Faculteit Economie En Bedrijfskunde.
Misman. Faridah Najuna (2012). Financing structures, bank specific variables and credit risk: Malaysian Islamic bank. Journal of Business and Policy Research,7 (1) :102 -114.
Ningaye. Paul. Mathilde. Madaha Yemetio. Luc Nembot Ndeffo (2014). Competition and banking efficiency in the CEMAC zone. International Journal of Economics and Finance, 6 (6) : 127 – 139.
O’Hara. Maureen (1983). A dynamic theory of the banking firm. The Journal of Finance,38 (1) : 127 – 140. Olweny. Tobias & Shipho. Themba Mamba (2011). Effect of banking sectoral factor on the profitability of
commercial bank in Kenya. Economic and Finance Review, I (5) : l – 30.
Ongore. Vincent Okoth. Kusa. Gemechu Berhanu (2013). Determinants of financial performance of commercial banks in Kenya. International Journal of Economics and Financial, 3 (1) : 237-252.
Petersen. J. Mukuddem & Petersen. M.A (2008). Optimizing asset and capital adequacy management in banking. Journal Option Theory Appl, 137: 205 – 230.
Sapuan. Noraina Mazuin. Ramli. Afdzal Aizat. Roly, Mohammad Rahmdzey (2013). A panel co integration analysis of bank profitability and bank-specific variables in Islamic banks. Proceedings of 3rd Asia-Pacific Business Research Conference. Kuala Lumpur, Malaysia, ISBN: 978-1-922069-19-1.
Sarker, M.A.A. (1999) Islamic Banking in Bangladesh: Performance, Problems and Prospects. International Journal of Islamic Financial Services, 1 :
Schahwabach. Joachim (1991). Profitability and market share : a reflection on the functional relationship. Strategic Manajemen Journal, 12 : 229 – 306.
Shen. Chung-Hua. Chen. Yi-Kai. Kao. Lan-Feng. Yeh, Chuan-Yi (2009). Bank liquidity risk and performance.
Retrieved November 20, 2012, from
http://www.finance.nsysu.edu.tw/SFM/17thSFM/program/FullPaper/083-231345511.pdf
Sufian. Fadzlan (2010). Financial depression and the profitability of the banking sector of the Republic of Korea: panel evidence on bank-specific and macroeconomic determinants. Asia-Pacific Development Journal,17 (2) : 65 – 92.
Sufian. Fadzlan. & Habibullah. Muzafar Shah (2010). Assessing the impact of financial crisis on bank performance. ASEAN Economic Bulletin, 27 (3) : 245 – 262.
Toby. Adolphus J (2008). Monetary policy, capital adequacy regulation and banking system soundness in Nigeria : empirical research finding. Journal of Finance Management and Analysis, 2l (1) : 32 – 46.
Wasiuzzaman. Shaista. & Tarmizi. Hanimas-Ayu Bt Ahmad (2010). Profitability of Islamic bank in Malaysia : an empirical analysis. Journal of Islamic Economics, Banking and Finance,6 (4): 53 – 68.
Appendix
Correlation matrix of residuals:
ROA GTA
ROA 1.0000
GTA 0.2596 1.0000
Breusch-Pagan test of independence: chi2(1) = 26.694, Pr = 0.0000
Correlation matrix of between independent and dependent variable
| ROA GTA FDR CAR OE/TA NFT/TA NPF MS --- ---
ROA | 1.0000
GTA | 0.4335 1.0000
| 0.0000
FDR | -0.2301 -0.0775 1.0000
| 0.0000 0.1239
CAR | -0.2689 -0.1140 0.1173 1.0000 | 0.0000 0.0233 0.0196
OE/TA | -0.0348 -0.2329 -0.0682 -0.0237 1.0000 | 0.4902 0.0000 0.1758 0.6379
NFT/TA | 0.1697 0.0767 0.2302 -0.1274 0.1565 1.0000 | 0.0007 0.1276 0.0000 0.0112 0.0018
NPF | -0.3219 -0.1538 -0.2167 -0.1610 0.0281 -0.0398 1.0000 | 0.0000 0.0021 0.0000 0.0013 0.5771 0.4296
Calculating multi-step estimates...
Iteration 1 : relative difference = .20115857 Iteration 2 : relative difference = 1.996e-07
Seemingly unrelated regression (SUR) in panel data set One-way random effect estimation:
Independent variables: FDR CAR OE/TA NFI/TA NPF MS
5 | .217016 .162188 1.34 0.181 -.1008665 .5348986 6 | -2.480401 .4572835 -5.42 0.000 -3.37666 -1.584142 7 | -2.921601 .4374765 -6.68 0.000 -3.779039 -2.064163 8 | -2.43523 .4700106 -5.18 0.000 -3.356433 -1.514026 9 | -2.797434 .3562735 -7.85 0.000 -3.495717 -2.09915 10 | -2.575167 .4622784 -5.57 0.000 -3.481216 -1.669118 11 | -2.705334 .4356595 -6.21 0.000 -3.559211 -1.851457 _ cons | 3.086695 .4967078 6.21 0.000 2.113165 4.060224 GTA |
FDR | -.001543 .002792 -0.55 0.581 -.0039293 .0070153 CAR | -.0487558 .017278 -2.82 0.005 -.08262 -.0148916 OE/TA | -.0268107 .0246994 -1.09 0.278 -.0752206 .0215991 NFI/TA | .0701397 .0305957 2.29 0.022 .0101732 .1301063 NPF | .3343458 .1038255 3.22 0.001 .1308516 .53784
MS | -.0272949 .0306594 -0.89 0.073 -.0873863 .0327965 no |
2 | -2.129532 1.003536 -2.12 0.034 -4.096426 -.1626389 3 | -4.146054 1.27801 -3.24 0.001 -6.650907 -1.641201 4 | -3.539627 1.092646 -3.24 0.001 -5.681173 -1.398081 5 | -.5161643 .4305339 -1.20 0.231 -1.359995 .3276666 6 | -3.866157 1.213876 -3.18 0.001 -6.24531 -1.487004 7 | -3.620053 1.161297 -3.12 0.002 -5.896154 -1.343952 8 | -2.073701 1.247661 -1.66 0.096 -4.519071 .3716687 9 | -1.828005 .9457412 -1.93 0.053 -3.681624 .0256133 10 | .3746723 1.227135 0.31 0.760 -2.030468 2.779813 11 | -4.852752 1.156474 -4.20 0.000 -7.119399 -2.586104 _cons | 6.492819 1.318529 4.92 0.000 3.908549 9.077089 ---
hausman fe re
---- Coefficients ----
| (b) (B) (b-B) sqrt(diag(V_b-V_B)) | fe re Difference S.E.
--- FDR | -.0014729 -.0012655 -.0002074 .0003725 CAR | -.0004642 -.0015495 -.0020137 .0018587 OE/TA | -.0047918 -.0036624 -.0011294 . NFI/TA | .0014248 .0010784 .0003464 . NPF | -.1670913 -.1750695 -.3421608 . MS | -.0130985 -.0006698 -.0137683 .0051377 ---
b = consistent under Ho and Ha; obtained from sureg B = inconsistent under Ha, efficient under Ho; obtained from xtsur
Test: Ho: difference in coefficients not systematic chi2(6) = (b-B)'[(V_b-V_B)^(-1)](b-B)