Review Form EURASIAN CHEMICO-TECHNOLOGICAL JOURNAL
Editor-in-Chief Zulkhair A. MANSUROV
General Director of the Institute of Combustion Problems 050012, Almaty, 172 Bogenbay Batyr Str., Kazakhstan Tel: +7-727-292-43-46, Fax: +727-292-58-11
E-mail: [email protected] www.ect-journal.kz To Prof. __________________________ Please, find enclosed paper for review. With best wishes,
Editor Z.A. Mansurov
Title
Saccharification Kinetics at Optimised Conditions of Tapioca by Glucoamylase Immobilised On
Mesostructured Cellular Foam Silica
Author (s)
J. Agustian
1a*, L. Hermida
1bPlease review the enclosed paper using this form
If you cannot complete this review within two weeks contact Z.A. Mansurov immediately
To eliminate confusion, return your review onlu by e-mail without their duplicating transfer by post.
1. This paper is (please underline your Choice):
4 3 2 1 Excellent Good Marginal Unacceptable
(Ask you give as possible full evaluation of article, with the indication on concrete technical and language mistake)
Reviewer’s comment Author’s comment(if agreed with
reviewer, correct the manuscript and highlight that part in the manuscript. It is mandatory that authors should write his/her feedback here)
Compulsory
REVISION comments
Abstract
This needs some editing for English, for example: As the insoluble substrates such as tapioca can be used to make chemical compounds, saccharification of the tapioca by
glucoamylase that was immobilised on mesostructured cellular foam (MCF) silica using Box-Behnken Design of experiment was conducted to optimize this process so that the experimental results can be used to develop large-scale operations.
The kinetic constants (Vmax, KM) produced by the immobilised enzyme differed highly with from the values yielded by free glucoamylase indicating reduction of substrate access to enzyme active sites indeed had occurred.
Introduction
Similar minor editing for English required.
Methods
Line 99: centrifugation force should be expressed
in ‘g’ as rpm produces different force dependent
on the radius of the centrifuge.
The abstract has been improved based-on:
1. The reviewer suggestions (highlighted in yellow).
2. Other parts considered important by authors (highlighted in green).
The Introduction:
Some improvements have been made on this part as given in highlighted words.
The Methods:
We consider it is the line no. 91. The unit
Review Form EURASIAN CHEMICO-TECHNOLOGICAL JOURNAL
Editor-in-Chief Zulkhair A. MANSUROV Director of the Institute of Combustion Problems 050012, Almaty, 172 Bogenbay Batyr Str., Kazakhstan Tel: +7-727-292-43-46, Fax: +727-292-58-11
E-mail: [email protected] www.icp.kz
Results and Discussion
Minor editing for English required.
It is unclear what Figure 6 is demonstrating and from where the values of maximum reaction rate are derived.
The Results and Discussion:
1. This part has been modified as highlighted in the texts.
2. Explanations on how to determine the kinetic constants from the applied equation have been added (highlighted texts).
Minor REVISION comments - -
Eurasian Chemico-Technological Journal 20 (2018)
Saccharification Kinetics at Optimised Conditions of Tapioca by
Glucoamylase Immobilised on Mesostructured Cellular Foam Silica
J. Agustian and L. Hermida
Department of Chemical Engineering, Universitas Lampung, Bandar Lampung 35145, Lampung, Indonesia
1. Introduction
Mesoporous silicas, one of the important ma-terials for enzymes’ supports, have been used to immobilise free glucoamylase by applying various immobilisation methodologies. The materials pre-pared from tetraethoxysilane and phenyltriethox-ysilane had successfully encapsulated this enzyme where the product was used for many cycles in sol-uble starch hydrolysis [1]. Functionalised ordered mesoporous silicas were also developed to support glucoamylase covalently to give the immobilised enzyme capable to hydrolyse soluble starch
ef-ficiently [2, 3]. Previously, Szymanska et al. [4]
immobilised glucoamylase on functionalised me-sostructured cellular foam (MCF) silica where the immobilised enzyme was used to saccharify the soluble starches.
Saccharification of insoluble starches based-on
the silica supports is not found yet. As ethanol and other chemicals can be made from the insoluble
substrates via fermentation, saccharification of tap -ioca starch using glucoamylase immobilised on the
MCF silica is required as knowledge on the pro -cess are needed to develop large-scale operations. Variation of the operational factors simultaneously through a factorial experimental design is
consid-ered as the correct way to deal with the factors [5].
Since optimisation of process is considered to be a step to define the optimum conditions by evaluat -ing the interactions of the operational factors [6],
to optimize the tapioca saccharification using the
glucoamylase immobilised on the MCF silica, a
re-sponse surface methodology based-on Box-Behnk -en design is herewith reported. The optimized
results were used to measure the kinetics of the reac -tion. Reusability of the immobilised glucoamylase was also evaluated under the optimized conditions.
2. Experimental
2.1. Chemicals and Biochemical
Pluronic® P123 (435465), mesithylene (>98%), tetraethyl orthosilicate (>99%) and sodium ace
-tate (>98%) were purchased from Sigma Aldrich. Ammonium fluoride (>98%), HCl (37%), di-sodi
-um hydrogen phosphate dodecahydrate (>99%), D(+)-glucose monohydrate (>99%) and potassi
-um dihydrogen phosphate (>99%) were supplied by Merck Indonesia. Glucoamylase LYPH170122 (30.000 U g-1) were imported from Xi’an Lyphar Biotech Co. Ltd. (China). Tapioca was bought from a supermarket.
Abstract
As insoluble substrates such as tapioca can be used to make chemical compounds, saccharification of tapioca by glucoamylase immobilised on mesostructured cellular foam (MCF) silica using Box-Behnken Design of experiment was conducted to optimize this process so that the experimental results can be used to develop large-scale operations. The experiments gave dextrose equivalent (DE) values of 6.15–69.50% (w/w). Factors of pH and temperature affected the process highly. The suggested quadratic polynomial model is significant and considered acceptable (R2 = 99.78%). Justification of the model confirms its validity and adequacy where the predicted DE shows a good agreement with the experimental results. The kinetic constants (Vmax, KM) produced by the immobilised enzyme differed highly from the values yielded by free glucoamylase indicating reduction of substrate access to enzyme active sites had occurred.
Article info
Received:
Received in revised form:
2.2. Synthesis of MCF Silica (9.2T-3D)
A method developed by Hermida et al. [7] was used. 4 g Pluronic® P123 was dissolved in 70 mL of HCl (1.6 M) at ambient temperature in a flask. Then, 3.4 mL trimethylbenzene was added. The mixture was stirred at 750 rpm and 40 °C for 2 h. After 9.2 mL tetraethyl orthosilicate was put in. It was stirred at 1.000 rpm for 5 min and later kept in water bath for 20 h at 40 °C. 5 ml NH4F (46 mg per 5 mL) was inserted under slow stirring. The mixture was kept in water bath for 72 h at 80 °C. After 3 days, it was cooled to ambient temperature and filtered. The solids were dried at 100 °C for 12 h. They were calcined at 300 °C for 30 min and continued at 500 °C for 6 h in order to obtain the
MCF silica.
2.3. Immobilisation Process
Immobilization of glucoamylase was conduct
-ed directly without pre-treatment. 60 mg enzyme was dissolved in 30 mL Sorensen phosphate buffer 100 mM pH 5.5. Then, 500 mg MCF silica was added. The mixture was shaken at 100 rpm and 30 °C in Medline BS-31 unit. After 5 h, the mix
-ture was filtered. Filtrate was kept in refrigerator
before protein analysis was conducted, whilst
res-idue was washed with Sorensen buffer (3×50 mL) based on the immobilisation pH. The filtrate from the washing was also kept in refrigerator before the
protein analysis. Residue was dried in desiccator at room temperature overnight. The dried immobil-ised enzyme was stored in refrigerator. Amount of enzyme on support was calculated as follows:
100
2.4. Enzyme Specific Activity
Bernfeld method as described by Milosavic et
al. [8] was used to determine activity of both free and immobilised enzyme. 4 g soluble starch was dissolved in 100 mL 0.05 M sodium acetate buffer pH 4.5 and homogenized. Then 25 mL of the solu
-tion was poured in two 100 Ml Erlenmeyer flasks where 50 mg immobilised enzyme was put into the first flask and 25 mg free enzyme was added into
the second Erlenmeyer. Both Erlenmeyers were
placed in water bath shaker at 60 °C and 140 rpm. Samples were withdraw every 5 min for 30 min. The samples were centrifuged at 1000 g for 3 min before DNS (dinitrosalicylic acid) analysis were conducted. One glucoamylase unit (U) was defined
as the amount of enzyme, which released reducing carbohydrates equivalent to 1 µmole glucose from soluble starch in 1 min.
2.5. Design of Experiment (DOE)
Saccharification of tapioca was optimised using Box Behnken Design (BBD). The design was pre
-pared and analysed using Design Expert® v. 6.0.6
software. Three reaction factors were studied as described in Table 1. Dextrose equivalent value (DE) was set as response.
2.6. BBD Experimental Procedure
30 mL 0.1 M sodium acetate buffer solution pH 4.3–4.9 were placed in 100 mL Erlenmeyer flasks. Then tapioca starch was dissolved in each flask at concentration of 3% (w/v). 400 mg immobilised
glucoamylase was added into the tapioca solution.
The flasks containing the mixture were placed in water bath shaker where temperature and agitation speed were set at 65–75 °C and 130–150 rpm, re
-spectively, for 8 h. All experiments used operating conditions provided by DOE. Initial and final sam -ple were collected and measured their DE value
using DNS analysis.
Table 1
The experimental factors and their levels
Factor Name Unit Type Low Actual High Actual Low Coded High Coded
A Buffer pH - Numeric 4.30 4.90 -1 +1
B Temperature °C Numeric 65.00 75.00 -1 +1
C Agitation Speed rpm Numeric 130.00 150.00 -1 +1
where Co is initial free enzyme concentration (mg mL-1), Ct is final free enzyme concentration (mg mL-1), and V is reactor working volume (mL).
2.7. Determination of Kinetics
To determine kinetic constants of the sacchari
-fication process (Vmax, KM), the initial rate of
reac-tion was investigated by varying the concentrareac-tion
of tapioca starch in the range of 0.5–5.0% (w/v) in 30 mL 0.1 M sodium acetate buffer pH 4.6. The pro
-cess was set at 70 °C and 140 rpm for 4 h. 400 mg of enzyme was added into the starch solution. Sam
-ples were withdraw every half an hour for the DNS
analysis. The kinetic constants were evaluate using
Chem SW Enzyme Kinetics!Pro.
2.8. Reusability of Immobilised Enzyme
Reusability of immobilized glucoamylase was performed in a batch reactor. The process was
con-ducted as follows: 3% (w/v) tapioca was dissolved in a 100 mL Erlenmeyer flask containing 30 mL 0.1 M sodium acetate buffer pH 4.6. Then, 400
mg immobilised glucoamylase was added in. The
flask was placed in water bath shaker set at tem
-perature of 70 °C and agitation speed of 140 rpm for 8 h. Initial and final sample were collected for DE value measurements. After the saccharification process, the immobilised enzyme was filtered-off and washed with 0.1 M sodium acetate buffer pH 4.6 (3×50 mL). The filtered immobilised enzyme
was reintroduced into a fresh reaction medium and
checked its performance. Activity of the immobil
-ised enzyme in the 1st run was identified as 100%.
Activities obtained in other runs were compared with that of the 1st run.
2.9. Estimation of protein and glucose
PierceTM BCA protein assay was used to esti -mate protein content by the standard method
pro-vided by manufacturer. Hydrolysis of starch to glu
-cose was determined by the DNS analysis method.
The enzyme contents and glucose samples were
observed using spectrometer Shimadzu UV-VIS 1800.
2.10. Characterization (FTIR, SEM)
Average cell pore size was evaluated using
Barrett-Joyner-Halenda (BJH) method from the
adsorption branch of the isotherm data. Average
window pore size was evaluated using BJH meth
-od from the desorption branch. SBET was calcu -lated using Brunauer-Emmett-Teller (BET)
meth-od. Samples (support and enzyme) were analyzed
using Zeiss EVO field emission scanning electron microscope (SEM), equipped with an Oxford IN -CAX act, energy dispersive X-ray (EDX)
micro-analysis system, to obtain SEM images and chem -ical compositions. Further samples were observed
using Frontier Perkin Elmer FTIR unit.
3. Results and Discussion
3.1. Immobilised Glucoamylase
Adsorption of the free glucoamylase on MCF
silica (9.2T-3D) (SBET: 378 m2 g-1; Vpore: 2.12 cm3
g-1; dcell: 235 Å; dwindow: 158 Å) gave the immobil -ised enzyme with 82.06% (w/w) load. The load
was quite high as the enzyme has lower size than
the support (~ 80 Å). Compared with other enzyme
supports, the immobilisation of glucoamylase on
the MCF silica (9.2T-3D) produced a good result. Milosavic et al. [8–9] immobilised 16–19% (w/w) the free glucoamylase on poly(GMA-co-EGDMA). Later, Guo et al. [10] obtained 2.7–12% (w/w)
loads of the glucoamylase on carboxyl magnetic
nanoparticles (CMNPs). Other researchers found less than 30% (w/w) loads of the glucoamylase of polypropylene fibers, magnetic clay, magnetic
chitosan and magnetic carbon nanotubes supports
[11–14].
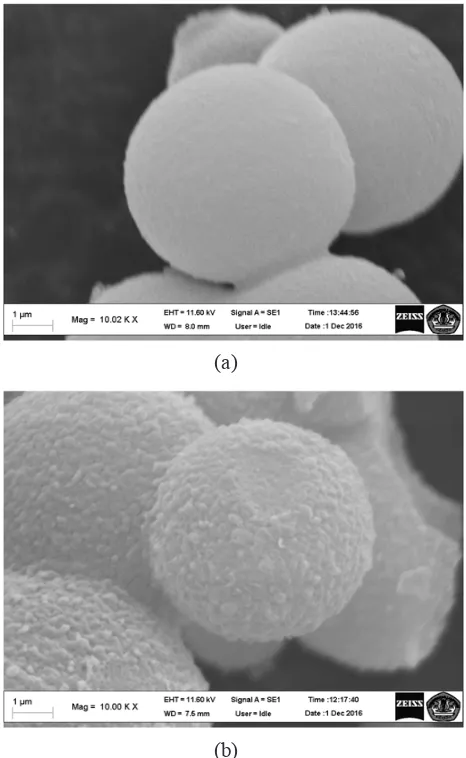
SEM analysis on the MCF silica (9.2T-3D) con
-firmed changes of the support surfaces from smooth (Fig. 1a) to rough (Fig. 1b). The figures compari -son proved presence of the enzyme on the support.
A further observation on the FT-IR spectrum of the MCF silica (9.2T-3D) as described in Fig. 2 showed its vibrations at 1300 cm-1 and 850 cm-1 with peak at 1061 cm-1 to indicate Si–O-Si stretch
-ing vibration. These vibrations were also observed on the immobilized enzyme, however, additional
vibrations at 2020 cm-1 and 1900 cm-1 were found. The vibration observed at 1962 cm-1 confirmed the C≡N or C≡C bounds on the support surfaces [15].
Because glucoamylase is a protein consisting of a
single polypeptide chain of amino acids, the 1962
cm-1 vibration indicated the presence of protein on
the support.
The free and immobilised glucoaaylase used in the experiments were found to have the
specif-ic activity of 30.335.17 U g-1 and 1.856.78 U g-1, respectively. The specific activity reduction after
the immobilisation process was frequently found because conformational changes on enzyme
with other results, the immobilised glucoamylase
on MCF silica (9.2T-3D) has a better specific ac
-tivity since the specific ac-tivity of this enzyme on poly(GMAco-EGDMA) was only 1.100 U g-1 [8, 9], while the glucoamylase on Sibunit gave the val
-ue of 420–540 U g-1 [18].
Fig. 1. SEM images of supporting material (a) and glucoamylase on support (b).
Fig. 2. The FTIR spectra.
3.2. Statistical DOE
Saccharification of tapioca was designed by combining 3 experimental factors with 3 levels based-on Box-Behnken Design (BBD). This de
-sign required 17 experimental runs as described in Table 2. Dextrose Equivalent (DE) were found in the range of 6.15–69.50% (w/w) where the high
-est result was produced at pH 4.3, temperature of 70 °C and agitation speed of 130 rpm, whilst the lowest DE was obtained at conditions of pH 4.9, 65 °C and 140 rpm.
The sequential model sum of squares analysis concludes that the developed statistical quadratic
model is significant in explaining relationship be -tween the response and factors including the
facto-rial interactions during the process where the P>F value is < 0.0001. The model is not aliased and has a low standard deviation (i.e. 1.75%). It is defined
as follows:
DE = 9.655.35 + 702.28 (pH) + 191.51 (temperature) + 18.97 (agitation speed) –
55.55 (pH)2 – 1.21 (temperature)2 – 0.05
(agitation speed)2 – 2.42 (pH × temperature) –
0.37 (pH × agitation speed) – 0.04 (temperature × agitation speed) (2)
Table 2
Box-Behnken Design matrix
Run Independent Variables DE (% (w/w))
x1: Buffer
pH
x2:
(°C) Agitation x3: Speed
(rpm)
Observed Predicted
1 4.6 65 130 8.77 9.61
2 4.6 70 140 68.41 68.41
3 4.6 70 140 68.41 68.41
4 4.3 65 140 15.03 14.99
5 4.9 65 140 6.15 3.87
6 4.9 75 140 43.82 43.86
7 4.9 70 150 44.61 45.41
8 4.3 75 140 67.25 69.52
9 4.6 70 140 68.41 68.41
10 4.3 70 130 69.50 68.70
11 4.6 70 140 68.41 68.41
12 4.6 70 140 68.41 64.41
13 4.6 75 150 52.82 51.97
14 4.9 70 130 51.12 52.55
15 4.3 70 150 67.47 66.04
16 4.6 65 150 7.31 8.76
17 4.6 75 130 62.42 60.95
(a)
The analysis of variance indicates that the
mod-el fitts wmod-ell and satisfactory. Coefficient of deter -mination (R2) is 99.78%, while the adjusted and predicted R2 are 99.49% and 96.41%, respective -ly. As the R2 are more than 95%, hence more than
95% of the actual data can be explained by the model [5]. Only 0.22% of the total variations were
not described by the model. The R2 is acceptable as the closer the R2 value to unity, the better the
mod-els fits the data [19, 20]. The predicted responses
matched the experimental results reasonably well with the R2 of more than 95% (Fig. 3). Sebayang et
al. [21] obtained the R2 of 99.14% in optimization of reducing sugar production from Manihot
glazio-
Fig. 3. The parity plot of the actual versus predicted DE.
vii starch using BBD. The optimization of polysac-charides hydrolysis using Central Composite De-sign (CCD) gave the R2 of 86.36–96.94% [22–25]. Therefore, this model is applicable and reliable and can be used to simulate the process.
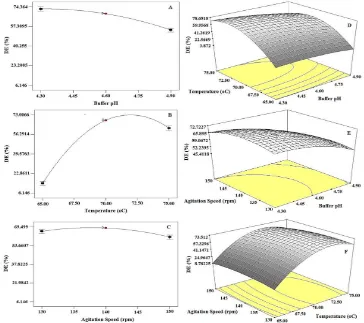
3.3. Mutual effects of factors
Effects of the operational factors (x1-x3) are giv-en in Table 3. Individually, pH (x1) and tempera-ture (x2) showed significant effects on the process by changing the response highly as described in
Fig. 4. A slight reduction (<5%) was found when pH was increased from 4.30 to 4.45, but further in
-creases reduced the DE quickly. The buffer pH that
produced the highest DE was similar to the
previ-ous observations conducted by Milosavic et al. [8, 9, 26] who concluded the optimum operational pH for the immobilised glucoamylase were 4.5. Tem -perature factor increased the DE rapidly when it
was changed from 65 °C to around 72 °C, howev -er, reduction of DE values were obtained when fur-ther temperature elevations were made. Although the agitation speed (x3) tended to decrease the re-sponse, its effect was considered low and not
sig-nificant. The speeds up to 150 rpm were frequently found in the starches hydrolyses [21, 27, 28].
Three interactions were found. They are
obtained at the lowest operational temperature
(65 °C) for the all employed pHs. The pH and ag -itation speed interaction (x1x3) resulted the maxi-mum DE of 66.19% at pH of 4.30–4.65 and agi
-tation speed of 130–150 rpm. The minimum DE given by this interaction was 53.72%. The last
interaction, the agitation speed and temperature (x2x3), developed the DE values the same as the first interaction. The highest DE was obtained at
the combination of the operating conditions at
temperatures of around 69.5–74.5 °C and agitation speed of 130–150 rpm, whilst the lowest result was produced at temperature of less than 66 °C and ag
-itation speed of 130–150 rpm.
Table 3
Summary of the factorial effects
Factor Effects
x1 High Antagonist Significant
x2 High Synergist Significant
x3 Low Antagonist Not Significant
x1x2 High Antagonist Significant
x1x3 Low Antagonist Significant
x2x3 High Synergist Significant
3.4. Model Verification
Examination must be performed to conclude that the predicted and experimental results
pro-duced at the optimum conditions are the same [29].
From the above description, the constraints used
to obtain the optimum values for the saccharifica -tion process using immobilised glucoamylase on
MCF silica were pH (level: 4.6; range: 4.3–4.9), temperature (level: 70 °C; range: 65–75 °C), ag
-itation speed (level: 140 rpm; range: 130–150 rpm), and DE (range: 6.15–69.50%). To verify the
model, some proposed solutions for the optimum conditions were tested. The results are described
in Table 4. The experimental DE are reasonably
closed to the predicted values where most of them
are lower than the modelling results. 3 out 5 ex -perimental data show the relative errors of less
than 5% (i.e. 0.204–3.107%), which are accept
-able as they are in the range of 95% confidence level. The other results have the errors of 8.226%
and 9.297%, which are tolerable as errors around 10–15% are considered good in the optimization processes [30]. These descriptions confirmed va -lidity and adequacy of the predicted model.
Table 4
Predicted and experimental results at the optimum conditions
4.6 70 140 68.41 68.55 0.14
4.3 70 150 66.04 64.05 -1.99
4.6 65 130 8.78 8.63 -0.15
4.6 75 150 51.97 48.02 -3.95
4.9 70 130 52.55 48.08 -4.47
3.5. Steady State Kinetics
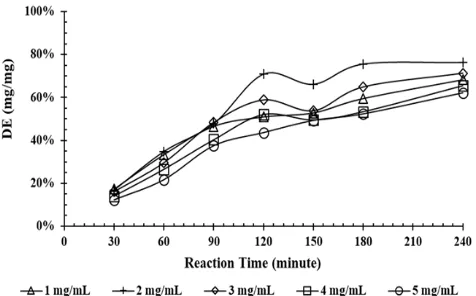
Formation of reducing sugars during initial re-action rate observations at various tapioca starch
concentrations (1–5 mg mL-1) is illustrated in Fig.
5. All employed concentrations almost have the same reaction rates during four hours. DE values
were less than 20% (w/w) (all concentrations) in the first 30 min. After 90 min, DE were tripled to 40.34–48.43% (w/w) proving that the active sites of the enzyme was not difficult to be accessed by the starch. Slow increases in DE were found after the process run for 2 h. Approximately 50% (w/w) DE was obtained after 150 min.
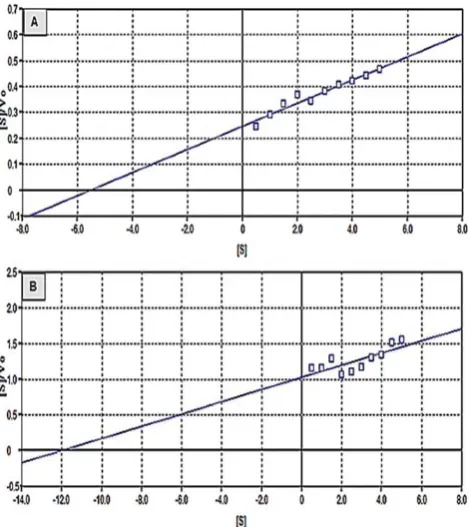
The kinetics constants, KM and Vmax, were
deter-mined by using the Michaelis-Menten model as
de-scribed in Eq. 2. Both constants were analysed using Hanes-Woolf plot (Eq. 3) because this plot gives
low deviations from true KM and Vmax [31]. The er
-rors resulted by the plot are distributed more evenly
than Linewaver-Burk and Eadie-Hoftsee plot [32].
]
lis-Menten constant, Vmax is the maximum reaction rate and [S] is concentration of substrate. Regres
-sion of Eq. (4) by plotting ([S]/Vo) versus [S] gave (1/Vmax) as the slope and (KM/Vmax) as the intercept. The KM and Vmax were determined from the slope and intercept. Figure 6 describes the Hanes-Woolf
plot for both glucoamylase types.
The KM value for the immobilised glucoamylase
is higher than the free enzyme. The immobilised en-zyme has the KM of 14.23 mg mL-1, whilst the K
M for the free glucoamylase is 4.83 mg mL-1. The increase
of the KM value after immobilisation indicates that the enzyme has low affinity on the substrate, which
could be caused by change of the enzyme structure that decreased the accesability of the enzyme active
sites [33]. From the plot, it is found that the maxi
-mum reaction rates of the saccharification process
catalyzed by the immobilised enzyme (Vmax) is 0.07
mg mL-1 min-1. However, the free enzyme gives the
Vmaxof 0.10 mg mL-1 min-1. The lower Vmax
empha-sizes that reduction of the enzyme activity relates
to the change of the enzyme structure and difficult access to the enzyme active sites [3].
Fig. 6. The Hanes-Woolf plot (A: Free enzyme; B: Immobilised enzyme).
3.6. Reusability Study
Kalburcu et al. [34] described that reusability of
an enzyme immobilised on a matrix is a must for
large-scale operations. Hence, a study on repeated
uses of the immobilised glucoamylase on MCF
sil-ica (9.2T-3D) was conducted to know its activity after many saccharificarion processes as shown in Fig. 7. It was observed that the immobilised en
-zyme activity decreased rapidly to 68.83% after
the second cycle. The gradual decreases continued
where the enzyme had activity of ± 50% after 5 cy -cles. The last observation found that its activity
de-creased to 21.52% after 10 cycles. Demirkan et al. [35] found the enzyme activity as high as 38% after 6 cycles. Later, Ashly et al. [36] summarized that the immobilised amylase had 20% activity after 10
times used in the process. Reductions in the immo-bilised glucoamylase activity were mainly caused by treatment of the enzyme after the reaction was conducted where the immobilised enzyme must be washed several times with the buffer solutions that
caused enzyme leaching from the support [35, 36].
4. Conclusions
In conclusion, the enzymatic saccharification
of tapioca starch using glucoamylase adsorbed
on surfaces of MCF silica (9.2T-3D), which had the specific activity of 1.856.78 U/g, was investi -gated. The statistical design of experiment using
Box-Behnken response surface method with 3 op -erational factors gave the DE values in the range
of 6.15–69.50% (w/w). The proposed polynomi -al quadratic model is acceptable where the R2 is 99.78%. The justification confirmed the model va
-lidity and adequacy. Its predicted values matched the observed values reasonably well. pH and tem
-perature are considered significant and give high
effects on the DE. All interactions show their
sig-nificancy on the developed model. The saccharifi -cation using the immobilised enzyme gave the KM
and Vmax of 14.23 mg mL-1 and 0.07 mg mL-1 min-1, respectively, which differed highly with the kinetic
constants developed by the free glucoamylase and indicated the reduction of the substrate access to the enzyme active sites.
Acknowledgements
Both authors thank deeply for the financial support for this research provided by Universitas Lampung via The Superior Research Grant No. 270/UN26.21.PN/2017.
References
[1]. B. Vlad-Oros, G. Preda, Z. Dudas, M. Dragomirescu, A. Chiriac, Processing and
Application of Ceramics 1 (2007) 63–67. DOI:
10.2298/PAC0702063VR.
[2]. R. George, S. Gopinath, S. Sugunan, Bull. Chem.
React. Eng. Cat. 8 (2013) 70–76. DOI: 10.9767/
bcrec.8.1.4208.70-76]
[3]. R. George, S. Sugunan, J. Mol. Catal. B:
Enzym. 106 (2014) 81–89. DOI: 10.1016/j.
molcatb.2014.04.016
[4]. K. Szymanska, J. Bryjak, J. Mrowiec-Białon, J.B. Jarzebski, Micropor. Mesopor. Mat. 99 (2007) 167–175. DOI: 10.1016/j. micromeso.2006.08.035
[5]. D.C. Montgomery, “Design and analysis of
experiments”. Fifth ed., John Wiley & Sons Inc., London, 2001.
[6]. A. Soyer, E. Bayraktar, U. Mehmetoglu, Prep.
Biochem. Biotech. 40 (2010) 389–404. DOI:
10.1080/10826068.2010.525433
[7]. L. Hermida, A.Z. Abdullah, A.R. Mohamed, “Nickel functionalized mesostructured cellular
foam (MCF) silica as a catalyst for solventless deoxygenation of palmitic acid to produce
diesel-like hydrocarbons”, Materials and processes for energy: communicating current research and
technological development (A. Mendez-Villas
(ed.), 2013, pp. 312–319.
Biot. 91 (2011) 591–601. DOI:
10.1007/s00253-011-3299-y
Introduction to Protein 2D IR Spectroscopy. In: Fayer MD, editor. Ultrafast Infrared Vibrational Spectroscopy. CRC Press; New York: 2013. pp. 361–404.
[16]. D.A. Butterfield, D. Bhattacharyya, S. Dannert,
L. Bachas, J. Membr. Sci. 181 (2001) 29–37. DOI: 10.1016/S0376-7388(00)00342-2
[17]. A. Dwevedi, Basics of Enzyme Immobilization. In: Enzyme Immobilization. Springer, Cham, 2016. DOI: 10.1007/978-3-319-41418-8_2 [18]. G.A. Kovalenko, L.V. Perminova, T.G.
Terent’eva, G.V. Plaksin, Appl. Biochem.
Micro. 43(4) (2007) 374–378. DOI: 10.1134/
Technol. 51 (2012) 1600–1605. DOI: 10.1007/
s13197-012-0678-z
[23]. R.M. Collares, L.V.S. Miklasevicius, M.M. Bassaco, N.P.G. Salau, M.A. Mazutti, D.A. Bisognin, L.M. Terra, J. Zhejiang Univ.-Sc. B 13 (2012) 579–586. DOI: 10.1631/jzus.B1100297 [24]. N. Nadir, M. Mel, M.I.A. Karim, R.M. Yunus.
The Institution of Engineers Malaysia 71 (3) (2010) 26–34.
[25]. N. Peatciyammal, B. Balachandar, M.D. Kumar, K. Tamilarasan, C. Muthukumaran, International Journal of Biomedical and
Biological Engineering 4 (2010) 126–130.
urn:dai:10.1999/1307-6892/11992
[26]. N.B. Milosavić, R.M. Prodanović, S.M. Jovanović, Z.M. Vujčić, APTEFF 35 (2004) 207–214. DOI 10.2298/APT0435207M
Eurasian Chemico-Technological Journal 20 (2018)
Zaidul, Food Hydrocolloid. 23 (2009) 434–440. DOI: 10.1016/j.foodhyd.2008.03.009
[28]. G. Zhao, J. Wang, Y. Li, H. Huang, X. Chen,
Biochem. Eng. J. 68 (2012) 159–166. DOI:
10.1016/j.bej.2012.04.009
[29]. M.J. Anderson, P.J. Whitcomb, “DOE Simplified: Practical tools for effective experimentation”, Second ed., Productivity Press, New York, 2007. [30]. M.S. Montilha, M.F. Sbroggio, V.R.G.
Figueireido, E.I. Ida, L.E. Kurozawa, Int. Food
Res. J. 24 (2017) 1067–1074.
[31]. R.A. Copeland, “Enzymes: A Practical Introduction to Structure, Mechanism, and Data Analysis”, Wiley-VCH Inc., New York, 2000. [32]. H. Bisswanger, “Enzyme Kinetics: Principles
and Methods”, Wiley-VCH Verlag GmbH., Weinheim, 2002.
[33]. G. Bayramoglu, M. Yilmaz, M.Y. Arica, Food
Chem. 84 (2004) 591–599. DOI: 10.1016/
S0308-8146(03)00283-8
[34]. T. Kalburcu, M.N. Tuzmen, S. Akgol, A.
Denizli, Turk. J. Chem. 38 (2014) 28–40. DOI: 10.3906/kim-1301-87
[35]. E. Demirkan, S. Dincbas, N. Sevinc, F. Ertan,
Romanian Biotech. Lett. 16 (2011) 6690–6701.
cf15529aefcc18768d33a60049832e0fb310.pdf [36]. P.C. Ashly, M.J. Joseph, P.V. Mohanan, Food