A randomized
controlled trial of early
dietary supply of
long-chain polyunsaturated
fatty acids and mental
development in term
infants
Eileen E Birch*PhD; Sharon GarfieldMS; Dennis R HoffmanPhD; Ricardo UauyMD PhD;
David G BirchPhD, Retina Foundation of the Southwest, 9900 N Central Expressway, Suite 400, Dallas, TX 75231, USA.
*Correspondence to first author at address above. E-mail: [email protected]
The effects of dietary docosahexaenoic acid (DHA) supply during infancy on later cognitive development of healthy term infants were evaluated in a randomized clinical trial of infant formula milk supplemented with 0.35% DHA or with 0.36% DHA and 0.72% arachidonic acid (AA), or control formula which provided no DHA or AA. Fifty-six 18-month-old children (26 male, 30 female) who were enrolled in the trial within the first 5 days of life and fed the assigned diet to 17 weeks of age were tested using the Bayley Scales of Infant Development, 2nd edition (BSID-II) (Bayley 1993) at the Retina Foundation of the Southwest, Dallas, TX. These children had also been assessed at 4 months and 12 months of age for blood fatty-acid composition, sweep visual evoked potential (VEP) acuity, and forced-choice preferential looking (FPL) acuity (Birch et al. 1998). Supplementation of infant formula with DHA+AA was associated with a mean increase of 7 points on the Mental Development Index (MDI) of the BSID-II. Both the cognitive and motor subscales of the MDI showed a significant developmental age advantage for DHA- and DHA+AA-supplemented groups over the control group. While a similar trend was found for the language subscale, it did not reach statistical significance. Neither the Psychomotor Development Index nor the Behavior Rating Scale of the BSID-II showed significant differences among diet groups, consistent with a specific advantage of DHA supplementation on mental development. Significant correlations between plasma and RBC-DHA at 4 months of age but not at 12 months of age and MDI at 18 months of age suggest that early dietary supply of DHA was a major dietary determinant of improved performance on the MDI.
The role of specific nutrients present in human milk in pro-moting optimal cognitive development is controversial (Beijers 1992, Crawford et al. 1992, Dobbing 1992, Doyle et al. 1992, Houghton 1992, Jacobson and Jacobson 1992, James 1992, Lucas and Cole 1992, MacArthur et al. 1992, Rice 1992, Wright and Deary 1992). There are many publications dealing with the advantages of breastfeeding over formula feeding on later mental aptitude and scholastic achievement scores; how-ever, it is difficult in most studies to discern whether the advan-tage of breastfeeding resides in the nutrient composition of human milk or is due to maternal variables associated with the decision to breastfeed (e.g. IQ, education level, socioeconom-ic status, maternal–infant interaction) and the act of breast-feeding itself (Hoefer and Hardy 1929, Rogerson and Rogerson 1939, Pollock 1989, Bouchard and Lykken 1990, Doyle et al. 1992, Jacobson and Jacobson 1992, Lucas et al. 1992). Recently, in randomized clinical trials of infant formula composition, there has been evidence that a specific nutrition-al component of human milk, docosahexaenoic acid (DHA), may confer an advantage in cognitive development. DHA in the diet of preterm or term infants has been associated with higher mental development scores (measured on the Mental Development Index [MDI] of the Bayley Scales of Infant Development) (Carlson 1990, Damli et al. 1996), higher psy-chomotor development scores (Brunet-Lezine Test) (Agostini et al. 1995), shorter-look durations to novel stimuli on the Fagan test (Carlson and Werkman 1996), and better prob-lem-solving skills (Infant Planning Test) (Willats et al. 1998). On the other hand, DHA in the infant diet has also been reported to be associated with poorer psychomotor develop-ment scores (Bayley Scales Psychomotor Developdevelop-ment Index [PDI]) (Carlson 1993) and poorer vocabulary compre-hension and production (MacArthur Communicative Inventory) (Janowsky et al. 1995).
More commonly, randomized clinical trials of DHA supple-mentation of preterm or term infant formula milks have employed measures of visual acuity as indices of the function-al status of the brain (e.g. Birch et function-al. 1992; Carlson et function-al. 1996a, b; Auestad et al. 1997). The focus on visual-acuity out-comes makes sense from the point of view that quantitative, reliable, valid techniques are available for the infant age range, including visual evoked potential acuity and preferential look-ing acuity (Birch 1989). It is important to keep in mind that the motive for visual-acuity assessment in studies of DHA supple-mentation has not been detection of visual deficits requiring ophthalmological care or early educational intervention but, rather, the quantification of subtle differences in visual acuity as indirect measures of differences in the maturation of brain function. However, in the context of clinical trials of infant nutrition, it is unknown whether early measurement of infant visual acuity is predictive of later cognitive function.
The primary aim of our study was to evaluate the effects of dietary DHA supply during early infancy on later cognitive development of healthy term infants in the context of a ran-domized double-blind clinical trial. A second aim was to determine whether early measures of infant visual acuity are predictive of later cognitive development.
Method PARTICIPANTS
the first 5 days of life. All participants were born at 37 to 40 weeks postmenstrual age as determined by early sonogram, date of last menstrual period, and physical and neurodevel-opmental assessment at birth. Only singleton births with birthweights appropriate for gestational age were included. Exclusion criteria were family history of milk-protein allergy, genetic or familial eye disease (e.g. hereditary retinal disease, strabismus), vegetarian or vegan maternal dietary patterns, maternal metabolic disease, anemia, or infection, presence of a congenital malformation or infection, jaundice, perina-tal asphyxia, meconium aspiration, and any perinaperina-tal event which resulted in placement of the infant in the neonatal intensive care unit.
Parents of eligible neonates were provided with a brief information sheet about the dietary study only after hospital records noted that they had elected to formula feed. Informed consent was obtained from one or both parents 24 to 96 hours after birth and before the infant’s participation. This research protocol observed the tenets of the Declaration of Helsinki and was approved by the Institutional Review Boards of the University of Texas Southwestern Medical Center (Dallas, TX), Presbyterian Medical Center (Dallas, TX), and Medical City Columbia Hospital (Dallas, TX).
RANDOMIZATION
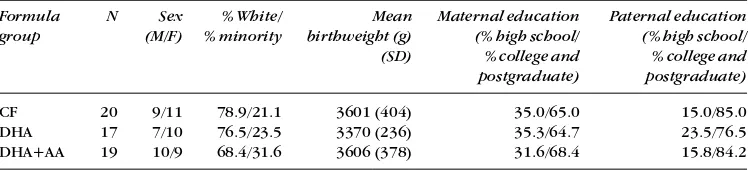
Infants were randomized on the day of enrollment (range, 0 to 4 days; mean 2.1; SD 1.0 ) to one of three diets, described in the paragraph below. Families were recruited from two separate hospitals to encourage ethnic and socioeconomic diversity in the cohort; infants recruited from both hospitals were randomized using a single randomization schedule at a central location. Demographics of the cohort have been pub-lished previously and demonstrate that the randomization was effective in equalizing the three diet groups (Birch et al. 1998). A brief summary of demographics is provided in Table I, including sex, race, birthweight, and parents’ educational level. Each of the three diets was masked by two color/num-ber codes, for a total of six possible diet assignments for each infant. A blocked randomization schedule was developed by the Mead Johnson Research Center (Evansville, IN) and pro-vided in sealed envelopes to the study site.
DIETS
Study diets were Enfamil®with iron, Enfamil®with iron
sup-plemented with 0.35% DHA (of total fatty acids), or Enfamil®
with iron supplemented with 0.36% DHA and 0.72% arachi-donic acid (AA). A formula which provided both DHA and AA was included in the protocol because there was some evidence
in preterm infants that dietary DHA supplementation might depress AA levels (Carlson et al. 1993, Uauy et al. 1994) and/or alter growth (Carlson et al. 1993, 1996a). All formulas provided approximately 15% linoleic acid (LA) and 1.5% α-linolenic acid (LNA) (of total fatty acids). DHA-supplemented and DHA+AA-supplemented formulas contained single-cell oils, specifically DHASCO®and ARASCO®(Martek Biosciences, Columbia, MD,
USA). All formulas were provided in 946 mL ready-to-feed cans and contained 14.7 g protein, 37.5 g fat, and 69.0 g carbohy-drate and 2805 JK/L; all nutrients met existing standards for commercial formula and established Infant Formula Act requirements. Assigned diets were fed exclusively until 17 weeks of age. No solid foods were introduced before 17 weeks. Beyond 17 weeks, the infants received commercial formula (not provided by the study). As previously reported, blood-lipid analyses confirmed compliance with the assigned diets (Birch et al. 1998).
GENERAL PROTOCOL
Mental development was assessed using the Bayley Scales at 18 months of age (± 2 weeks) by one of the authors (SG), a child psychologist specializing in psychoeducational test-ing who was masked to the infants’ diets and other test results. As reported previously, these infants also had been assessed at 4 months and 12 months of age for blood fatty-acid composition, sweep visual evoked potential (VEP) acu-ity, and forced-choice preferential looking (FPL) acuity (Birch et al. 1998).
SAMPLE SIZE
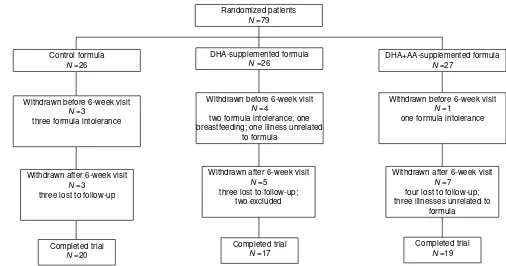
Sample sizes were estimated using the method described by Rosner (1990) for α=0.05 and 1–β=0.80 to detect mean dif-ferences in the MDI of the Bayley Scales of 1SD or greater among diet groups (SD=15). The final sample size required at 18 months is 16 children. Anticipating a 25% loss to follow-up over 18 months, we planned a recruitment of 25 infants for each of the three diet groups and achieved enrollment of 26 to 27 per group. A flow chart for enrollment and follow-up is presented in Figure 1. Most of the infants lost to follow-up dropped out of the study during the initial 6 weeks after enrollment, due to the pediatricians’ recommendations to switch to a soy protein-based formula following symptoms suggestive of lactose or cow-milk protein intolerance (seven infants). Of the 71 infants who remained in the protocol to 6 weeks of age, 58 (82%) completed the protocol until they were 18 months of age. Two children were excluded from the study at the 18-month visit by the psychoeducational consul-tant; one was not included because of a family history of
Table I: Demographics of the cohort
Formula N Sex % White/ Mean Maternal education Paternal education
group (M/F) % minority birthweight (g) (% high school/ (% high school/
(SD) % college and % college and
postgraduate) postgraduate)
CF 20 9/11 78.9/21.1 3601 (404) 35.0/65.0 15.0/85.0
DHA 17 7/10 76.5/23.5 3370 (236) 35.3/64.7 23.5/76.5
DHA+AA 19 10/9 68.4/31.6 3606 (378) 31.6/68.4 15.8/84.2
learning disability in two siblings which was not provided by the parents before the 18-month visit, and the second was not included because she was uncooperative with testing due to a concurrent family crisis. Sample sizes at 18 months were 20 in the control formula group, 17 in the DHA-supple-mented formula group, and 19 in the DHA+AA-supplement-ed formula group.
BAYLEY SCALES OF DEVELOPMENT
The Bayley Scales of Infant Development, 2nd edition (BSID-II) (Bayley 1993) were used to assess mental and psy-chomotor development. This test consists of three scales. The MDI assesses memory, problem solving, discrimination, classification, language, and social skills. The PDI assesses control of gross and fine muscle groups, including walking, running, jumping, prehension, use of writing implements, and imitation of hand movements. Raw scores for the men-tal and psychomotor scales, based on the number of items successfully completed, are converted to the MDI and PDI standard scores based on the child’s age at the time of test-ing. In addition, performance on the mental and motor scales at 18 months can be analyzed by scoring developmen-tal age on three facets of the test (cognitive, language, and motor) to provide a profile of relative strengths and weak-nesses. Mean scores for the MDI and PDI are 100 with a stan-dard deviation of 15. The Behavior Rating Scale (BRS) assesses qualitative aspects of the child’s test-taking behav-ior, including orientation, emotional regulation, and quality of movement. All BRS items are scored appropriate to the child’s age and reported as centile scores; average perfor-mance is at the 50th centile, perforperfor-mance below the 25th centile is classified as questionable, performance below the 10th centile is classified as non-optimal.
SWEEP VEP ACUITY
VEP acuity was assessed according to the swept parameter protocol developed by Norcia and colleagues (Norcia and Tyler 1985, Norcia 1993) using square-wave gratings phase-reversing at 6.6 Hz. Details of the protocol have been described previously (Birch et al. 1998). Briefly, two bipolar placements of Ozversus O1and O2were used to record (gain = 10 000 to 20 000, –3dB cut-off at 1 and 100 Hz) the EEG which was adaptively filtered in real time to isolate the VEP (397 Hz sampling rate). Amplitude and phase of the response at the second harmonic of the stimulation frequen-cy was calculated for each channel. Noise was measured by determining the amplitude and phase of the two adjacent non-harmonic frequencies. Grating acuity was estimated with an automated algorithm which examines signal-to-noise ratio and phase coherence and performs a linear regression for the final descending limb of the vector aver-aged function (minimum of three trials; typically five trials) relating VEP second harmonic amplitude (amplitude at the reversal frequency of 13.2 Hz) to spatial frequency. Sweep VEP acuities were expressed in logMAR (log of the minimum angle of resolution, e.g. 20/20 corresponds to a minimum angle of resolution of 1 minute arc and logMAR of 0.0 while 20/200 corresponds to a minimum angle of resolution of 10 minutes arc and logMAR of 1.0).
FPL ACUITY
Behavioral acuity was estimated using a binocular two-alter-native forced-choice preferential looking protocol (Birch and Hale 1988). Details of the protocol have been described pre-viously (Birch et al. 1998). Briefly, all test sessions began with a low spatial frequency (0.4 cycles/deg), with approximate 0.5 octave steps between successive stimuli. A two-down one-up
Figure 1:Flow chart for enrollment in and progress through the randomized trial.
Randomized patients N =79
DHA+AA-supplemented formula N =27
Control formula N =26
DHA-supplemented formula N =26
Withdrawn before 6-week visit N =4
two formula intolerance; one breastfeeding; one illness unrelated
to formula
Withdrawn before 6-week visit N =1
one formula intolerance Withdrawn before 6-week visit
N =3
three formula intolerance
Withdrawn after 6-week visit N =3
three lost to follow-up
Withdrawn after 6-week visit N =7
four lost to follow-up; three illnesses unrelated to
formula Withdrawn after 6-week visit
N =5 three lost to follow-up;
two excluded
Completed trial N =20
Completed trial N =19 Completed trial
staircase procedure was used to converge on the acuity threshold in 10 reversals and acuity was estimated by maxi-mum likelihood estimation (Swanson and Birch 1992). FPL acuities were expressed in logMAR.
GROWTH
Weight was measured using a Healthometer pediatric strain gauge scale (Healthometer, Bridgeview, IL, USA) accurate to 1 g. Length was measured using Ellard Length Boards (Ellard Instrumentation Ltd., Seattle, Washington, USA) accurate to 0.1 cm. Growth data were normalized by expressing them as zscores for term infants of the appropriate age and sex using the nutritional anthropometry software available at the National Center for Health Statistics (NCHS) website (www.cdc.gov/nchs).
BLOOD LIPIDS
Blood samples (2.0 mL) were collected in ethylene diamine tetraacetic acid (EDTA) microtainer tubes at 4 and 12 months of age via heel stick, aided by infant heel warming packs. Plasma and RBCs were separated by centrifugation, lipids extracted, transmethylated with boron trifluoride/ methanol, and methylesters analyzed by capillary gas chromatography using flame ionization detection. Results were obtained as mass concentration (µg/mL of packed RBCs) based on the addition of an internal standard (10µg 23:0 fatty acid). Fatty-acid peaks were identified by comparison to GLC68+11 stan-dard and using custom software which semiautomated data processing (Hoffman and Uauy 1992).
STATISTICAL ANALYSES
Comparisons among diet groups for MDI and BRS scores were conducted via parametric one-way ANOVA; multiple comparisons among groups were conducted using the Bonferroni method (Rosner 1990). As PDI scores were not normally distributed, comparisons among diet groups were conducted via one-way ANOVA of ranks; multiple compar-isons among groups were made using Dunn’s method (Rosner 1990). As developmental-age scores on the cogni-tive, language, and motor facets represent ordinal data, comparisons among diet groups were conducted via one-way ANOVA of ranks; multiple comparisons among groups were made using Dunn’s method. Correlations between Bayley Scales scores and blood lipids, visual acuities, and growth were calculated by Pearson product-moment cor-relations (r) if both variables passed normality tests (Kolmogorov–Smirnov) or by Spearman rank correlations (rs) if one or both variables failed normality tests.
Results
MENTAL DEVELOPMENT INDEX(MDI)
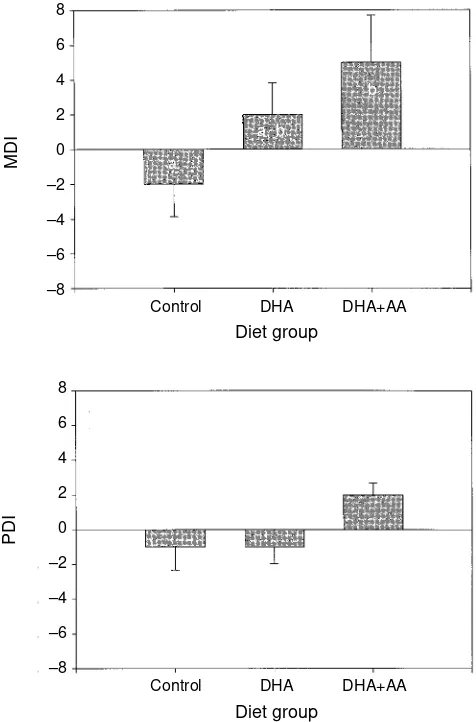
The average MDI score for each diet group relative to the normative score of 100 is presented in Figure 2a and Table II. Long-chain polyunsaturated fatty acids (LCP) dietary supply during the first 4 months of life had a significant effect on MDI scores at 18 months of age (F2,53=3.18, P<0.05). Pairwise multiple comparisons showed that the DHA+AA diet group had significantly higher MDI scores than the con-trol formula group (t=2.51, P<0.05). Only one infant in the control formula group and one infant in the DHA diet group showed accelerated performance on the MDI, i.e. had a score ≥115. Accelerated performance on the MDI was noted in five
infants in the DHA+AA diet group. Two of the infants in the control formula group showed delayed performance on the MDI, i.e. had a score ≤85. None of the infants in the DHA or DHA+AA diet groups showed delayed performance.
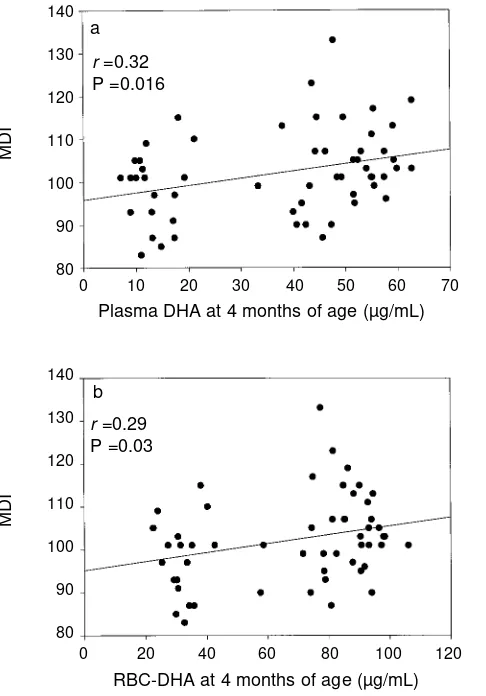
As shown in Figure 3a, the MDI score at 18 months of age was positively correlated with plasma DHA at 4 months of age (r=0.32, P=0.016). There was no significant correlation between plasma LA, LNA, AA, or EPA at 4 months and the MDI score at 18 months of age. As shown in Figure 3b, RBC-DHA at 4 months was positively correlated with the MDI score at 18 months (r=0.29, P=0.030). In addition, the MDI score at 18 months was negatively correlated with both RBC-LA at 4 months (r=–0.30, P=0.023) and RBC-LNA at 4 months of age (r=–0.45, P=0.0004). There was no significant correla-tion between RBC-AA or RBC-EPA at 4 months and the MDI score at 18 months of age. There were no significant correla-tions between plasma or RBC-LA, LNA, AA, EPA, or DHA at 12 months and the MDI score at 18 months of age.
As shown in Figure 4a, MDI score at 18 months was nega-tively correlated with VEP acuity at 4 months of age (r=–0.37,
Figure 2:Means and standard errors of MDI scores and PDI scores relative to the normative score of 100 at 18 months for three randomized diet groups: control, DHA
supplemented, and DHA+AA supplemented. Significant differences between diet groups are indicated by different letter codes (a, b).
Control DHA DHA+AA
Diet group
Control DHA DHA+AA
Diet group
MDI
PDI
8 6 4 2 0 –2 –4 –6 –8
8 6 4 2 0 –2 –4 –6 –8
a
a, b
P=0.008), i.e. better VEP acuity (lower logMAR score) was associated with a better MDI score. There was no significant correlation between MDI score at 18 months and FPL acuity
at 4 months of age (Figure 4b). There was no significant cor-relation between VEP acuity nor FPL acuity at 12 months and the MDI score at 18 months.
Figure 3:Relation between plasma DHA (a) and RBC-DHA (b) at 4 months of age and MDI standard score at 18 months of age. The solid line shows the best fit to the data by linear regression.
Figure 4:Relation between sweep VEP acuity (a) and FPL acuity (b) at 4 months of age and MDI standard score at 18 months of age. The solid line shows the best fit to the data by linear regression.
Table II: Mean and standard errors for the Bayley Scales of Infant Development, 2nd edition
Index Control DHA DHA+AA ANOVA
MDI (mean normative score=100)
Mean (SE) –1.7 (1.94)a 2.4 (1.81)a 5.6 (2.7)b F
2,53=3.18, P<0.05
Median 1.0 3.0 3.0
25th to 75th centile –8.0 to 4.0 –4.0 to 7.0 –1.0 to 14.5 PDI (mean normative score=100)
Mean + SE –1.4 (1.34) –0.6 (0.97) 1.7 (0.69) H2=4.05, P=0.13
Median –1.0 –1.0 2.0
25th to 75th centile –7.0 to 3.0 –5.0 to 3.0 –1.0 to 6.0 BRS (mean normative score=50)
Mean + SE 7.3 (23.7) 6.4 (20.9) 8.1 (24.6) F2,53=1.22, P=0.30
Median 6.0 21.0 21.0
25th to 75th centile –7.0 to 9.5 0.5 to 40.5 –2.0 to 33.0
* Groups with different superscripts (a, b) are significantly different using the Bonferroni method.
r =–0.37 P =0.008
r =–0.02 P =0.87
0.2 0.3 0.4 0.5 0.6 0.7
VEP acuity at 4 months of age (logMAR)
0 10 20 30 40 50 60 70
Plasma DHA at 4 months of age (µg/mL)
140 130 120 110 100 90 80
140 130 120 110 100 90 80
140 130 120 110 100 90 80
140 130 120 110 100 90 80 0 20 40 60 80 100 120
RBC-DHA at 4 months of age (µg/mL) r =0.29
P =0.03 b
MDI
MDI
MDI
MDI
r =0.32 P =0.016
a a
b
0.5 0.6 0.7 0.8 0.9 1.0 1.1 1.2 1.3
The MDI score at 18 months was not correlated with nor-malized height, weight, or weight-for-length zscores at 4 months or 12 months of age.
PSYCHOMOTOR DEVELOPMENT INDEX(PDI)
The average PDI score for each diet group relative to the nor-mative score of 100 is presented in Figure 2b and Table II. LCP dietary supply during the first 4 months of life failed to have a significant effect on PDI scores at 18 months of age (H2=4.05, P=0.13). None of the infants in the control formula group or in the DHA diet group showed accelerated performance on the PDI. Two infants showed accelerated performance on the PDI in the DHA+AA diet group. One infant in the control for-mula group and one infant in the DHA+AA diet group showed delayed performance on the PDI. None of the infants in the DHA diet group showed delayed performance.
PDI score at 18 months of age was not significantly corre-lated with plasma or RBC-LA, LNA, AA, EPA, or DHA at 4 months of age or at 12 months of age.
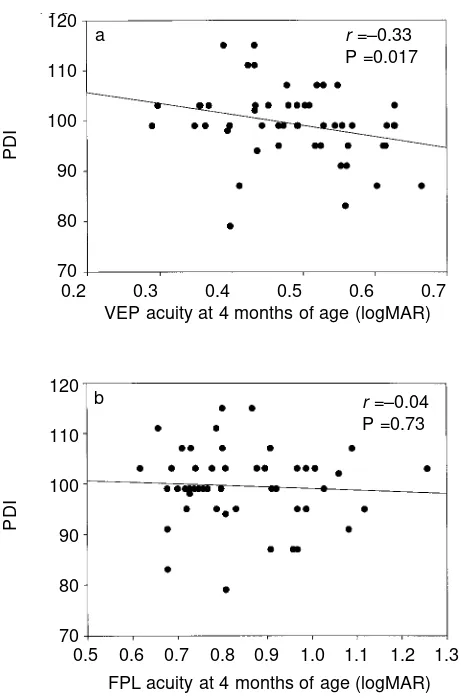
PDI score at 18 months was negatively correlated with VEP acuity at 4 months of age (see Fig. 5a; r=–0.33, P=0.017), i.e. better VEP acuity (lower logMAR score) was associated with a
better PDI score. There was no significant correlation between PDI score at 18 months and FPL acuity at 4 months of age (Fig. 5b). There was no significant correlation between VEP acuity nor FPL acuity at 12 months and PDI score at 18 months.
PDI score at 18 months was not correlated with normal-ized height, weight, or weight-for-length z scores at 4 months. PDI score at 18 months was positively correlated
Figure 5:Relation between sweep VEP acuity (a) and FPL acuity (b) at 4 months of age and PDI standard score at 18 months of age. The solid line shows the best fit to the data by linear regression.
Figure 6:Relation between sweep VEP acuity (a) and FPL acuity (b) at 4 months of age and BRS centile score at 18 months of age. The solid line shows the best fit to the data by linear regression.
Table III: Mean and standard errors for developmental age scores (in months) on the subscales of the Bayley Scales of Infant Development, 2nd edition
Subscale Control DHA DHA+AA
Mean (SE) Mean (SE) Mean (SE)
Cognitive 16.1 (0.32)a 17.6 (0.24)b 17.7 (0.18)b Language 16.0 (0.33)a 16.8 (0.20)a 17.1 (0.19)a Motor 16.0 (0.24)a 17.6 (0.21)b 17.9 (0.16)b
* Groups with different superscripts (a, b) are significantly different using Dunn’s test for multiple comparisons.
r =–0.33 P =0.017 120
110
100
90
80
70
PDI
PDI
120
110
100
90
80
70
0.2 0.3 0.4 0.5 0.6 0.7
VEP acuity at 4 months of age (logMAR)
r =–0.04 P =0.73 a
b
0.5 0.6 0.7 0.8 0.9 1.0 1.1 1.2 1.3
FPL acuity at 4 months of age (logMAR)
r =–0.38 P =0.005
r =0.04 P =0.76 120
100
80
60
40
20
0
BRS
120
100
80
60
40
20
0
BRS
0.5 0.6 0.7 0.8 0.9 1.0 1.1 1.2 1.3
FPL acuity at 4 months of age (logMAR)
0.2 0.3 0.4 0.5 0.6 0.7
VEP acuity at 4 months of age (logMAR) a
with normalized weight-for-length z scores at 12 months (rs=0.325, P=0.020) but not with normalized weight or length zscores at 12 months.
COGNITIVE, LANGUAGE, AND MOTOR SUBSCALES
As shown in Table III, developmental ages on the cognitive subscale were significantly different among diet groups (H2=11.24, P=0.004). On multiple comparison testing (Dunn’s method), the control formula group performed sig-nificantly poorer than both the DHA diet group (Q=2.94, P<0.05) and the DHA+AA diet group (Q=2.84, P<0.05).
No significant differences were found among diet groups for developmental ages on the language subscale (see Table II); the control, DHA, and DHA+AA diet groups performed at the 16.0-, 16.8-, and 17.1-month levels, respectively.
Also shown in Table II are the significant differences found among diet groups for developmental ages on the motor sub-scale (H2=15.00, P<0.001). On multiple comparison testing (Dunn’s method), the control formula group performed sig-nificantly poorer than both the DHA diet group (Q=3.64, P<0.05) and the DHA+AA diet group (Q=2.93, P<0.05).
BEHAVIORAL RATING SCALE(BRS)
As shown in Table II, BRS scores did not differ significantly among diet groups (F2,53=1.22, P=0.30). Three infants in the control formula group, two infants in the DHA diet group, and five infants in the DHA+AA diet group performed above the 90th centile. None of the infants scored in the low-est 10th centile.
There were no significant correlations between BRS scores at 18 months and plasma or RBC-LA, LNA, AA, EPA, or DHA at 4 or 12 months of age.
As shown in Figure 6a, the BRS score at 18 months was negatively correlated with VEP acuity at 4 months of age (r=–0.4, P=0.015); i.e. better VEP acuity (lower logMAR score) was associated with a better BRS score. There was no significant correlation between BRS score at 18 months and FPL acuity at 4 months of age (Fig. 6b). There were no signifi-cant correlations between VEP acuity nor FPL acuity at 12 months and BRS score at 18 months.
BRS score at 18 months was not correlated with normalized height, weight, or weight-for-length zscores at 4 months. BRS score at 18 months was positively correlated with normalized weight-for-length zscores at 12 months (r=0.375, P=0.008) but not with normalized weight or length zscores at 12 months. Discussion
Supplementation of term infant formula milk with 0.36% DHA and 0.72% AA during the first 4 months of life was associ-ated with a mean increase of 7 points on the Mental Development Index of the Bayley Scales at 18 months of age over the control formula group. Power calculations for this trial were initially based on the sample size necessary to detect a 15-point difference (1SD) in the MDI and PDI scores between groups. However, our sample sizes at 18 months exceeded 15-per-diet group and the standard deviations of measurement were smaller than anticipated (MDI SD ranged from 8 to 11 and PDI interquartile intervals ranged from 7 to 10). The smaller than expected standard deviations may have resulted from the more restrictive inclusion and exclusion criteria for ‘normal’ term infants used in the present study versus the Bayley normative sample (see Method section), the
segregation of infants by early diet (unlike the Bayley norms), the use of a single examiner for all Bayley tests (unlike the Bayley norms), or other unknown factors. Due to the smaller than expected standard deviations, we were able to detect smaller differences between groups than anticipated. It should be noted that, while a 7-point increase in the MDI is a small shift for an individual child relative to the standard devi-ation of the normative sample, 7 points represents a signifi-cant shift in the mean performance of a cohort of children.
In addition to a higher MDI score in the DHA+AA-supple-mented group, there was a trend toward higher prevalence of accelerated performance on the MDI in the DHA+AA-sup-plemented group. Supplementation of milk-based term infant formula with 0.36% DHA alone was associated with a mean increase of 4 points on the MDI. Both the cognitive and motor subscales of the MDI showed a significant develop-mental age advantage for DHA and DHA+AA-supplemented groups over the control group. While a similar trend was found for the language subscale, it did not reach statistical significance. These data support a long-term cognitive advantage of infant dietary DHA supply during the first 4 months of life. The significant correlations between plasma and RBC-DHA at 4 months of age but not at 12 months of age and MDI at 18 months of age support the hypothesis that early dietary supply of DHA was a significant determinant of improved performance on the MDI.
The significant correlation between sweep VEP acuity at 4 months of age and the MDI score at 18 months of age pro-vides support for the use of sweep VEP acuity as a valid out-come measure for brain development during infancy in clinical trials of infant nutrition. FPL acuity at 4 months, on the other hand, failed to show a significant correlation with MDI scores at 18 months. This could suggest that FPL acuity is a poor predictor of later mental development or, alternate-ly, it may be that the higher variability associated with FPL as compared with sweep VEP acuity measurements limited our ability to detect a correlation with the current sample sizes.
Neither the PDI nor the BRS showed significant differ-ences among diet groups, consistent with a specific advan-tage of DHA supplementation on mental development. Both scores were correlated, however, with sweep VEP acuity. As in earlier studies of dietary DHA supply in preterm infants (Carlson 1990, 1993), the PDI was correlated with growth at 12 months of age as assessed by weight:length ratio zscores. A recent multicenter study of DHA supplementation of infant formula by Scott et al. (1998) reported no effect of pro-viding dietary DHA during the first year of life on the MDI scores at 12 months of age. There are several differences between the study by Scott and coworkers and the present study that may have led to the different outcome. These include the lower level of DHA provided to infants in the Scott study (0.1% to 0.2% of total fatty acids versus 0.36% in the pre-sent study), different exclusion and inclusion criteria, differ-ent age at testing (12 months versus 18 months in the presdiffer-ent study), the use of multiple examiners in the multicenter study by Scott et al. (which may increase variability), and the use of different versions of the Bayley tests (the newer BSID-II has more emphasis on cognitive tasks than the original version).
development. Our cohort contained only a few children with delayed or accelerated performance but most children were within normal limits (48 of 56). Thus, the predictive value for school-age performance may be limited. A reevaluation of the cohort at 4 years of age, using the Wechsler Preschool and Primary Scales of Intelligence – Revised (WPPSI-R) (Wechsler 1989), is currently underway to address the permanence of differences in cognitive function among the three diet groups.
Accepted for publication 22nd September 1999.
Acknowledgements
This project was supported by NIH grant HD22380 and supplementary funding was provided by the Mead Johnson Nutritional Center (Evansville, IN). Milk-based infant formulas were generously provided by the Mead Johnson Nutritional Center (Evansville, IN). Important contributions in the conduct of this study were made by Yolanda Castañeda, BSN; Dianna Wheaton, BS; Mark Bane, PhD; Stephen Nusinowitz, PhD; Solange Salomao, PhD; Debbie Cornelius, BA; and Jana Birenbaum, BS. We are grateful for the collaboration of the staff of the Margot Perot Women’s and Children’s Hospital newborn nursery and postpartum care at Presbyterian Medical Center (Dallas, TX) and of the staff of the newborn nursery and postpartum care at Columbia Hospital Medical City (Dallas, TX). We appreciate the continuing pediatric support of Pediatric Associates, Kaiser Permanente Pediatrics, Woodhill Pediatric Associates, Clinical Associates, North Dallas Pediatrics, and Debra Burns, MD.
References
Agostini C, Trojan S, Bellu R, Riva E, Giovannini M. (1995) Neurodevelopmental quotient of healthy term infants and feeding practice: the role of long-chain polyunsaturated fatty acids. Pediatric Research38:262–6.
Auestad N, Montalto M, Hall R, Fitzgerald K, Wheeler R, Connor W, Neuringer M, Connor S, Taylor J, Hartmann E. (1997) Visual acuity, erythrocyte fatty acid composition, and growth in term infants fed formulas with long chain polyunsaturated fatty acids for one year. Pediatric Research41: 1–10.
Bayley N. (1993) Bayley Scales of Infant Development, 2nd edn. San Antonio, TX: Psychological Corporation.
Beijers RJW. (1992) Breastfeeding and intelligence. Lancet 339:879. (Letter.)
Birch E. (1989) Visual acuity testing in infants and young children. Ophthalmology Clinics of North America2:369–89.
— Hale L. (1988) Criteria for monocular acuity deficit in infancy and early childhood. Investigative Ophthalmology and Visual Science29:636–43.
— Birch D, Hoffman D, Uauy R. (1992) Dietary essential fatty acid supply and visual development. Investigative Ophthalmology and Visual Science33:3242–53.
— Hoffman D, Uauy R, Birch D, Prestidge C. (1998) Visual acuity and the essentiality of docosahexaenoic acid and arachidonic acid in the diet of term infants. Pediatric Research44:201–9. Bouchard TJ, Lykken DT. (1990) Sources of human psychological
differences: the Minnesota study of twins reared apart. Science 250:223–8.
Carlson SE. (1990) Growth and development of premature infants in relation to w3 and w6 fatty acid status. World Review of Nutrition and Diet75:63–9.
— (1993) Lipid requirements of very low birth weight infants for optimal growth and development. In: Dobbing J, editor. Lipids, Learning, and the Brain: Fats in Infant Formulas.Columbus, OH: Ross Laboratories. p 188–207.
— Werkman SH. (1996) A randomized trial of visual attention of preterm infants fed docosahexaenoic acid until two months. Lipids31:85–90.
— —Peeples J. (1993) Arachidonic acid status correlates with first year growth in preterm infants. Proceedings of the National Academy of Sciences USA90:1073–7.
— —Tolley E. (1996a) Effect of long chain n-3 fatty acid
supplementation on visual acuity and growth of preterm infants with and without bronchopulmonary dysplasia. American Journal of Clinical Nutrition63:687–97.
— Ford A, Werkman S, Peeples J, Koo W. (1996b) Visual acuity and fatty acid status of term infants fed human milk and formulas with and without docosahexaenoate and arachidonate from egg yolk lecithin. Pediatric Research39:882–8.
Crawford MA, Costelow K, Laurance B, Leaf A, Leighfield MJ. (1992) Breastfeeding and intelligence. Lancet339: 614. (Letter.) Damli A, von Schenck U, Clausen U, Koletzko B. (1996) Effects of
long-chain polyunsaturated fatty acids on early visual and mental development of preterm infants. In: Carlson S, Koletzko B, Gibson R, editors. Infant Nutrition: Consensus and Controversies. Champaign, IL: American Oil Chemists’ Society. p 14. Dobbing J. (1992) Breastfeeding and intelligence. Lancet
339:879. (Letter.)
Doyle LW, Rickards AL, Kelly EA, Ford GW, Callanan C. (1992) Breastfeeding and intelligence. Lancet339: 745. (Letter.) Hoefer A, Hardy MC. (1929) Later development of breast fed and
artificially fed infants. Journal of the American Medical Association92:615–9.
Hoffman DR, Uauy R. (1992) Essentiality of dietary omega-3 fatty acids for premature infants: plasma and red blood cell fatty acid composition. Lipids27:886–95.
Houghton AM. (1992) Breastfeeding and intelligence. Lancet 339:613. (Letter.)
Jacobson SW, Jacobson JL. (1992) Breastfeeding and intelligence. Lancet339:879. (Letter.)
James PF. (1992) Breastfeeding and intelligence. Lancet 339:614. (Letter.)
Janowsky JS, Scott DT, Wheeler RE, Auestad N. (1995) Fatty acids affect early language development. Pediatric Research37:310. (Abstract.)
Lucas A, Cole TJ. (1992) Breastfeeding and intelligence. Lancet 339:613. (Letter.)
— Morley R, Cole TJ, Lister G, Leeson-Payne C. (1992) Breast milk and subsequent intelligence quotient in children born preterm. Lancet339:261–4.
MacArthur C, Knox EG, Simons KJ. (1992) Breastfeeding and intelligence. Lancet339:613. (Letter.)
Norcia AM. (1993) Improving infant evoked response measurement. In: Simons K, editor. Early Visual Development, Normal and Abnormal. New York: Oxford University Press. p 536–52. — Tyler CW. (1985) Spatial frequency sweep VEP: visual acuity
during the first year of life. Vision Research25:1399–408. Pollock JI. (1989) Mother’s choice to provide breast milk and
developmental outcome. Archives of Diseases of Childhood 64:763–4.
Rice RD. (1992) Breastfeeding and intelligence. Lancet339:613–4. (Letter.)
Rogerson BFC, Rogerson CH. (1939) Feeding in infancy and subsequent psychological difficulties. Journal of Mental Science 85:1163–82.
Rosner B. (1990) Fundamentals of Biostatistics.Boston, MA: PWS-Kent Publishing.
Scott DT, Janowsky JS, Carroll RE, Taylor JA, Auestad N, Monalto MB. (1998) Formula supplementation with long-chain
polyunsaturated fatty acids: are there developmental benefits? Pediatrics102:59. (Electronic publication.)
Swanson W, Birch E. (1992) Extracting thresholds from noisy data. Perception and Psychophysics51: 409–22
Uauy R, Hoffman D, Birch E, Birch D, Jameson D, Tyson J. (1994) Safety and efficacy of omega-3 fatty acids in the nutrition of very low birth weight infants: soy oil and marine oil supplementation of formula. Journal of Pediatrics124:612–20.
Wechsler D. (1989) Wechsler Preschool and Primary Scales of Intelligence – Revised (WPPSI-R).San Antonio, TX: The Psychological Corporation, Harcourt Brace Jovanovich. Willats P, Forsyth JS, DiModugno M. (1998) Improved means-end
problem solving at 10 months by infants fed a formula
supplemented by long-chain polyunsaturated fatty acids. Lancet 352:688–91.