NONNEGATIVE LEAST SQUARE – A NEW LOOK INTO SAGE DATA
Erliang Zeng
Department of Computer Science Center for Computational Science
University of Miami Miami, FL 33146, USA Email: [email protected]
Mitsunori Ogihara Department of Computer Science Center for Computational Science
University of Miami Miami, FL 33146, USA Email: [email protected]
Serial Analysis of Gene Expression (SAGE) is a technology for quantifying gene expression using sequencing of short stretches (tags) of DNA that are produced by reverse transcription and enzymatic restriction. A major issue in SAGE data analysis is ambiguity of tags, i.e., single tags matching multiple genes and single genes matching multiple tags. The ambiguity produces groups of interrelated quantitative constraints among tag counts and gene expression values. We propose to solve the web of relations between tags and genes using nonnegative least square (NNLS) method. In this paper we present a fast algorithm to do this task. The effectiveness of the method is confirmed by examining a published data that involves SAGE and a method called GLGI. The method is then applied to a SAGE data for a human neurodegenerative disease. The experimental results show that more reliable gene expression can be inferred from SAGE tags using our method, suggesting that our method is powerful for exploring gene expression patterns and identifying candidate genes from SAGE data that potentially contribute to the susceptibility of human complex disease.
1. INTRODUCTION
Gene expression profiling is widely used for exploring genome-wide gene activity patterns1–3. Microarrays and Serial Analysis of Gene Expression (SAGE) are two major techniques used for surveying gene expres-sion profile. Microarrays measure gene expresexpres-sion levels by using probe-target hybridization2,3, where a probe is a short stretch of DNA, often derived from the sequence of a gene, and a target is a cDNA sam-ple that is expected to represent the comsam-plete gene activity in a cell. The SAGE, in contrast, obtains gene expression by counting thousands of polyadeny-lated transcripts by sequencing concatemers of short sequence tags (10bp or 17bp long) derived from bio-logical samples4. Both microarrays and SAGE have been used in biological research for many years for measuring the expression of a large number, if not all, of the genes in a given sample. There are some ad-vantages of using SAGE over the other5,6. First, the quantification in SAGE is based on the actual RNA sequences expressed in the sample and thus, unlike
microarrays, one does not need to know beforehand the sequence to be measured. This enables one to discover unknown genes. Second, SAGE is able to detect small changes in expression levels, making it more sensitive comparing to microarray7. Finally, SAGE can detect over- and under-expressed tran-scripts equally well. This means it has less biases than microarray8
.
is carried out by comparing the tags to a database of virtual tags extracted from known transcript se-quences. When single tag matches multiple genes or single gene matches multiple tags, the problem of ambiguity occurs. Most current research only focuses on those tags that can be uniquely mapped to genes and ignores many tags with ambiguous mapping. Al-though this strategy has been standardly used, much information is undoubtedly lost by its stringent re-striction. We in this paper answer how to remove this restriction and make good use of all the tags.
The reference database plays a key role in the Tag-to-Gene assignment step. Because of high degree of redundancies among tran-script sequences, it is difficult to use the se-quences in transcript sequence databases directly for SAGE tag annotation. The UniGene project (http://www.ncbi.nlm.nih.gov/UniGene) is an experimental system for automatically partitioning GenBank transcript sequences (e.g., proteins, well-characterized mRNA/cDNA sequences and ESTs) into a non-redundant set of gene-oriented clusters. Each UniGene cluster fundamentally contains a set of transcript sequences which appear to come from the same transcription locus, and therefore poten-tially represents a unique transcript. The SAGEmap data repository is constructed so as to make a SAGE tag mapped to genes using UniGene clus-ter identifiers 9. The construction process of the tag to UniGene cluster assignments (tag-UniGene assignments) itself is an automated process con-sisting of multiple computational steps. The re-sult of this process is a “full” tag to gene mapping called “SAGEmap full” which includes the whole ex-tracted virtual SAGE tags. Also, “SAGEmap reli-able” is constructed by using SAGE tags extracted from high-quality sequences in “SAGEmap full”. Al-though “SAGEmap reliable” provides more reliable information for SAGE annotation, the scope of tran-scriptomes that “SAGEmap reliable” covers is much less than that of “SAGEmap full.” SAGEmap pro-vides an automatic link between gene names and SAGE transcript levels, accounting for alternative transcriptions and many potential errors. SAGEmap is powerful, but there are additional ways of process-ing and presentprocess-ing this valuable data. SAGE Genie, a set of tools for processing SAGE data, is then de-veloped10. The foremost of these tools is the SAGE
Anatomic Viewer, which allows nearly any gene’s transcript level to be easily viewed in normal and malignant tissues.
All this tremendous amount of development ef-fort notwithstanding, SAGE data is still noisy. The noise in SAGE data largely comes from two sources: sequencing errors and Tag-to-Gene mapping ambi-guity. As to the former, it is conjectured that the unmapped tags could largely result from an accumu-lation of sequencing errors6. Considering that many steps are involved in SAGE tag collection, and in particular the errors introduced by single-pass DNA sequencing, many SAGE tags are expected to con-tain base errors and thus cannot be reliably mapped to their known transcripts. This problem is particu-larly serious for SAGE tags with lower copy numbers. Therefore, it was suggested to eliminate unmapped tags from further analysis. However, we argue that even for tags that are mapped to genes, sequenc-ing errors still exist. This issue unfortunately has not received much attention6
. As to the latter, the problem is that some genes mapped to a tag may not be the true gene origins for that tag because the length of SAGE tags is limited and transcript sequences that appear in SAGE reference databases are highly heterogeneous.
Attempts have been made to resolve these is-sues. “Long SAGE” attempts to reduce the noise caused by redundancies by extending the capability of original SAGE by sequencing extra 7 base pairs, which allows a high percentage of long SAGE tags to be mapped directly to genomic sequence data11–13. Other attempts using computational and experimen-tal approaches have been made for solving this prob-lem14–16
. Geet al. used microarray expression data from different tissue types to define contexts of gene expression and to predict the original transcript con-tributing a ambiguous tag14. Chenet al. identified the correct genes for SAGE tags by extending the SAGE tags into 3′ complementary DNAs (cDNAs)
using of the GLGI technique (generation of longer cDNA fragments from SAGE tags for gene identifi-cation) 15
. Griffitha et al. performed global coex-pression analysis by assessing and integrating pub-licly available SAGE, cDNA microarray, and oligonu-cleotide microarray expression data16
.
data. Our goal is to predict gene expression lev-els from tag counts using Tag-to-Gene assignments information as much as possible and address noise problems in the meantime. This is obtained using the information of interrelated quantitative constraints among tag counts and gene expression values.
2. METHODS
In this section, we first introduce the basic concepts behind our NNLS method and its link to SAGE data analysis. Then, we present an improved algorithm to solve the NNLS problem.
2.1. NNLS problem and its link to
SAGE data analysis
The NNLS problem refers to the problem of finding, given ann×mnonnegative matrixA= (aij) and a nonnegativen-dimensional vectorb= (bi), a nonneg-ativem-dimensional vectorx= (xi) that minimizes the functionalf(x) = 1
2kAx−bk 2,i.e.,
min x f(x) =
1
2kAx−bk 2
= 1 2
n X
i=1
(ai1x1+· · ·+aimxm−bi)2,
subject tox≥0.
The problem of estimating gene expression levels from the tag counts of SAGE data can be formu-lated as a NNLS problem. Suppose there arentags that appear in the data and there arem genes that at least one of the tags matches. Let Abe a binary (i.e., 0/1)n×mmatrix so that for all rowsiand for all columns j the (i, j) entry of the matrix,aij, is 1 if and only if the i-th tag mapped to the j-th gene, and 0 otherwise. Letb be ann-dimensional positive vector such that for all i the i-th entry of b, bi, is the count of tag i in the SAGE data. Letx be the m-dimensional vector of unknowns such that for all j the j-th entry of x, xj, represents the expression of the j-th gene. Our problem is then to estimate vectorxin terms of the NNLS problem.
Then×mnonnegative matrixAcan be viewed as the connectivity matrix of the bipartite graph G overntags andmgenes, where tagiand genejare connected by an edge if tag i matches gene j. Nor-mally,Ais of high dimension with over ten thousand tags and genes. This makes the computation of a
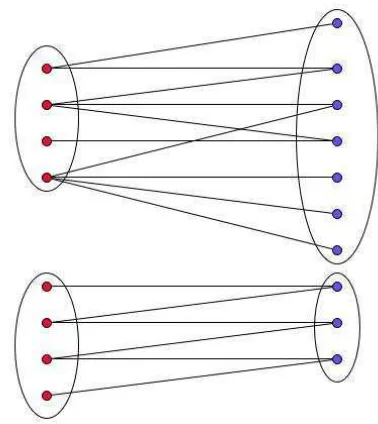
solution to the NNLS problem very time-consuming. One way to reduce the dimensionality is to divide the bipartite graph G into connected components and then solve the NNLS problem on each individual con-nected components represented, since solutions for a connected component do not interfere with those for another component. As illustrated in Figure 1, the original matrix A is a 8×10 matrix. After graph partition, matrixA is divide into two matrices with dimensionality 4×7 and 4×3, respectively.
Fig. 1. An example showing the bipartite graph over a set of tags and a set of genes. The vertices on the left-hand side represent a set of tags and the vertices on the right-hand side represent a set of genes.
2.2. Algorithm for solving NNLS
problem
The standard method (also known as the first method) for solving NNLS is proposed by Lawson
et al. 17
. The method uses an iterative procedure that repeatedly identifies the dimension along which the gradient ofkAx−bk2is the smallest. This greedy method is fast but does not necessary produce close-to-optimal solutions. To overcome this issue the Project Gradient Method is devised18, where instead of a single dimension, a projection along which the gradient is the smallest. A variant of this approach has been recently proposed19, where the amount of changes along the projected dimension exhibits be-havior similar to the Newton method. The full im-plementation of this unfortunately requires the use of non-sparsem×mscaling matrix that is updated at every iteration. Sincemis in the order of tens of thousands in our case, the full-fledged version of the algorithm is impractical. We thus modify the algo-rithm so that a fixed scaling matrix (e.g., the identity scaling) is used.
In the following for an n-dimensional vector x,
∇f(x) denotes them-dimensional vectorA(Ax−b) and P(x) denotes the vector constructed from xby setting all negative entries to 0. We set the initial value of x to the n-dimensional 0-vector. Then re-peat the following loop until a forced convergence condition is reached (the improvement inkAx−bk2 is smaller than a pre-determined threshold).
(1) Set I to the set of all indices between 1 andn such that the i-th entry of x is 0 and the i-th entry of∇f(x) is positive. SetJ to the set of all indices between 1 andnthat are not inI. (2) Decomposexasy+z, wherey is thexwith all
the entries at positions inIset to 0 andzis the xwith all the entries at positions inJ set to 0. (3) Repeat Compute two quantitiesαandβ:
(a) Set ¯A to the matrix constructed from A by setting 0 all the columns and rows whose in-dices are inI. For ann-dimensional vectoru, letg(u) = 1
2kAu¯ −bk 2.
(b) Compute the smallest nonnegative integerµ that satisfies
The virtual SAGE tags with assigned UniGene clus-ters were downloaded from the SAGEmap database (ftp://ftp.ncbi.nlm.nih.gov/pub/sage/mappin-gs). The NNLS method was performed on two sets of data: the human CD34+ hematopoietic cell SAGE library (http://www.ncbi.nlm.nih.gov/projects/ geo/query/acc.cgi?acc=GSE2346) 20
and the SAGE libraries of hippocampus samples in Alzheimer’s disease (http://www.ncbi.nlm.nih.gov /projects/geo/query/acc.cgi?acc=GSM154136) 21. For each SAGE library, a bipartite graph was
generated using the experimental tags of the li-brary and the Tag-to-Gene assignment indicated by “SAGEmap full”.
3.2. Algorithm performance
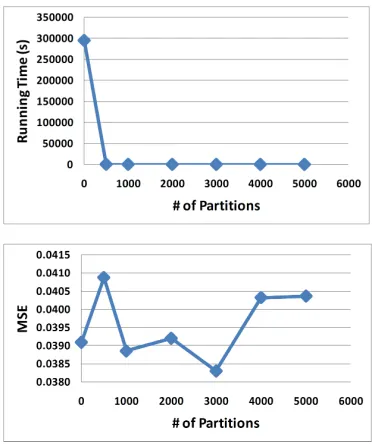
graph partition packages 22 for the aforementioned large connected component. The algorithm perfor-mance is measured by the mean squared error (MSE) of the tag counts. As shown in Figure 2, the algo-rithm performance does not change much when the number of partitions increases (bottom panel), while the running time is dramatically reduced when the number of partitions is 500 and above (top panel). This suggests that, whenever necessary, it is suitable to execute partition before employing NNLS calcu-lation.
Fig. 2. NNLS performance on graph decomposition.
3.3. Evaluation using SAGE data of
hematopoietic cells
3.3.1.
Evaluation of NNLS method
The accuracy of NNLS method was evaluated us-ing SAGE data from CD34+ hematopoietic cells. Zhou et al. analyzed the pattern of gene expres-sion in human primary CD34+ stem/progenitor cells using SAGE approach 20. Among 21,546 tags that matched known expressed sequences, 34% matched more than one UniGenes. Zhou et al. employed a method called GLGI to convert the tags that have multiple matching genes into 3′-ESTs and then used
these longer sequences to search in databases their corresponding genes15. This is a wet-lab strategy to annotate tags that have multiple gene matches.
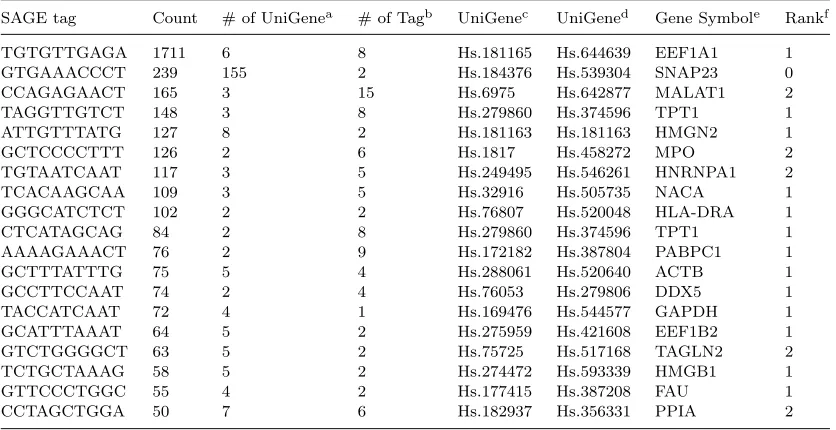
We employed our NNLS method on CD34+ SAGE data and compared the results against the results published in the paper by Zhouet al.20. Be-cause the SAGE tags with multiple matches tend to be the ones with more copies, we compared the re-sults for tags with more than 50 copies that have multiple matches. There are 98 tags fall into this category. After the GLGI annotation, many tags in this category are found to come from housekeeping genes and from genes with unknown functions, in-cluding 40 ribosomal proteins, 2 hypothetical genes, and 23 ESTs. We focused on comparing our results with those genes that have specific functions, which consist of 19 tags as shown in Table 1. For each tag, the UniGenes it matches are ranked in the de-creased order of their estimated gene expression val-ues, and are then compared against the annotation by the GLGI method. The top annotations of thir-teen tags by the NNLS method are confirmed by the GLGI method. When the top two UniGene clusters are included, five more annotations are confirmed, which represent 95% total of the tags that are com-pared (Table 1).
3.3.2.
Annotations of function unknown
tags
Note that all the tags in Table 1 have more than one matching UniGene clusters. Each of those Uni-Gene clusters in turn has multiple matching tags, thus form a complicated tag-gene network. Table 1 shows that the top UniGene cluster assigned to each ambiguous tag is likely to be the true gene origin. Considering that there are many tags mapped to ESTs without known function when the work of Zhou
Table 1. Evaluation of the NNLS method.
SAGE tag Count # of UniGenea
# of Tagb
UniGenec
UniGened
Gene Symbole
Rankf
TGTGTTGAGA 1711 6 8 Hs.181165 Hs.644639 EEF1A1 1 GTGAAACCCT 239 155 2 Hs.184376 Hs.539304 SNAP23 0 CCAGAGAACT 165 3 15 Hs.6975 Hs.642877 MALAT1 2 TAGGTTGTCT 148 3 8 Hs.279860 Hs.374596 TPT1 1 ATTGTTTATG 127 8 2 Hs.181163 Hs.181163 HMGN2 1
GCTCCCCTTT 126 2 6 Hs.1817 Hs.458272 MPO 2
TGTAATCAAT 117 3 5 Hs.249495 Hs.546261 HNRNPA1 2
TCACAAGCAA 109 3 5 Hs.32916 Hs.505735 NACA 1
GGGCATCTCT 102 2 2 Hs.76807 Hs.520048 HLA-DRA 1
CTCATAGCAG 84 2 8 Hs.279860 Hs.374596 TPT1 1
AAAAGAAACT 76 2 9 Hs.172182 Hs.387804 PABPC1 1
GCTTTATTTG 75 5 4 Hs.288061 Hs.520640 ACTB 1
GCCTTCCAAT 74 2 4 Hs.76053 Hs.279806 DDX5 1
TACCATCAAT 72 4 1 Hs.169476 Hs.544577 GAPDH 1 GCATTTAAAT 64 5 2 Hs.275959 Hs.421608 EEF1B2 1 GTCTGGGGCT 63 5 2 Hs.75725 Hs.517168 TAGLN2 2 TCTGCTAAAG 58 5 2 Hs.274472 Hs.593339 HMGB1 1
GTTCCCTGGC 55 4 2 Hs.177415 Hs.387208 FAU 1
CCTAGCTGGA 50 7 6 Hs.182937 Hs.356331 PPIA 2
a
Number of UniGenes matching SAGE tag in column 1.
b
Number of SAGE tags matching UniGene as shown in column 7.
c
UniGene ID in the paper of Zhouet al.20verified by GLGI method.
d
UniGene ID extracted from SAGEmap build #218 and ranked as top candidate by NNLS method.
e
Gene Symbol corresponding to UniGene as shown in column 5 or column 6. Because the UniGene database is updated constantly, although the identifiers in column 5 and column 6 are different, they refer to as the same gene symbol.
f
The rank of gene as shown in column 7. The ranking is obtained based on the decreased order of gene expression values estimated by NNLS method for all the UniGenes the corresponding tag matches. 0: the gene has no ranking; 1: the gene ranked top 1; 2: the gene ranked second.
3.4. Results of SAGE data of human
brain samples
The results in Section 3.3.2 demonstrate the effec-tiveness of NNLS method for SAGE data analy-sis. The NNLS method was then applied to another SAGE library — SAGE library of human Alzheimer’s disease.
AP OE4 allele is a major risk factor for late-onset Alzheimer’s disease (AD). However, the mechanism of action of AP OE in AD remains unclear. Xu et al. studied the effects of APOE alleles on gene ex-pression in AD by analyzing SAGE data obtained from human hippocampus samples with AD patients with AP OE3/3, AP OE3/4, and AP OE4/4 alleles and samples from a control21
. We re-analyzed this SAGE data set using our NNLS method with the goal of finding new genes that contribute to the sus-ceptibility of Alzheimer’s disease.
3.5. Differentially expressed genes in
AD
Xu et al. used Chi-square Test and Fisher’s Exact Test to examine the difference in tag counts between two samples 21
. We performed the same statisti-cal analysis but on the expression values obtained from NNLS method. Table 3 summarizes the re-sults from the comparison of two studies. Xuet al.
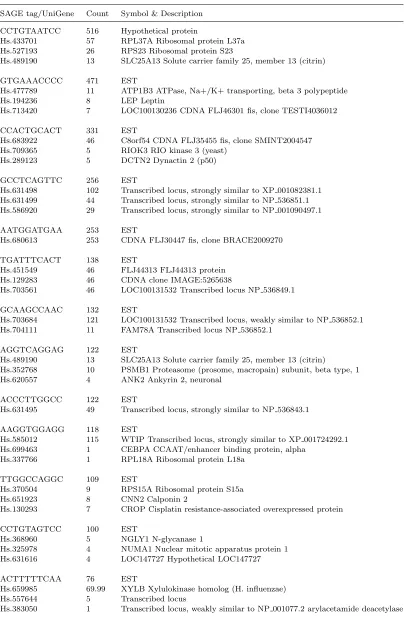
Table 2. Annotations for tags with unknown function.
SAGE tag/UniGene Count Symbol & Description CCTGTAATCC 516 Hypothetical protein
Hs.433701 57 RPL37A Ribosomal protein L37a Hs.527193 26 RPS23 Ribosomal protein S23
Hs.489190 13 SLC25A13 Solute carrier family 25, member 13 (citrin)
GTGAAACCCC 471 EST
Hs.477789 11 ATP1B3 ATPase, Na+/K+ transporting, beta 3 polypeptide Hs.194236 8 LEP Leptin
Hs.713420 7 LOC100130236 CDNA FLJ46301 fis, clone TESTI4036012
CCACTGCACT 331 EST
Hs.683922 46 C8orf54 CDNA FLJ35455 fis, clone SMINT2004547 Hs.709365 5 RIOK3 RIO kinase 3 (yeast)
Hs.289123 5 DCTN2 Dynactin 2 (p50)
GCCTCAGTTC 256 EST
Hs.631498 102 Transcribed locus, strongly similar to XP 001082381.1 Hs.631499 44 Transcribed locus, strongly similar to NP 536851.1 Hs.586920 29 Transcribed locus, strongly similar to NP 001090497.1
AATGGATGAA 253 EST
Hs.680613 253 CDNA FLJ30447 fis, clone BRACE2009270
TGATTTCACT 138 EST
Hs.451549 46 FLJ44313 FLJ44313 protein Hs.129283 46 CDNA clone IMAGE:5265638
Hs.703561 46 LOC100131532 Transcribed locus NP 536849.1
GCAAGCCAAC 132 EST
Hs.703684 121 LOC100131532 Transcribed locus, weakly similar to NP 536852.1 Hs.704111 11 FAM78A Transcribed locus NP 536852.1
AGGTCAGGAG 122 EST
Hs.489190 13 SLC25A13 Solute carrier family 25, member 13 (citrin)
Hs.352768 10 PSMB1 Proteasome (prosome, macropain) subunit, beta type, 1 Hs.620557 4 ANK2 Ankyrin 2, neuronal
ACCCTTGGCC 122 EST
Hs.631495 49 Transcribed locus, strongly similar to NP 536843.1
AAGGTGGAGG 118 EST
Hs.585012 115 WTIP Transcribed locus, strongly similar to XP 001724292.1 Hs.699463 1 CEBPA CCAAT/enhancer binding protein, alpha
Hs.337766 1 RPL18A Ribosomal protein L18a
TTGGCCAGGC 109 EST
Hs.370504 9 RPS15A Ribosomal protein S15a Hs.651923 8 CNN2 Calponin 2
Hs.130293 7 CROP Cisplatin resistance-associated overexpressed protein
CCTGTAGTCC 100 EST
Hs.368960 5 NGLY1 N-glycanase 1
Hs.325978 4 NUMA1 Nuclear mitotic apparatus protein 1 Hs.631616 4 LOC147727 Hypothetical LOC147727
ACTTTTTCAA 76 EST
Hs.659985 69.99 XYLB Xylulokinase homolog (H. influenzae) Hs.557644 5 Transcribed locus
Table 3. Comparison of differentially (p <0.05) expressed SAGE tags and UniGenes*
.
SAGE library Sig. tags(%) Sig. UGs Uniq. UGsa Sig. UGs Comm. UGsb Uniq. Comm. UGsc (Up/Down) (Up/Down) (Up/Down,%) (Up/Down) (Up/Down) E33AD vs Ctl 156(0.41) 276(114/162) 100(48/52) 43(21/22,0.38) 24(9/15) 16(3/13) E34AD vs Ctl 906(2.32) 1594(714/880) 523(97/426) 306(115/191,2.86) 189(43/146) 109(11/98) E44AD vs Ctl 625(1.71) 1270(847/423) 320(108/212) 215(98/117,2.10) 88(25/63) 41(3/38) E34AD vs E33AD 918(2.26) 1673(848/825) 499(131/368) 329(144/185,3.08) 189(53/136) 99(16/83) E44AD vs E33AD 771(2.01) 1469(934/535) 428(172/256) 218(120/98,2.12) 94(31/63) 45(9/36) E44AD vs E34AD 476(1.24) 761(533/208) 287(188/99) 114(59/55,1.11) 62(35/27) 34(17/17)
*
Columns 2 to 4 shows results from Xuet al. 21, including significant tags and the percentage of all discovered tags, significant UniGenes that significant tags match, and unique significant UniGenes. Column 5 shows the significant UniGenes and the percentage of all discovered UniGenes obtained by our analysis. Columns 6 and 7 shows the common UniGenes shared by two methods. The numbersX/Y in the parentheses show the breakdown between the up-regulated and down-regulated tags.
a
TheUniqueU niGenerefers to the one used in the paper of Xuet al.21
,i.e., the tags that map to only one UniGene cluster.
b
These are the UniGenes shared by Column 4 and Column 5.
c
TheUnique U niGenerefers to a UniGene all of whose tags match the UniGene only.
Table 4. Significant genes uniquely identified by NNLS method known to be susceptibility candidates to AD
UniGene Symbol SAGE library Expressiona
Hs.551642 ANXA8 E34AD vs Ctl Down Hs.551642 ANXA8 E34AD vs E33AD Down Hs.551642 ANXA8 E44AD vs Ctl Down Hs.551642 ANXA8 E44AD vs E33AD Down Hs.546241 C4A E34AD vs Ctl Up Hs.546241 C4A E34AD vs E33AD Up Hs.546241 C4A E44AD vs E34AD Down Hs.522555 APOD E34AD vs Ctl Up Hs.522555 APOD E34AD vs E33AD Up Hs.391561 FABP4 E44AD vs Ctl Up Hs.391561 FABP4 E44AD vs E34AD Up Hs.414795 SERPINE1 E44AD vs Ctl Up Hs.414795 SERPINE1 E44AD vs E33AD Up Hs.511367 CYP19A1 E34AD vs Ctl Up Hs.514220 GRN E44AD vs Ctl Up Hs.348387 GSTM4 E44AD vs Ctl Down
a
Upmeans “Up-regulated”,Downmeans “Down-regulated”.
Significant differences between the two studies are shown in Table 3. For example, the number of significant UniGenes from our analysis is much smaller than those discovered by Xuet al.21. Xuet
al. asserted that a UniGene is unique if there is at least one significantly expressed tag that matches the gene and there are no other UniGenes that match such a tag. A drawback of this definition is that it does not take into account all the expressed tags that match the gene and thus may be prone to errors. In our analysis, we can avoid the use of this concept of uniqueness since the expressions of the tags and of the genes are estimated by taking into account
matching relations among them. Because of this our results may be more reliable than those by Xuet al.. The same argument can be made from the results in Table 4, which shows the genes that are found to be candidates for susceptibility to AD only in our study. This gene set is obtained by comparing our signifi-cant genes to the genes listed in AlzGene database (http://www.alzforum.org/res/com/gen/alzgene/) for each SAGE library. The AlzGene database pro-vides a comprehensive, unbiased and regularly up-dated collection of genetic association studies per-formed on Alzheimer’s disease phenotypes. Some genes, such asAN XA8 andC4A, appear in multiple SAGE libraries. That seems to suggest their poten-tial important role in the development of Alzheimer’s disease.
The detailed Venn diagrams of the overlaps and differences between our results and Xu’s results are shown in Figure 3. As shown in the figure, the differ-entially expressed genes shared between AP OE3/4 and AP OE4/4 AD patients are much more than those shared betweenAP OE3/4 andAP OE3/3 AD patients, and betweenAP OE4/4 andAP OE3/3 AD patients.
With respect to several gene functional cate-gories, the expression profiles that our analysis iden-tifies are similar to those discovered by Xu et al.
plas-ticity, synaptic vesicle trafficking (metabolism) and axonal/neuronal outgrowth. In addition, reduction of neurotransmitter receptors andCa2+homeostasis, disruption of multiple signal transduction pathways, and loss of cell protection and notably mitochon-drial oxidative phosphorylation/energy metabolism are associated with AP OE3/4 and AP OE4/4 AD alleles.
4. Discussion and Conclusions
SAGE data analysis based on NNLS method have been performed on two sets of data: a human CD34+ hematopoietic cell SAGE library and a human hip-pocampus cell SAGE library. Previous research in this area focused on investigating genes that can be uniquely matched SAGE tags, and thus ignores the tags that have multiple matches. This limits the range of genes for which expression patterns are an-alyzed. To break the barrier, one must accurately estimate the gene expression levels based on all the tags counts. Although it is possible to obtain more reliable annotate SAGE tags using “SAGEmap reli-able” Tag-to-Gene assignments, the analysis scope is largely decreased. Previous study showed that 38.1% of the virtual tags in the “SAGEmap full” contain more than one UniGene cluster, even in “SAGEmap reliable” subdatabase, 12.7% contain more than one UniGene cluster14. Thus there is a pressing need to develop new computational method for SAGE data analysis that fully uses the tag counts and interre-lated quantitative constraints among tags and genes. The research described in this paper addresses the above challenges. To the best of our knowledge, there have been few attempts along our line. Our significant contributions are:
(1) A nonnegative least squares method has been introduced to SAGE data analysis. The expres-sion levels of genes have been estimated from the counts of all tags presented in a cell. This NNLS method has been evaluated with another wetlab SAGE tag annotation method, GLGI.
(2) A new algorithm to solve NNLS problem has been proposed. The new algorithm uses a fixed scaling matrix so as to alleviate compute inten-sity. Also the algorithm uses graph partitioning. (3) The newly proposed NNLS algorithm enables systematic, consistent, and comprehensive
anal-ysis of SAGE data. The strategy has been em-ployed to identify new candidate genes for sus-ceptibility to Alzheimer’s desease.
Fig. 3. Comparison of regulation of gene expression by
AP OE genotype. N(n1, n2) means the number of unique significant genes discovered by Xu et al. isN, the number of significant genes discovered by us is n1, and the number common significant genes shared by two studies isn2. The
di-agram only show the number of genes in each area. (A) Venn diagram of the UniGenes that are discovered in AP OE3/3 AD,AP OE3/4 AD andAP OE4/4 AD samples and are up-regulated from the control. (B) Venn diagram of the Uni-Genes that are discovered inAP OE3/3 AD,AP OE3/4 AD andAP OE4/4 AD samples and are down-regulated from the control.
quantify gene expression and alternative splicing us-ing new sequencus-ing technologies. In spite of rapidly evolving, these new technologies have relatively high error rate comparing to conventional sequencing technology. One challenge in next-generation se-quencing data analysis is to align sequence reads to referance genome. Like SAGE data, the sequence reads and genes have ambiguous mapping. Thus the NNLS method described in this paper provides a potential solution for analyzing next-generation se-quencing data.
References
1. DeRisi, J., Iyer, V., Brown, P.: Exploring the metabolic and genetic control of gene expression on a genomic scale. Science278(5338) (1997) 680–686
2. Zhang, M.: Large-scale gene expression data anal-ysis: a new challenge to computational biologists. Genome Research9(12) (1999) 681–688
3. Spellman, P.T., Sherlock, G., Zhang, M.Q., Iyer, V.R., Anders, K., Eisen, M.B., Brown, P.O., Bot-stein, D., Futcher, B.: Comprehensive identifica-tion of cell cycle-regulated genes of the yeast sac-charomyces cerevisiae by microarray hybridization. Mol Biol Cell9(12) (1998) 3273–3297
4. Velculescu, V.E., Zhang, L., Vogelstein, B., Kinzler, K.W.: Serial analysis of gene expression. Science
270(5235) (October 1995) 484–487
5. Evans, S.J., Datson, N.A., Kabbaj, M., Thompson, R.C., Vreugdenhil, E., Kloet, E.R.D., Watson, S.J., Akil, H.: Evaluation of affymetrix gene chip sensitiv-ity in rat hippocampal tissue using SAGE analysis. European Journal of Neuroscience16(3) (2002) 409–
413
6. van Ruissen Fred, Jan, R., Gerben, S., Lida, A., Danny, Z., Marcel, K., Frank, B.: Evaluation of the similarity of gene expression data estimated with SAGE and Affymetrix GeneChips. BMC Genomics
6(1) (2005) 91
7. Scott, H.S., Chrast, R.: Global transcript expres-sion profiling by serial analysis of gene expresexpres-sion (SAGE). Genetic Engineering: Principles and Meth-ods.23(2001) 210–219
8. Iyer, V., Struhl, K.: Absolute mrna levels and tran-scriptional initiation rates in saccharomyces cere-visiae. Proceedings of the National Academy of Sci-ences of the United States of America93(11) (1996)
5208–5212
9. Lash, A.E., Tolstoshev, C.M., Wagner, L., Schuler, G.D., Strausberg, R.L., Riggins, G.J., Altschul, S.F.: SAGEmap: a public gene expression resource. Genome Res10(2000) 1051–1060
10. Boon, K., Osrio, E.C., Greenhut, S.F., Schaefer, C.F., Shoemaker, J., Polyak, K., Morin, P.J., Bue-tow, K.H., Strausberg, R.L., de Souza, S.J., Riggins,
G.J.: An anatomy of normal and malignant gene expression. Proceedings of the National Academy of Sciences of the United States of America 99(17)
(2002) 11287–11292
11. Li, Y.J., Xu, P., Qin, X., Schmechel, D.E., Hulette, C.M., Haines, J.L., Pericak-Vance, M.A., Gilbert, J.R.: A comparative analysis of the information con-tent in long and short SAGE libraries. BMC Bioin-formatics 7(2006) 504–514
12. Gowda, M., Jantasuriyarat, C., Dean, R.A., Wang, G.L.: Robust-LongSAGE (RL-SAGE): A Substan-tially Improved LongSAGE Method for Gene Dis-covery and Transcriptome Analysis. Plant Physiol.
134(3) (2004) 890–897
13. Hanriot, L., Keime, C., Gay, N., Faure, C., Dos-sat, C., Wincker, P., Scote-Blachon, C., Peyron, C., Gandrillon, O.: A combination of LongSAGE with Solexa sequencing is well suited to explore the depth and the complexity of transcriptome. BMC Genomics 9(1) (2008) 418
14. Ge, X., Wang, S.M.: Identifying nonspecific SAGE tags by context of gene expression. Methods in Molecular Biology 387(2007) 199–204
15. Chen, J., Lee, S., Zhou, G., Wang, S.M.: High-throughput GLGI procedure for converting a large number of serial analysis of gene expression tag se-quences into 3’ complementary DNAs. Molecular and Cellular Neuroscience33(3) (2002) 252–261
16. Griffitha, O.L., Pleasancea, E.D., Fultonb, D.L., Oveisia, M., Esterc, M., Siddiquia, A.S., Jones, S.J.: Assessment and integration of publicly avail-able SAGE, cDNA microarray, and oligonucleotide microarray expression data for global coexpression analyses. Genomics 86(2005) 476–488
17. Lawson, C.L., Hanson., R.J. In: Solving Least Squares Problems, Prentice-Hall (1974)
18. Bierlaire, M., Toint, P.L., Tuyttens., D.: On itera-tive algorithms for linear least squares problems with bound constraints. In: Linear Algebra and Its Ap-plications. Volume 413. (1991) 111–143
19. Kim, D., Sra, S., , Dhillone, I.S.: A new pro-jected quasi-newton approach for the nonnegative least squares problem. In: Technical Report TR-06-54., Department of Computer Science, The Univer-sity of Texas at Austin (2006)
20. Zhou, G., Chen, J., Lee, S., Clark, T., Rowley, J.D., Wang, S.M.: The pattern of gene expression in human CD34+ stem/progenitor cells. Proceedings of the National Academy of Sciences of the United States of America98(24) (2001) 13966–13971
21. Xu, P.T., Li, Y.J., Qin, X.J., Kroner, C., Green-Odlum, A., Xu, H., Wang, T.Y., Schmechel, D.E., Hulette, C.M., Ervin, J., Hauser, M., Haines, J., Pericak-Vance, M.A., Gilbert, J.R.: A SAGE study of apolipoprotein E3/3, E3/4 and E4/4 allele-specific gene expression in hippocampus in Alzheimer dis-ease. Molecular and Cellular Neuroscience 36(3)
22. Abou-Rjeili, A., Karypis, G.: Multilevel algorithms for partitioning power-law graphs. Parallel and