PERCEPTION AND SATISFACTION OF ECOTOURISM RESOURCE
DEVELOPMENT IN GUNUNG LEDANG JOHOR NATIONAL LEGENDARY
PARK: ECOTOURISTS PERSPECTIVE
Sabarudin bin. A.Kadir Wahab
1, Associate Professor
Dr. Mohd Rusli bin Ya’cob
21
Faculty of Environmental Studies, 2Corresponding Author, Faculty of Environmental Studies, Universiti Putra Malaysia, 43400 UPM Serdang, Selangor, Malaysia.
email: [email protected]
ABSTRACT
In conjunction with Visit Malaysia Year 2014 with the
theme “Celebrating 1Malaysia Truly Asia” as a great platform event for promoting ecotourism sites. Hence, ecotourism is one of the key sectors for, which is committed for utilizing ecotourism potential. GLJNLP approximately 107 sq. km (8,611 hectares) is nature based park with high potential features for ecotourism development in the natural ecosystem. The park has a very high concentration of ecotourists with the visitors flow on an average is 24,606 visitors yearly from the year 2011 to 2012. Ecotourism activities have significantly increased the need for the ecotourists to acquire knowledge on environmental awareness. Ecotourists however are central stakeholder of national parks and a profound understanding of their attitudes towards protected area management is important. Ecotourists‟ attitude in ecotourism activities has ability to find instant interpretation that can eliminate the frustrating them quickly, eliminate confusion and misinformation, and ultimately translate into more satisfied tourists. Therefore, this study attempts to fill in the knowledge gap in the literature. The study examined the
ecotourists‟ attitude via the socio-demographic factors, the visit characteristic by perception level and factor influence the satisfaction level. The results will provide a baseline data against which to measure
changes in ecotourists‟ attitude over the short and
medium terms. A quantitative survey was conducted among 213 respondents by using judgmental sampling with close-ended and open-ended questionnaires. Collected data were analyzed using descriptive statistics and multiple regression analysis. As a general findings, most 63.4 percent of the respondents are male, with the majority (56.3 percent) belonging to the below 25 years old age group. Nearly 55.9 percent have agreed that they are very much in self behaviour in environmental awareness. An analysis by the ecotourism activities, most 65.3 percent choose the climbing and hiking. An analysis on the natural features, 42.3 percent agreed that are very satisfied. The findings revealed there
are the independent variables which the factors
influencing respondents‟ satisfaction level from a set of predictor variables via the best linear prediction of a criterion variable. For the reason, there are independent variables have significance value p<0.05 that shows that each model predictor is significant. Since ecotourism activities have been boosting up at site area in line with the goals of JNP Strategic Plan 2012-2016, the results will also provide baseline information against which to measure changes in
ecotourists‟ attitudes over the short and medium
terms. Thus, it could help PTNJ to realize and be
more aware of the significance of ecotourist‟s
perception and satisfaction need to integrate into
JNP‟s strategic plan. PTNJ should provide an advance environmental knowledge to enhance the
ecotourists‟s skills to improve environmental
awareness and education. An improvement area in the advanced environmental education will grasp
ecotourists‟ attitude on the environmental skills and as a result ecotourism activities will be expected more efficient in the future. Conversely, the feedbacks and suggestions obtained from the visitors survey highlighted PTNJ has inadequate interpretive media for environmental education such as trained guides, an interpretation centre, appropriate signage, and publicity material. Indeed, visitors to bring back not only beautiful photos and souvenirs of the park, but as well, memorable, unique and priceless authentic experiences. This study also recommends further research to incorporate other moderating variables such as the legal and regularity environment. As a conclusion, the effectiveness of ecotourism activities
from the ecotourists‟ attitude, it is well-recognized activities implementation but some of the results showed that the activities are quite qualified in certain aspects. This may be due to the lacking in the exposure of environmental knowledge by the ecotourists themselves.
1. INTRODUCTION
1.1 Background
Ecotourism is regarded as environmental consciousness that promotes conservation of the natural resources as well as benefits the society at Hector Ceballos-Lascurain as traveling to undisturbed natural areas for studying, admiring, and enjoying the scenery and its wild plants and animals, as well as any existing cultural manifestations (Butler, 1991). In 2012, Malaysia registered 25 million tourist arrivals and RM60.6 billion in tourist receipts, placing the country firmly as the 10th most popular tourism destination in the world. Malaysia will celebrate its fourth Visit Malaysia Year 2014 with the theme
“Celebrating 1Malaysia Truly Asia” (Tourism Malaysia, 2013) as a great platform event for promoting ecotourism sites (Director-General of Tourism Malaysia, 2013). The Ministry of Tourism Malaysia also established ecotourism policy and guidelines as part of New Tourism Policy 2002 and National Ecotourism Plan 1997. Ecotourism is one of the key sectors for PTNJ, which is committed for utilizing ecotourism potential. Ecotourism at Gunung Ledang Johor National Legendary Park (GLJNLP) is nature based park with high potential features for ecotourism development in the natural ecosystem. The site has a very high concentration of ecotourists. Data from the on-site visitor counters show
significant increases in visitor numbers between the
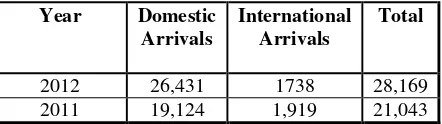
two years. Comparing the total registrations for comparative periods of measurement reveal a 7,126 (28.9 percent) visitors increase in visitation. Based on (PTNJ, 2011; 2012) figures, the total number of visitors is estimated at 21,043 in 2011 and 28,169 in 2012 (Table 1). The visitors flow on an average is 24,606visitors yearly.
Table 1 Visitors Arrivals at GLJNLP from the year 2011 to 2012
However success cannot be measured by the number of people who visit the operation, but consideration must be given as to the customers' levels of satisfaction and their likelihood of returning (Khairun Najiah Ahmad Zuliah Abd Hamid, 2011). Thus, the public perception and visitors can be influenced by socio-demographic factors as well as a variety of other psychology variables (Galoway, 2002). The ecotourism resource development as most important aspects in preservation and educate the ecotourists on the environmental awareness. Ecotourism resource developments also have significantly increased the need for the ecotourists to acquire knowledge on environmental awareness. In contrast, ecotourism activities effects and development impacts can have adverse environmental due to increased numbers' of visitor because of the harmful physical, pollution and depletion of natural resources (WWF Malaysia, 2013).
1.1 Problem Statement
A study conducted has immense ecotourism potential, considering the number of visitors who visit the site area in different seasons and the income generated by way of entry fee. Conversely through researcher observation that the forest nature is detrimental immensely due to compromising for conservation fees collection from the ecotourists who participating in the ecotourism activities. Income from tourism could contribute significantly to the better management of the site and outweigh the negative impact of tourism which can be significantly reduced by ecologically and sustainable practices (Fern et al., 1994). Human interactions have eroded and modified extensive forest tracks during the last century. PTNJ manager should give utmost importance to the adverse impact of the increasing pressure of the ecotourist on the biodiversity and its income generating and income dispersing capacity into the local economy. The following research questions are addressed: (i) What are the ecotourists’ socio -demographic profile at the study site? (ii) What are
the ecotourists’ perceptions on ecotourism resource development at the study site? (iii) What are the factor influence the ecotourists’ satisfaction levels towards the study site?
1.2 Objectives of this study
Basically, the study’s purpose to analyze the attitude
the ecotourists’ attitude. The current study examines the effectiveness of the ecotourism activities via a case study approach. The general objective of the research is to determine the ecotourists’ perspective on attitude of ecotourism activities to fulfill their environmental knowledge needs. The specific objectives of the study are:- (i) to determine the
ecotourists’ socio-demographic profile at the study site? (ii) to determine the ecotourists’ perceptions on ecotourism resource development at the study site? (iii) to determine the factor influence the ecotourists’ satisfaction as a recommendation and appropriate policy for PTNJ.
1.3 Significance of the study
This study attempts to fill in the knowledge gap in the literature by investigating tourists' attitudes toward the ecotourism resource development at GLJNLP.
From the ecotourists’ attitude perspective, levels of perception and level of satisfaction towards ecotourism activities are important due to its possible consequences on their environmental knowledge. This study would beneficial, as it will contribute in the evaluation of the ecotourism activities by PTNJ.
Ecotourists’ attitude in ecotourism activities has
ability to find instant interpretation that can eliminate the frustrating them quickly, eliminate confusion and misinformation, and ultimately translate into more satisfied tourists. It can also translate into more a better reputation for PTNJ. The evaluation of the ecotourism activities services effectiveness is
regarded as crucial in determining ecoturists’
satisfaction. The results from this study also will provide a baseline data against which to measure
changes in ecotourists’ attitude over the short and medium terms. The information about and generated by visitors is essential to the successful planning and management of natural areas. Thus, it will awaken PTNJ manager to reevaluate the services whether it really meet the ecotourists perception or not.
2. LITERATURE RIVIEW
2.1 Literature Survey
Previous environmental attitudinal research in a tourism context has concentrated on ecotourists and their attitudes, focusing on general environmental concerns (Dolnicar, 2010). As McDougal and Munro (1994) claimed that attitude is comprised of cognitive (beliefs and knowledge), affective (feelings of like or dislike) and behavioural components (action or intent to act). Attitude causes people either like or dislike an object, and move toward or away from it (Kotler,
2001). Hence, visitors however are central stakeholder of national parks and a profound understanding of their attitudes towards protected area management is important (Galloway, 2002; Muller and Job 2009; Von Ruschkowski, 2010). Visitor attitudes to potential management actions can assist in predicting the consequences of specific actions on the ecotourist experience, and thus result in management actions that take into account both visitor satisfaction and ecological well-being (McCool et al., 1990). For that reason, several studies have analysed factors influencing the attitudes of the visitor toward national parks in Europe (Machairas and Hovardas, 2005; Muller and Job, 2009; Papageorgiou, 2001; Sterl et al., 2008; 2010). Furthermore, studies by Dowling (1993) and Ballantyne et al., (1998) also emphasized the importance of, among other things, understanding
visitors’ attitudes and beliefs in relation to tourism
and the experience of natural area sites to aid in effective management. As regards a tourist’s
perception is important towards a tourist’s attitude,
having an effect on travel decisions (Tutors2u, 2010; Tourism Authority of Thailand, 2010). Perception is the process of attaining awareness or understanding of sensory information of course, communication is
an important aspect of changing someone’s
perception and attitude. Perception as the process by which an individual select, organize and interprets information inputs to create a meaningful picture of the world (Kotler, 2001). The impact of travel on
tourists’ attitudes and perceptions has been previously
analyzed (Carlson and Widaman 1988; Crompton 1979; Gardner 1986; Pearce 1982; Pizam, Neuman and Reichel 1978; Welds and Dukes 1985). The studies investigating possible attitudinal difference among nature-based tourists suggest a need for more
case studies of environmentally covering tourists’
(Beamont, 1999; Eagly & Chaiken, 1993). Environmental attitude can be used to predict behaviour and intention someone in the environment issue (Mobley et al., 2009). Conversely previous studies (Hvenegaard and Dearden, 1988; Muller and Job, 2009; Tomicevc et al., 2010) indicted that education influence protected area attitudes. Generally, the research on tourism in protected areas suggests that tourist who particularly appreciates the national park settings commonly show a more
positive attitude toward nature conservation (Newsome et al., 2002; Shultis and Way, 2006).
3. STUDY AREA
3.1 Site description
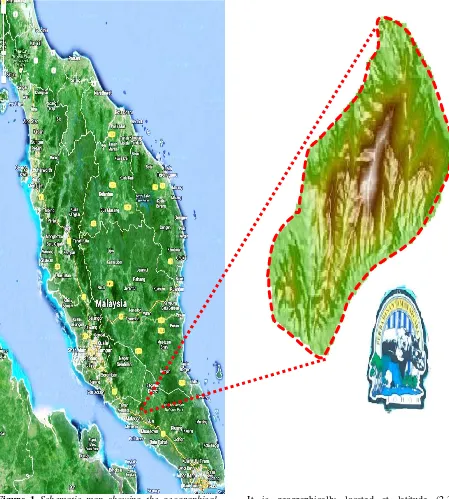
GLJNLPis located on north west of Johor and about 3 km from Sagil town of Ledang District (Figure 1).
Figure 1 Schematic map showing the geographical locality of GLJ NLP (Johor, Malaysia)
(102.5751 degrees) 102°34'30" East of the Prime Meridian on the Map of Malaysia. The park has been gazetted as Johor National Park (JNP) on 3rd October 2005 with covers an area of 107 sq. km (8,611 hectares). Gunung Ledang or 'Mount Ophir' peak is the highest mountain in southern Peninsular Malaysia with 1,276 metres above sea level which Malaysia's 64th highest mountain and the 6th most difficult to climb. Gunung Ledang is now a living legend, as curious or serious trekkers and nature lovers continue to scale its trails to submit which offers trekking, camping or recreation. There are three trekking entry points which in Lagenda trail, Jementah trail and Asahan trail. Meanwhile for the trekkers will be charged at RM17 (Malaysian) and RM37 (foreigner) for a day trip fee (PTNJ, 2013). There also the local trekker nature guides services for RM220 per day. Ecotourists have a choice of camping in the wilderness to listen to the mystifying sounds of insects and animals. A private chalets and huts provide modern accommodation, hall and food and beverage facilities. Rest shades, picnic spots and campsites are available. Recreational seekers make day trips to enjoy the serenity, or to enjoy a relaxing splash below
the waterfalls. Gunung Ledang’s fame is contributed
by its history as the mountain of hope for gold prospectors and its rich folklore that includes a pretty and ingenuous princess. Its enduring appeal is partly due celebrated association with the legend of the Princess of Gunung Ledang, who famously turned down a royal proposal as to preserve her independence. The locals believe the mountain to be the enchanted abode of fairies and forest spirit.
4. METHODOLOGY AND METHOD
4.1 Data Collection
4.1.1 Survey instrument
Researcher used the types of question that are relevant to the level of respondents. About 213 questionnaires were distributed to the selected ecotourists as respondents. The questionnaires were distributed directly to respective ecotourists on 3th to 23th October 2013 and collected on the spot. All questionnaires were returned by the respondents and representing 100 percent of the response rate. Beside the questionnaires, an interview was also conducted with the PTNJ manager and staffs including the local trekker nature guides, to get more details information on ecotourism activities. Information gathered from the questionnaires survey and interviews as the primary data were synthesized to support the current study. Meanwhile, sources from the journals, thesis and
PTNJ internal documents were collected as secondary data.
a. Sample and Sampling
The unit of analysis for this study is approximately 2,000 ecotourists who are visiting the site monthly were selected as a population perspective because of the time constraints for completion. This population is the target audiences where they will be asked to respond to the questionnaires. The sample for this study is subset or portion of the total population of ecotourists. A sample of 213 respondents was obtained and asked to participate in this survey. The questionnaires was distributed then collected personally and the response rate was 100 percent, meaning 213 questionnaires were collected in this study. The sampling is conducted by using judgmental sampling with the intent to ensure heterogeneity among the study sample.
b. Questionnaires Structure
The questionnaires were modified to suit the current
study’s requirement ecotourism activities. The questionnaires are divided into two section comprising 9 open-ended and 9 close-ended questions. The answers to all the questionnaires were treated confidential and data obtained from the results of the questionnaires have been used as evidence in findings of the current study. The first part of the questionnaires measure the psychographic pattern on
the extent to which measure the ecotourists’
perception level on the ecotourism resource development with the multiple answers of the open-ended and close-open-ended questions and any comments.
Respondents also are requested to rate the ecotourists’
satisfaction level based a four-point Likert type scale measurement ranging from 1=Very Satisfied, 2=Satisfied, 3=Dissatisfied and 4=Not Satisfied At All. The preference of ecotourists on the satisfaction of ecotourism resource development indicating lower value for higher preference. The second section consists of five questions pertaining to the
respondents’ socio-demographic information categories such as gender, age group, highest educational level, occupation and level of income.
4.2 Data Analysis
A total of 213 questionnaires were analyses by using the Statistical Package Social Science (SPSS) Statistic version 20 analytical tool software. For the interpretation of result, the frequency distribution
is used. This analysis is conducted to find out the percentage of distribution of the respondent socio-demographic factors and the visit characteristics of
respondents’ perception level. Besides that, the
multiple regression analysis predicted the factor influencing their satisfaction level on the ecotourism resource development.
4.2.1 Variables and Measure
The variables are taken from several questions related in the independence variable or process variable that can be set directly to achieve a desired output whereas dependent variable are the factor of this study.
a. Description Analysis
Descriptive statistics displays the frequencies and the percentage and also the mean value as distribution of respondents of the socio-demographic factors, distribution of the visit characteristic of respondents by perception level and distribution of respondents by satisfaction level. The frequencies procedure is useful for obtaining summaries of individual variables and distribution used to describe the profile of the sample.
b. Multiple Regression Analysis
Multiple Regression analysis estimates the conditional expectation of the dependent variable gives independence variable that is the average value of the dependent variable when the independence variables are fixed. It is used to understand which among the socio-demographic factors and perception levels (both independence variables) are related to satisfaction level (dependent variable), and to explore the forms of these relationship. Thus, it also suitable to identify the significant independent demographic variables and visit characteristics variables for every dependent factor.
6. RESULTS AND DISCUSSION
6.1 Respondents‟ Socio-Demographic Background
The socio-demographic profiles are comprised of the gender, age, education level, occupation and level of
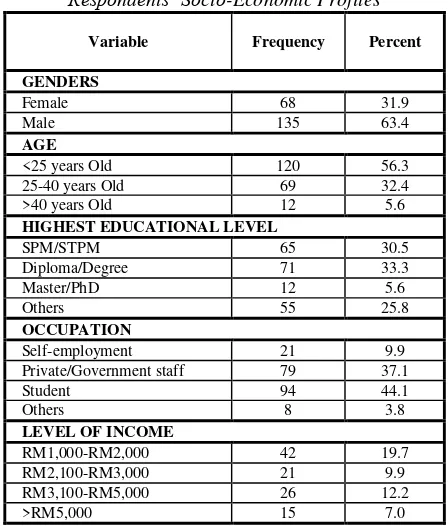
income of respondent’s information background. A frequency procedure was computed to analyze the socio-demographic of the respondents. Refer to Table 2, an analysis by the gender, 135 (64.4 percent) out of 213 respondents, are male ecotourists and 68 (31.9 percent) are female ecotourists. An analysis by the
age’s group shows most of the 120 (56.3 percent)
respondents are 24 years old and below. They are 69
(32.4 percent) respondents between the ages of 25 to 40 years old. A minority of age level is only 12 (5.6 percent) respondents are 41 years old and above. In term of analysis by the respondents highest educational level shows that (12) 5.6 percent out of 213 respondents, respondents hold a Master Degree and PhD Degree. The majority of the respondents who 71 (33.3 percent) have achieved a Bachelor Degree and Diploma while 65 (30.5 percent of the respondents achieved their SPM and STPM. This result is expected since environmental education is well grasped which they were exposed on educated person. Furthermore, an analysis by the level of
respondents’ occupation, 79 (37.1 percent) out of 213
respondents, are Private and Government Staffs. Most of the 94 (44.1 percent) respondents are the students. A minority of that is only 8 (3.8 percent) respondents are in the others. Then, an analysis by the level of income displays 42 (19.7 percent) of the respondents have been earning between RM1,000 to RM2,000 whereas 15 (7 percent) of the respondents have earned for more than RM5,000. A percentage of 9.9 percent, which consist of 21 respondents, that have been earning between RM2,100 to RM3,000 and the others for 26 (12.2 percent) respondents have earned between RM3,100 to RM5,000. These may be due to the most young ecotourists are the students who were participating in are economical, challenging and extreme trekking.
Table 2 Frequency Distribution Analysis by
Respondents‟ Socio-Economic Profiles
Variable Frequency Percent
GENDERS
Female 68 31.9
Male 135 63.4
AGE
<25 years Old 120 56.3
25-40 years Old 69 32.4
>40 years Old 12 5.6
HIGHEST EDUCATIONAL LEVEL
SPM/STPM 65 30.5
Diploma/Degree 71 33.3
Master/PhD 12 5.6
Others 55 25.8
OCCUPATION
Self-employment 21 9.9
Private/Government staff 79 37.1
Student 94 44.1
Others 8 3.8
LEVEL OF INCOME
RM1,000-RM2,000 42 19.7
RM2,100-RM3,000 21 9.9
RM3,100-RM5,000 26 12.2
6.2 Respondents‟ Visit Characteristics
The visit characteristics of respondents are entailed of the have ever visit site before, frequently visit site, expect to do most in site, most important aspects of ecotourism in site, main reason for visiting, considering behave in environmental awareness way, presence many tourists disturbing wildlife and natural environment, ecotourism operators damaging natural environments, have ever seen any tourist behave in an environmental unconscious way, given enough
information regarding do’s and don’ts by stake holders
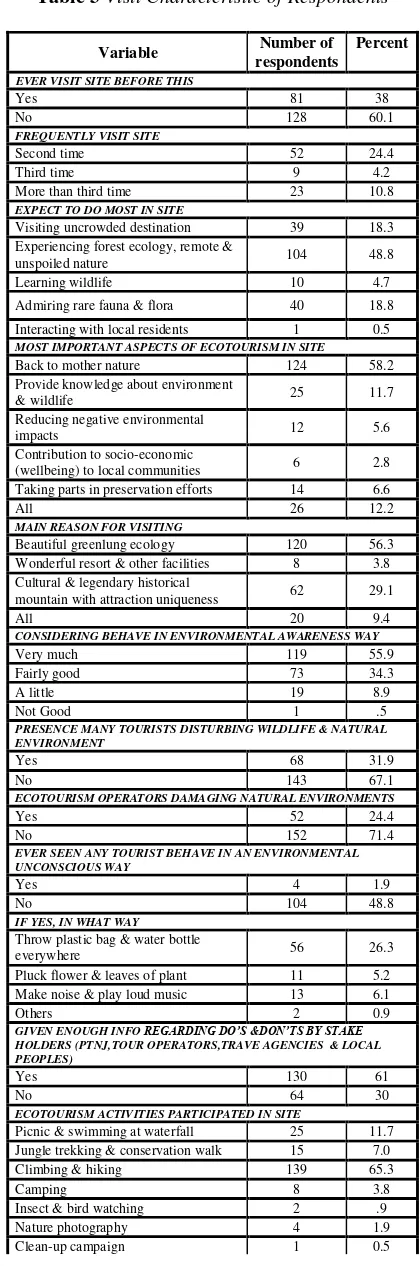
(PTNJ, tour operators, travel agencies and local peoples), ecotourism activities participated in site, and have seen local people and services providers protect the surroundings environment and ecology. A frequency procedure was computed to analyze the visit characteristic of respondents’ perception level. Table 3 shows an analysis by have ever visit the site before which shows that, 128 (60.1 percent) of the respondents are never visit the site before the survey was conducted. On the contrary, 81 (38 percent) out of 213 respondents, are agreed. Most 52 (24.4 percent) of the respondents are the second time visiting the site. There are 23 (10.8 percent) of the respondents were more than third time visiting. However, less 9 (4.2 percent) of the respondents frequently visit the site. The table also shows that 104 (48.8 percent) of the respondents who choose the experiencing forest ecology, remote and unspoiled nature as expectation to do most in site. On the other hand, 40 (18.8 percent) of the respondents have chosen admiring the rare fauna and flora. Meanwhile there are 39 (18.3 percent) of the respondents agreed on visiting the uncrowded destination. In addition, 10 (4.7 percent) of the respondents indicated that they chose to gain learning about wildlife. Similar to Chin et al., (2000) found that over two-thirds of visitors to Taman Negara Pahang had gone there to be close to nature (78.0 percent) whilst the most common activities at Bako National Park were hiking (76.0 percent), sightseeing (72.0 percent) and observing wildlife (66.0 percent). However, only 1 (0.5 percent) of the respondent answered he or she will be expected an interacting with the local residents. The table displays the ecotourism participated in by 124 (58.2 percent) of the respondents which all are related to the enjoyment of back to mother nature were very extremely most important aspect of ecotourism. Tourists are more interested in sightseeing rather than promoting environmental conservation while visiting ecotourism sites (Cheng & Wong, 2012). There are 25 (11.7 percent) of respondents indicated that ecotourism is providing the knowledge about environment and wildlife. However, less of the respondents answered it
is related to negative environmental impacts which only 12 (5.6 percent). The others 6 (2.8 percent) of the respondents think that the ecotourism may perhaps as ccontribution for developing the socio-economic or wellbeing to the local communities and 14 (6.6 percent) of them related to participating preservation efforts. Meanwhile 26 (12.2 percent) of the respondents indicated that they chose all the answers given. For the main reason for site visiting, the table shows that there are 120 (56.3 percent) of the respondents who choose the beautiful greenlung ecology which will be improving their environmental awareness. Meanwhile there are 62 (29.1 percent) of the respondents agreed because of cultural and legendary historical mountain with attraction uniqueness to them. On the other hand only 8 (3.8 percent) of the respondents have chosen the wonderful resort and other facilities. In addition, 20 (9.4 percent) of the respondents indicated that they chose all the answers given. An ultra-modern concrete building
serving as headquarters or lodge does not fit the image
of what people expect to find in a national park,
(Norman Backhaus, 2003). Domestic tourists do not
look for authenticity in the first place when travelling
to national parks; rather they are looking for a place for leisure activities (Cochrane, 1993). They do not look for the exotic, because for most of them tropical rainforests are a part of their experience of growing up in Malaysia (Norman Backhaus, 2003). An analysis by
the ranking of the respondents’ self behaviour in
percent) of the respondents are disagreed. On the contrary, only 4 (1.9 percent) of the respondents are agreed. Meanwhile there are 82 (38.5 percent) of the respondents which also agreed and have ever seen others tourists were throwing plastic bag and water bottle everywhere, plucking the flowers and leaves of the plant, make noise and play loud music and others. There are 130 (61 percent) of the respondents indicated that they chose agreed that the information given of regarding do’s and don’ts by stake holders (PTNG, tour operators, travel agencies & local peoples). Conversely, 64 (30 percent) of the respondent answered disagreed. Guidance (i.e. by travel agencies, travel books, park administrations etc.) does not always meet the expectations of the visitors (Norman Backhaus, 2003).An analysis by the ranking of ecotourism activities which the respondents have participated in site expression, most 139 (65.3 percent) of the respondents choose the climbing and hiking. Other 25 (11.7 percent) respondents came for picnic and swimming at waterfall. Meanwhile there are 15 (7 percent) of the respondents favoured on jungle trekking while 8 (3.8 percent) of the respondents chosen the camping activities. However, the ecotourism activities which less participating by the respondents such as insect & bird watching of 2 (0.9 percent), nature photography of 4 (1.9 percent), clean-up campaign of 1 (0.5 percent), and environmental education of 2 (0.9 percent) respectively. Partaking in the recreation activities in the natural environment, it helps people to escape boredom, emotional problems and health problems in the healthy way (Adrianne C. T., 2002). In addition, only 4 (6.1 percent) of the respondents have participated all of ecotourism activities in site. An analysis on have seen the local people and service providers protect the surrounding environment and ecology at site, most 95 (44.6 percent) of the respondents are considered as actived. Meanwhile there are 53 (24.9 percent) of the respondents are considered very active. On the contrary, 45 (21.1 percent) of the respondents are assumed they are less active. There are only 5 (2.3 percent) of the respondents supposed that they were do nothing in protecting the surrounding environment and ecology at site. According to Chin et al. (2000), results from visitor perceptions of the impacts of visitor use can be taken into consideration to identify potential indicators for monitoring environmental conditions in the National Park.
Table 3Visit Characteristic of Respondents
Variable Number of
EXPECT TO DO MOST IN SITE
Visiting uncrowded destination 39 18.3
Experiencing forest ecology, remote &
unspoiled nature 104 48.8
Learning wildlife 10 4.7
Admiring rare fauna & flora 40 18.8
Interacting with local residents 1 0.5
MOST IMPORTANT ASPECTS OF ECOTOURISM IN SITE
Back to mother nature 124 58.2
(wellbeing) to local communities 6 2.8
Taking parts in preservation efforts 14 6.6
All 26 12.2
MAIN REASON FOR VISITING
Beautiful greenlung ecology 120 56.3
Wonderful resort & other facilities 8 3.8 Cultural & legendary historical
mountain with attraction uniqueness 62 29.1
All 20 9.4
CONSIDERING BEHAVE IN ENVIRONMENTAL AWARENESS WAY
Very much 119 55.9
Fairly good 73 34.3
A little 19 8.9
Not Good 1 .5
PRESENCE MANY TOURISTS DISTURBING WILDLIFE & NATURAL ENVIRONMENT
EVER SEEN ANY TOURIST BEHAVE IN AN ENVIRONMENTAL UNCONSCIOUS WAY
Yes 4 1.9
No 104 48.8
IF YES, IN WHAT WAY
Throw plastic bag & water bottle
everywhere 56 26.3
Pluck flower & leaves of plant 11 5.2
Make noise & play loud music 13 6.1
Others 2 0.9
GIVEN ENOUGH INFO REGARDING DO’S &DON’TS BY STAKE HOLDERS (PTNJ,TOUR OPERATORS,TRAVE AGENCIES & LOCAL PEOPLES)
Yes 130 61
No 64 30
ECOTOURISM ACTIVITIES PARTICIPATED IN SITE
Picnic & swimming at waterfall 25 11.7 Jungle trekking & conservation walk 15 7.0
Climbing & hiking 139 65.3
Camping 8 3.8
Insect & bird watching 2 .9
Nature photography 4 1.9
Environmental education 2 0.9
All 4 6.1
HAVE SEEN LOCAL PEOPLE & SERVICES PROVIDERS PROTECT THE SURROUNDINGS ENVIRONMENT & ECOLOGY
Very active 53 24.9
Active 95 44.6
Less active 45 21.1
Do Nothing 5 2.3
6.3 Frequency of Respondents by Satisfaction Level
The satisfaction level of respondents is comprised of the quality services & public accommodation, natural features, friendliness welcoming to the visitor, and the quality of activities. Kothler (2000) defined
satisfaction as a person’s feeling of pleasure or
disappointments resulting from comparing a product are perceived performance (or outcome) in relation to his or her expectation. A descriptive statistics was
computed to analyze the extent of respondents’
satisfaction level in the ecotourism activities. In Table 4 displays an analysis on the quality services and public accommodation (mean=2.31) explained that 161 (75.6 percent) of the respondents identified where out of 63 (29.6 percent) very satisfied and 98 (46 percent) satisfied as well. This can attract the ecotourists attention in participating without boredom. Almost 12 (5.6 percent) out of 213 respondents, is dissatisfied whereas 2 (0.9 percent) said that it is not satisfied at all. Furthermore, an analysis on the natural features (mean=2.14), 90 (42.3 percent) of the respondents agreed that are very satisfied while 78 (36.6 percent) of the respondents are satisfied. However, only 8 (3.8 percent) of the respondents answered that they are dissatisfied on the natural features. Effective tourism management can actually enhance the quality of the natural resources that attract tourists in the first place, resulting in a positive feedback loop (McNeely and Thorsell, 1988). Another analysis on friendliness welcoming (mean=2.234) to the visitor explained that 86 (40.4 percent) of the respondents identified that it is very satisfied. This can attract the ecotourists attention in participating without boredom and revisit in the future. Meanwhile almost 78 (36.6 percent) are satisfied but 4 (1.9 percent) out of 213 respondents, said that it is not satisfied at all on the friendliness welcoming to the visitor. However, only 3 (1.4 percent) of the respondents answered that they are dissatisfied. In term of analysis on the quality of activities (mean=2.38) showed nearly 72 (33.8 percent) of the respondents agreed that are very satisfied while 84 (39.4 percent) respondents have agreed that they are satisfied. Majority of them enjoyed the ecotourism activities. Satisfied tourists are more likely to return to the same destination, and are more willing to share their positive traveling experience with their friends and relatives
(Mohammad Reza Jalil et al., 2013). However, about 6 (2.8 percent) of the respondents said that are dissatisfied. In addition, there are 7 (3.3 percent) out of 213 respondents said that it is not satisfied at all.
Table 4Frequency of Respondents by Satisfaction Level
Scale
Mean
Variable VS S D NS
Quality services & public accommodation
Friendliness welcoming 86 (40.4%) 78 (36.6%)
Quality activities 72 (33.8%)
Note: VS=Very satisfied; S=Satisfied; D=Dissatisfied; NS=Not satisfied at all
6.4 Factor Influencing Respondents‟ Satisfaction
Level by Multiple Regression Analysis
Multiple Regression Analysis was used to identify the best predictor of variable in a set of variables for the outcome variables of four factors which influenced the respondents’ satisfaction. This analysis aims to estimates the coefficient of the linear equation; involving one or more independence variables that best predict the value of the dependent variable (output variable) as a function of the value of the independent variable (input variable). The dummy variables are created that provides a means by which qualitative variable can be included in the analysis. Hence its can be used to find the best linear prediction of a criterion variable such as the quality services and public accommodation, natural features, friendliness welcoming, or quality activities as the
factor influencing respondents’ satisfaction level
from a set of predictor variables such as the socio-demographic factors and the perception level. If there is a perfect linear relationship between dependence variable and independent variable, R Square (R2) will equal 1. Multiple Regression is equal to absolute value of the correlation between the dependent variable and predictor value. Perceived value together with past behavior and satisfaction were found to be good predictors of entertainment
vacationers’ intention to revisit a destination (Petrick et al., 2001). In Multiple Regression Analysis, beta coefficient is used to explain the relative important of the attribute (independent variables) in contributing to
the variance in visitors’ overall satisfaction
value is low, because most of the independent variables such as SPM/STPM, second time visit, active protecting, less active protecting, and no damaging by operators derived from the model, are dummy variables. However, there are independent variables have significance value p<0.05 that shows that the model is significant. In addition, R2 of .513 indicates that 51.3 percent of the variance, in the dependent model of natural features, is explained by the model. The R2 value is low, because most of the independent variables such as the group age between 25-40 years old, second time visit, very active protecting, less active protecting, climbing and hiking, clean-up campaign, disturbances, no
disturbances enough do and do not, very much awareness, a little awareness not good awareness fairly good awareness derived from the model, are dummy variables. However, there are independent variables have significance value p<0.05 that shows that the model natural features is significant. Moreover, in the dependent model of friendliness welcoming, the independent variable such as male, the all group age, SPM/STPM, active protecting, less active protecting, climbing and hiking, all participation, environmental education, disturbances and no disturbances are the variables that significantly influencing the dependent variable of friendliness welcoming. The predicted regression coefficient (B) in the range -2.889 to 3.990 where as a p-value in the range .002 to .048. The reason for this may be the high correlation between those independent variables and the friendliness welcoming. However, there are independent variables have significance value p<0.05 that shows that the model is significant. Furthermore, in the dependent model of quality activities, the independent variable such as the group age over 40 years old, SPM/STPM, second and third time visit, very active and active protecting, climbing and hiking, cleanup campaign, insect and bird watching, damaging by operator, picnics and swimming, trekking and walk, disturbance, and no damaging by operator are the variables that significantly predicts the dependent variable of quality activities. The predicted regression coefficient (B) in the range -2.689 to 3.652 where as a p-value in the range .000 to .036, The reason for this may be the high correlation between that independent variables and the quality activities. However, there are independent variables have significance value p<0.05 that shows that the model is significant.
Table 5 Model Prediction Influencing Respondents‟ Satisfaction Level
Model Summary: QUALITY SERVICES PUBLIC ACCOMMODATION
Model R R Square Adjusted R Square Std. Error of the Estimate
1 .642a
.412 .196 1.238
a. Predictors: (Constant), learning wildlife, no enough do & don't, trekking/walk, interacting local resident, clean-up campaign, insect/bird watching, third time visit, environmental education, no behave unconscious, not good awareness, taking part preservation efforts, cultural/legendary uniqueness, master/phd, admire fauna flora, no damaging b operators, less active protecting, camping, knowledge on environment/wildlife, male, rm3,100-5,000, second time visit, fairly good awareness, behave unconscious, wonderful resort/facilities, >40 years old, nature photography, reducing negative impacts, rm2,000-3,000, socio-economic to local communities, no disturbances, rm1,000-2,000, picnic/swimming, a little awareness, spm/stpm, very active protecting, all participation, >rm5,000, visiting uncrowded, more third time visit, no nothing protecting, self-employment, <25 years old, back to mother nature, diploma/bachelor, student, enough do & don't, experiencing forest, active protecting, private/government staff, climbing/hiking, damaging by operators, never visit before, 25-40 years old, female, ever visit before, disturbances, very much awareness
Model Summary: NATURAL FEATURES
Model R R Square Adjusted R Square Std. Error of the Estimate
1 .716a .513 .334 1.158
a. Predictors: (Constant), learning wildlife, no enough do & don't, trekking/walk, interacting local resident, clean-up campaign, insect/bird watching, third time visit, environmental education, no behave unconscious, not good awareness, taking part preservation efforts, cultural/legendary uniqueness, master/phd, admire fauna flora, no damaging b operators, less active protecting, camping, knowledge on environment/wildlife, male, rm3,100-5,000, second time visit, fairly good awareness, behave unconscious, wonderful resort/facilities, >40 years old, nature photography, reducing negative impacts, rm2,000-3,000, socio-economic to local communities, no disturbances, rm1,000-2,000, picnic/swimming, a little awareness participation, >rm5,000, visiting uncrowded, more third time visit, no nothing protecting, self-employment, <25 years old, back to visit before, disturbances, very much awareness
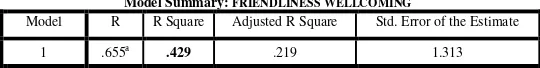
Model Summary: FRIENDLINESS WELLCOMING
Model R R Square Adjusted R Square Std. Error of the Estimate
1 .655a .429 .219 1.313
a. Predictors: (Constant), learning wildlife, no enough do & don't, trekking/walk, interacting local resident, clean-up campaign, insect/bird watching, third time visit, environmental education, no behave unconscious, not good awareness, taking part preservation efforts, cultural/legendary uniqueness, master/phd, admire fauna flora, no damaging b operators, less active protecting, camping, knowledge on environment/wildlife, male, rm3,100-5,000, second time visit, fairly good awareness, behave unconscious, wonderful resort/facilities, >40 years old, nature photography, reducing negative impacts, rm2,000-3,000, socio-economic to local communities, no disturbances, rm1,000-2,000, picnic/swimming, a little awareness, spm/stpm, very active protecting, all participation, >rm5,000, visiting uncrowded, more third time visit, no nothing protecting, self-employment, <25 years old, back to mother nature, diploma/bachelor, student, enough do & don't, experiencing forest, active protecting, private/government staff, climbing/hiking, damaging by operators, never visit before, 25-40 years old, female, ever visit before, disturbances, very much awareness
Model Summary: QUALITY ACTIVITIES
Model R R Square Adjusted R Square Std. Error of the Estimate
1 .680a .462 .264 1.280
7. CONCLUSION AND RECOMMENDATION
As a general findings, most 63.4 percent of the respondents are male, with the majority (56.3 percent) belonging to the below 25 years old age group. The occupations are gathered, although the largest group is the students (44.1 percent). Meanwhile mostly 24.4 percent are the second time visiting the site. Almost 48.8 percent who choose the experiencing forest ecology, remote & unspoiled natures. The ecotourism participated in by 58.2 percent are back to the mother nature. There are 56.3 percent who choose the beautiful greenlung ecology. Nearly 55.9 percent have agreed that they are very much in self behaviour in environmental awareness. However, 71.1 percent are thought that the ecotourism operators are not damaging the natural environment. An analysis on have ever seen other tourists behave in an environment way, most 48.8 percent are disagreed. Furthermore, there are 61 percent indicated that they choose agreed that the information given of regarding
do’s and don’ts. An analysis by the ecotourism
activities, most 65.3 percent choose the climbing and hiking, and have seen the local people and service providers, most 44.6 percent are considered them as active in protecting the surrounding environment and ecology wheras on the natural features, 42.3 percent agreed that are very satisfied. Another analysis on friendliness welcoming that 40.4 percent identified is very satisfied. Meanwhile for the quality services and public accommodation, mostly 46 percent are satisfied. For the quality of activities, 39.4 percent
a. Dependent Variable: QUALITY SERVICES PUBLIC ACCOMMODATION
Coefficientsa
a. Dependent Variable: NATURAL FEATURES
Coefficientsa
Model Unstandardized Coefficients Standardized Coefficients
a. Dependent Variable: FRIENDLINESS WELLCOMING
Coefficientsa
commonalities were identified among the attributes that cast-weighted the overall satisfaction level across the four model categories. The findings revealed there are the independent variables which the factors
influencing respondents’ satisfaction level from a set
of predictor variables via the best linear prediction of a criterion variable. For the reason, there are independent variables have significance value p<0.05 that shows that each model predictor is significant. Since ecotourism activities have been boosting up at site area in line with the goals of JNP Strategic Plan 2012-2016, the results will also provide baseline information against which to measure changes in
ecotourists’ attitudes over the short and medium terms. Thus, it could help PTNJ to realize and be more
aware of the significance of ecotourist’s perception and satisfaction need to integrate into JNP’s strategic
plan. The results from the study may be varying due to different environmental knowledge background from the demographic factors. The study also reveals that ecotourists are different in their tastes and preferences. Understanding this information will help PTNJ to create an efficient park management, and thus will make a contribution to the long-term sustainable development of ecotourism areas. PTNJ should undertake the efforts to obtain information about
tourist’s expectation. Therefore, understanding the motives of the tourists in relation to their attitude change, and further adaptation of desirable behaviours through their visit to ecotourism sites would assist resource managers, ecotourism operators, local residents, and policy makers to develop a comprehensive ecotourism plan (Mingming Cheng, Xin Jin & IpKin Anthony Wong, 2013). Researcher obtained feedbacks and suggestions from the visitors on whether PTNJ have met the needs of the ecotourists in different aspects and how it promotes ecotourism. Conversely, PTNJ has inadequate interpretive media for environmental education such as trained guides, an interpretation centre, appropriate signage, and publicity material. As a recommendations, research could be conducted which involves all the ecotourists. This will make more accurate in finding the answers. In comparing these, it needs most ecotourists to be interviewed in getting their answers and responses. The ecotourism activities are meaningful if it is being participating and explored by ecotourists. The ability to grasp environmental awareness and education should be challenging for ecotourists to acquire new environmental skill and knowledge. PTNJ should provide an advance
environmental knowledge to enhance the ecotourists’s
skills to improve environmental awareness and education, also to meet the JNP objective. The establishment of an education centre on-site would improve satisfaction with the visit, and thus better promote a conservation message (Chunyu Liu, Wen Xiao, Junsheng Li, Peter Pechacek, 2012). PTNJ should start carrying out certain move to address these gaps via more stricter enforcement of regulations, increasing the frequency of patrol around, increasing the number of staffs on duty, putting up more board
sign on do’s and don’ts, designing zones for various recreational activities. It is also suggested that PTNJ assess the possible environmental degradation and carrying capacity to control the number of tourists enjoying the ecotourism activities. PTNJ needs to establish a program for monitoring and reviewing the successes or failures of the recreational activities to ensure the least damage to the natural environment and local communities surrounding the park. Ecotourism is an activity carried on within a set of social and physical conditions that are heavily influenced by government decision making (Parker, 2001). Indeed, visitors to bring back not only beautiful photos and souvenirs of the park, but as well, memorable, unique and priceless authentic experiences. This study also recommends further research to incorporate other moderating variables such as the legal and regularity environment. A participatory approach to the development of ecotourism in the site will ensure both economic and environmental security. To conclude about the ecotourism resource development from the
ecotourists’ attitudes, it is well-recognized activities implementation but some of the results showed that the activities are quite qualify in certain aspects. This may be due to the lacking in the exposure of environmental knowledge by the ecotourists themselves.
ACKNOWLEDGEMENTS
REFERENCES
Abdul Rahman, S., Daud, N., Mior Harun, M H & Adam A. A. 2009. Exploring Tourisms‟ Attitudes
Towards Sustainable Tourism. Proceedings of the International Conference on Advances in Tourism Economics. Portugal, 23-24 April.
.
Andrada, R. and Jinyang Deng. 2010. ENJOYING
GREEN CITIES: ASSESSING VISITORS‟
ATTITUDES AND PREFERENCES FOR URBAN FORESTS IN WASHINGTON, D.C. Proceedings of the 2010 Northeastern Recreation Research Symposium GTR-NRS-P-94.
Assessment of Biological Diversity in Malaysia. 1997. Ministry of Science, Technology and the Environment.
Ballantyne, R., J. Packer, and E. Beckman. 1998.
Targeted interpretation: Exploring relationships
among visitors‟ motivations, activities, attitudes,
information needs and preferences. J. Tourism Stud. 9(2):14–25.
Beaumont, N. 1999. How do ecotourism experiences contribute to environmental knowledge, attitudes and behaviour?. In M. Newson (ed.) Australian Ecotourism Guide 2000 (pp. 16–17). Brisbane: Ecotourism Association of Australia.
Beaumont, N. 1998. Promoting pro-environmental attitudes and behaviours through eco-tourism: that's the theory but does it happen in practice?. In S. McArthur (ed.) Australia's Ecotourism Industry: A Snapshot in 1998. Brisbane, Ecotourism Association of Australia, 21-28.
Bob McKercher, Bruce Prideaux & Sharon F.H. Pang. 2013. Attitudes of Tourism Students to the Environment and Climate Change. Asia Pacific Journal of Tourism Research, 18:1-2, 108-143, DOI: 10.1080/10941665.2012.688514.
Boshof, A.F., Landman, M., Kerley, G.I.H., and Bradfield, M. 2007. Profiles, views and observations of visitors to the Addo Elephant National Park, Eastern Cape, South Africa. South African Journal of Wildlife Research, 37(2): 189-196.
Cable, T., Knudson, D., Udd, E. and Stewart, D. 1987. Attitude change as a result of exposure to interpretive messages. Journal of Park and Recreation Administration 5 (1), 47–60.
Cessford, G. 1998. Visitors Satisfactions, Impact Perceptions, and Attitudes Toward Management Options on the Abel Tasman Coastal Track. Department of Conservation, Welington, New Zealand.
Chew Sze Siong, Norasikhin Shahruddin and Lim Lee Sah. 2009. Mengenalpasti punca-punca yang menyebabkan seasonality dalam pelancongan di Gunung Ledang. Research Management Institute. Universiti Teknologi MARA.
Chin C.L.M., Moore, S.A., Wallington, T.J., & Dowling, R.K. 2000. Ecotourism in Bako National Park, Borneo: Visitors‟ Perspectives on Environmental Impacts and their Management. Journal of Sustainable Tourism, 8 (1): 34 – 42.
Chunyu Liu, Wen Xiao, Junsheng Li, Peter Pechacek. 2012. Attitude of tourists visiting nature reserve in China. DOI: 10.1016/j.tmp.2012.09.003
Clevo Wilson, Clem Tisdell and David Merritt. 2004.
Glow Worms as a Tourist Attraction in Springbrook National Park: Visitor Attitudes and Economic Issues. ISSN 1327-8231School of Economics, University of Queensland.
David B. Weaver and Laura J. Lawton. Visitor Attitudes toward Tourism Development and Product Integration in an Australian Urban-Rural Fringe. Journal of Travel Research 42: 28 DOI: 10.1177/0047287503258834.
Deng, J., Qiang, S., Walker, G. J., & Zhang, Y. 2003.
Assessment on and perception of visitors‟ environmental impacts of nature tourism: A case study of Zhangjiajie national forest park, China. Journal of Sustainable Tourism, 11(6), 529–548.
Eco-tourism Johor Malaysia. Johor Tourism Action Council. http://www.tourismjohor.com.
Firth,T.and Hing,N. 1999. Backpacker hotels and their guests: Attitudes and behaviours relating to sustainable tourism. Tourism Management 20, 251–4.
Fountain, J. and Pforr, C. 2006. „The real things‟: tourists‟ attitudes towards tourism development
on the Coral Coast, Australia. Cutting Edge Research in Tourism - New Direction, Challenges and Applications. School of Management, University of Surrey, 6-9 June 2006.
Galloway, G., & Lopez, K. 1999. Sensation seeking and attitudes to aspects of national parks: a preliminary empirical investigation. Tourism Management, 20, 665-671.
Han, H., Hsu, L.J., & Lee, J. 2009. Empirical investigation of the roles of attitudes toward green behaviours, overall image, gender, and age in
hotel customers‟ eco-friendly decision-making process. International Journal of Hospitality Management, 28, 519-528.
Heberlein, T. 1989. Attitudes and environmental management. J. Social Issues 45(1):37–57.
Hee Lee & Gianna Moscardo. 2005. Understanding the Impact of Ecotourism Resort Experiences on
Tourists‟ Environmental Attitudes and
Behavioural Intentions. Journal of Sustainable Tourism, 13:6, 546-565. DOI: 10.1080/0966958050866858.
Hudson, S. and Ritchie, J. R. B. 2001. Cross cultural tourist behaviour: an analysis of tourist attitudes towards the environment. Journal of Travel and Tourism Marketing 10(2/3): 1–22.
Hughes, M., & Saunders, A. M. 2005. Interpretation, activity participation, and environmental attitudes of visitors to Penguin Island, Western Australia. Society and Natural Resources, 18: 611–624.
Jeffery S. Swanagan. 2000. Factors Influencing Zoo Visitors' Conservation Attitudes and Behavior.The Journal of Environmental Education, 31:4, 26-31, DOI: 10.1080/00958960009598648.
Johor National Park Strategic Plan 2012-2016. 2012. Johor National Park.
Jurowski, C., M. Uysal, D. R. Williams, and F. P. Noe. 1995. An examination of preferences and evaluations of visitors based on environmental attitudes: Biscayne Bay National Park. J. Sustain. Tourism 3(2):73–86..
Kaiser, F.G., Wolfing, S. and Fuhrer, U. 1999.
Environmental attitude and ecological behaviour. Journal of Environmental Psychology 19, 1–19.
Kalsom Kayat, Nurhazani Mohd Shariff, Mohamad Khairi Mohamad@Alwi. 2003. Ecotourism in The IMT-GT Region: Issues and Challenges. Universiti Utara Malaysia Press.
Kaltenborn, B. P., Nyahongo, J. W. and Kideghesho, J. R. 2011. The attitudes of tourists towards the environmental, social and managerial attributes of Serengeti National Park, Tanzania. Tropical Conservation Science, 4 (2):132-148.
Khairun Najiah Ahmad Zuliah Abd Hamid. 2011.
Customer Loyalty To Ecotourism Destination In Ensuring Repeat Tourist: A Case Of Endau Rompin National Park (ERNP), Malaysia. Research Management Institute (RMI), Universiti Teknologi MARA Shah Alam.
Kim, A.K., Airley, D. and Szivas, E. 2011. The multiple assessment of interpretation
effectiveness: promoting visitors‟ environmental
attitudes and behavior. Journal of Travel Research, 50(3), 321-334.
Lee, W.H., and Moscardo, G. 2005. Understanding the impact of ecotourism resort experiences on
tourists‟ environmental attitudes and behavioral intentions. Journal of Sustainable Tourism 13 (6), 546–565.
Lewis T. O. Cheung & Lincoln Fok. 2013. Assessing the Role of Ecotourism Training in Changing Participants' Pro-Environmental Knowledge, Attitude and Behaviour. Asia Pacific Journal of
Tourism Research. DOI:
10.1080/10941665.2013.797003.
Littlejohn, M. 2000. Visitor opinions and park resources. Park Science, 20 (1), 32-33.
Lovelock. 2003. Research Notes: international and domestic visitors' attitudes as constraints to hunting tourism in New Zealand. Journal of Sport & Tourism, 8:3, 197-203, DOI: 10.1080/14775080310001690512.
Manning, R., W. Valliere, and B. Minteer. 1999.
Values, ethics and attitudes toward national forest management: An empirical study. Society Natural Resources,12(5):421–436.
Martin Muller and Hubert Job. 2008. Managing
natural disturbance in protected areas: tourists‟
attitude towards the bark beetle in a German National Park. Biological Conservation, 142, 375-383 doi: 10.1016/j.biocon.2008.10.037
Mastura Jaafar, Siti Aishah Maidin. 2012.
Ecotourism-related products and activities, and the economic sustainability of small and medium island chalets. Tourism Management 33:683-691.
MALAYSIA TOURISM PROMOTION BOARD. http://www.tourismmalaysia.gov.my/
McCool, S.F. and Lime, D.W. 1988. Attitudes of visitors toward outdoor recreation management policy In A.H. Watson (ed.). Outdoor Recreation Benchmark 1988: Proceedings of the National Outdoor Recreation Forum (pp. 401-411). Ashville: USDA, Forest Service.
Michael Hughes & Angus Morrison-Saunders. 2003.
Visitor Attitudes Toward a Modified Natural Attraction, Society & Natural Resources. An International Journal, 16:3, 191-203, DOI: 10.1080/08941920309160.
Mingming Cheng , Xin Jin & IpKin Anthony Wong, Current Issues in Tourism. 2013. Ecotourism site in relation to tourist attitude and further behavioural changes, Current Issues in Tourism. DOI: 10.1080/13683500.2013.800030.
Mohd Rusli Ya’cob, Ahmad Shuib, Mohd Farid
Mamat and Alias Radam. 2008. How Much Does Ecotourism Development Contribute to Local Communities? An Empirical Study in a Small Island. The ICFAI Journal of Environment Economics, 4(2):54 - 67.
Mohd Rusli Yacob, Alias Radam and Khairil Wahidin Awang. 2008. Economic Valuation of Marine Parks Ecotourism Malaysia: The Case of Redang Island Marine Park. Universiti Putra Malaysia Press. ISBN 978-967-5026-98-0.
Mohsin, A. 2005. Tourist attitudes and destination
marketing; the case of Australia‟s Northern
Territory and Malaysia. Tourism Management, 723-732.
National Ecotourism Plan.1997. Ministry of Arts, Culture and Tourism. Malaysia.
Normala Daud and Sofiah Abdul Rahman. 2011.
Tourist Attitudes towards Sustainable Tourism: Empirical Evidence From Malaysian National Park, Taman Negara. 2010 International Conference on E-business, Management and Economics IPEDR vol.3.
Panisa Mechinda, Sirivan Serirat and Nak Gulid. 2009. An examination of tourists' attitudinal and behavioral loyalty: Comparison between domestic and international tourists. Journal of Vacation Marketing. 15: 129 DOI: 10.1177/1356766708100820.
Peter Mason & I-Ling Kuo. 2008. Visitor Attitudes to Stonehenge: International Icon or National Disgrace?. Journal of Heritage Tourism, 2:3, 168-183, DOI: 10.2167/jht058.0.
Powell, R. 2005. Nature-based tourism within protected areas: Effects of participation on knowledge, attitudes, values, and behaviors and
the factors that influence these outcomes. PhD dissertation.Yale University, New Haven.
Reichel, A., Uriely, N., & Shani, A. 2008. Ecotourism
and simulated attractions: Tourists‟ attitudes
towards integrated sites in a desert area. Journal of Sustainable Tourism, 16(1), 23–41. doi: 10.2167/jost711.0.
Robert B. Powell & S. H. Ham. 2008. Can Ecotourism Interpretation Really Lead to Pro-Conservation Knowledge, Attitudes and Behaviour? Evidence from the Galapagos Islands. Journal of Sustainable Tourism, 16:4, 467-489.
Sofiah Abdul Rahman and Normala Daud. 2011. An analysis of tourists' attitudes towards sustainable tourism: application to Malaysia. International Journal of Sustainable Development 14:206-224. Faculty of Business Management, Universiti Teknologi MARA, Shah Alam, Selangor.
The Economic Planning Unit. 2008. Ninth Malaysian Plan Prime Minister's Department, Putrajaya.
Research, 8: 22. DOI: 10.1177/ 109634808400800204.
Tisdell, C. and Wilson, C. 2003. “Visitor profiles and
environmental attributes, especially of birds, attracting visitors to Lamington National Park:
tourist attitudes and economic issues”. Economics, Ecology and the Environment, Working Papers No. 76, School of Economics, University of Queensland.
__________________________________ SABARUDIN BIN A.KADIR WAHAB 2013
This research project report was submitted to the Faculty of Environmental Studies of Universiti Putra Malaysia and has been accepted as fulfilment of the requirement for the Degree of Master of Environment.