Subsea Gas Pipeline Risk Assessment during
Hot Tapping Installation
KB Artana1, I Made Ariana1, AAB Dinariyana1, Dhimas Widhi Handani 1, and Emmy Pratiwi1
Abstract This paper examines the risk to subsea gas pipeline during hot-tapping installation process. Hot tapping is one method to connect new pipeline to existing pipeline while they remain in service. In this study it is considered that hot tapping is installed using crane barge. To assure the crane barge in steady position, the crane barge is moored by means of mooring chain at several locations. These mooring activities and hot tapping installation possess potential risk to existing subsea facilities. Hence, in general there are two objectives in this study. Firstly, determining the safe distance between mooring chain for and the existing facilities. Second obcjective is performing risk level due to external load that may occurs during installation. If the risk level is unacceptable, some mitigations will be suggested. The risk level is determined by analyzing frequency and its consequence then will be mapped into risk matrix according to DNV-RP-F107. From mooring distance analysis, the result can be used as a reference for positioning the mooring point of crane barge. Based on the result of risk assessment to facilities, risks due to external load such as dropped anchor, dragged anchor, ship sinking and dropped object are in the As Low As Reasonably Practicable (ALARP) region which mean, in the practical life risks are acceptable as long as the frequency is maintained in the lowest rank.
Keywords Risk Assessment, DNV-RP-F107, Hot Tapping.
AbstrakPaper ini mengangkat masalah risiko terhadap pipa gas bawah laut selama proses instalasi hot-tapping. Hot tapping merupakan salah satu metode yang umum digunakan untuk membuat sambungan pipa baru ke pipa yang sudah ada dengan memastikan aliran dari pipa yang telah ada tidak terputus. Pada studi ini, pemasangan hot-tapping dilakukan dengan menggunakan crane barge. Untuk memastikan bahwa crane barge berada pada posisi yang stabil, crane barge tersebut ditambatkan dengan mooring chain pada beberapa lokasi. Aktifitas mooring dan instalasi hot-tapping menimbulkan potensi risiko terhadap fasilitas bawah laut yang telah ada. Oleh karena itu, pada studi ini terdapat dua tujuan yaitu menentukan jarak aman jangkar terhadap fasilitas dan melakukan penilaian risiko akibat beban eksternal yang berpotensi memberikan dampak terhadap pipa gas bawah laut. Jika risiko berada pada level tidak diterima, maka akan diberikan opsi mitigasi. Tingkat risiko ditentukan dengan menganalisis frekuensi dan konsekuensinya kemudian akan dipetakan ke dalam matriks risiko sesuai dengan DNV-RP-F107. Hasil dari analisis jarak mooring dapat digunakan sebagai acuan dalam menempatkan mooring point. Berdasarkan hasil dari penilaian risiko terhadap fasilitas, risiko akibat beban eksternal yaitu dropped anchor, dragged anchor, ship sinking dan dropped object berada pada daerah As Low As Reasonably Practicable (ALARP) yang artinya secara praktis risiko dapat diterima selama tingkat frekuensi kejadian tidak meningkat.
Kata KunciPenilaian Risiko, DNV-RP-F107, Hot Tapping.
I. INTRODUCTION1
n pipeline natural gas distribution system, it is frequently necessary to expand or modify the existing pipeline by connecting to a new export pipeline. Normally in new pipeline connection installation, some system in the existing pipeline should be switched off and removed the gas to the atmosphere to make sure that the connection is safe. Tie in as one of pipeline connection method which need to apply those procedures. Tie in is a method by means of cutting and welding the new T shaped pipe line with valve on gas pipeline [1]. During tie-in process, it has some hazards such as presence of combustible gases inside or outside of the pipe and causes fire and burn injuries [1].
Making connection to existing piping without interruption or removing contained material even during operation is possible by applying hot tapping method. Hot tapping is one alternative method to connect new pipeline segment to existing pipeline without closing the operating pipeline. The most benefit of hot tapping is
1KB Artana, I Made Ariana
,
AAB Dinariyana Dhimas WidhiHandani Emmy Pratiwi is with Departement of Marine Engineering, Institut Teknologi Sepuluh Nopember, Surabaya, 60111, Indonesia. E-mail: [email protected]; [email protected]; [email protected]; [email protected]; [email protected].
continuous system operation thus avoiding costly system shutdown and service interruptions.
Hot tapping has been applied in Calgary, Canada, to complete more than 700 large diameter (12-30 in) without incident since 1960. The advantage of a hot tap resulted in the avoidance of gross revenue losses, no environmental emission, and seamless service. When a hot tap is success, operational effects will be minimize [2]. In many cases, crane barge is used for installing hot tapping. During mooring installation of crane barge in the pipeline area may give a potential to pipeline damage [3]. Some hazards could occur due to hot tapping installation using crane barge such as dropped anchor, dragged anchor, ship sinking and dropped object. Dinariyana et al. analyze the risk assessment due to external loads that could potentially impact on the underwater gas pipeline facilities during hot tapping installation [4].
This paper presents risk assessment of dropped anchor, dragged anchor, ship sinking and dropped object during crane barge operation according to DNV-RP-F107. Before assessing the risk due to external load, this paper determine the safe distance between mooring chain and pipelines. In the literature, research on risk assessment based on DNV-RP-F107 has been reported. For example risk assessment of subsea gas pipeline due to development of jetty or port [5][6]. Artana describes a case study on risk assessment of an export gas pipeline
The Journal for Technology and Science, Vol. 26, No. 2, August 2016
due to anchor dropped based on DNV Recommended Practice (RP) F107 [7]. Liu et al. [8] uses DNV-RP-F107 to support risk ranking and risk reducing measures combined with Bayesian Network (BN) models. Dinariyana et al. [9] examines the risk of pipeline and subsea gas pipeline due to mooring vessel operation in tie-in spool installation according to DNV-RP-F107.
The paper is organized as follows: Section 2 presents the safe distance between mooring chain and the existing facilities as a reference for positioning the mooring point of crane barge. Section 3 explains the risk level due to hot tapping installation using crane barge. It was determined by analyzing frequency and consequence then will be mapped into risk matrix according to DNV-RP-F107. Section 4 shows the result mooring analysis and the risk assessment and Section 5 contains the conclusions and suggest mitigations.
II. MOORING ANALYSIS
Risk assessment is for assess some potential hazards whether can be accepted or not. Prior to risk assessment, a complete system description or scenario should be prepared.
One of the most important aspect of system description or scenario is mooring analysis. It is used to determine the safe distance between mooring chain and subsea gas pipeline. The safe mooring distance is affected by distance between connection point at vessel, subsea fasilities and dropping object.
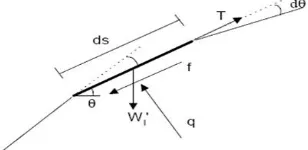
As shown in Figure, for mooring line provided by a certain water depth, F (horizontal restraining force) is given by the formula as follows:
𝐹 = 𝑇 − 𝐻µ𝑔 (1)
Where µ is the unit mass per unit length while g is the acceleration due to gravity. Horizontal restraining Force (F) at any point along the mooring line is constant, so that the tension in the mooring chain (T) varies along the mooring line of first T value, the connection point according to the following equation is [10]:
𝑇𝑠2= 𝐹2+ 𝑉𝑠2 (2)
Where Vs is the vertical load at distance S along the mooring line. This change as follow the equation below [10]:
𝑉𝑠 = 𝑠µ𝑔 (3)
Horizontal displacement (ΔX) can be calculated from the connection point (CP) due to the change of AT = T0–
T1 in the tension of mooring line according to the
following equation [10]:
∆𝑋 = 𝐹 log{(𝑇0+ 𝑉1) (𝑇⁄ 1+ 𝑉1)} µ𝑔⁄ (4) Where T0 is initial tension in the mooring line, V0 is
initial vertical load in the mooring line, T1 is tension at a
distance X and V1as vertical load at a distance X.
While the vertical displacement (ΔH) of the connection point (CP) can be determined by the following formula [10]:
∆𝐻 = (𝑇0+ 𝑇1) µ𝑔⁄ (5)
III. RISK ASSESSMENT DUE TO CRANE BARGE The second scope in this study is subsea gas pipeline risk assessment due to external load. External load
means hazards that may occur caused by hot tapping installation using crane barge.
Hazard Identification
Possible hazards such as dropped anchor, dragged anchor, ship sinking and dropped object which could cause damage to pipelines should be identified based on the available information regarding activities in the area, hazard identification should systematically identify all external accidental scenarios and possible consequences. For mobilization and dropping anchor at the determined point, the anchor mobilized by using AHTS (Anchor Handling Tug Supply). There are three scenarios of AHTS speed, 2.5; 5.0; 7.5 knots during the mobilization of anchors given in this study. While the duration of hot tapping process related to the duration of the crane barge is in the area where the pipeline located is 10; 20; 30 days. The identification of hazards that could potentially be given to the pipeline by barge used during the installation process as shown in Table 1.
Acceptance Criteria
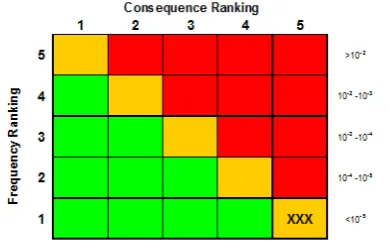
The risk level is determined by combining the probability of the event and the consequence of the event. DNV-RP-F107 “Risk Assessment of Pipeline Protection” [8] is adopted as an assessment protocol to determine the risk level of risk events for dropped object, and ship sinking. This protocol uses a 5 x 5 risk matrix to determine a risk level as it is shown in Figure. Table 2 and Table 3 show the annual frequency criteria and consequence criteria excerpted from DNV-RP-F107 [11].
Frequency Analysis
In calculating the frequency analysis of identified hazard, event tree analysis is utilized to develop the frequency model. A join probability model is applied to the event tree analysis. The probability of an event (hazard) is a multiplication of probability of each hazard sequence.
1) Frequency of Dropped Anchor
Dropped anchor might happen as a result of anchor handling crane barge brought by AHTS towards the mooring point but due to negligence, anchor drops in the area where the pipeline facilities are located.
The frequency of dropped anchor 𝐹𝑑𝑎 based on the calculation of the joint probability concept is following:
𝐹𝐷𝐴 = 𝑁 × 𝑃1× 𝑃2× 𝑃3 (6)
Where N is the frequency of ships passing in the pipeline area during the installation process. While P1,
P2, and P3 respectively are the probability of losing
control of the ship, losing engine or steering, probabiliy of the ship will drop the anchor in an emergency, and the conditional probability that dropped anchor will be at CADZ area.
2) Frequency of Dragged Anchor
𝐹𝑑𝑟𝑎𝑔 = 𝑁 × 𝑃1 × 𝑃2 × 𝑃3 (7) Where N is the frequency of ships crossing the pipeline area. As for the probability P1, P2, and P3 respectively
are the probability of emergency condition (losing control = 2x10⁻⁵), probability of dropped anchor in an
emergency, and the conditional probability dropped anchors are Critical Areas in Drag Anchor Zone (CADRZ ). CADRZ value is obtained from distance drag anchor until it reaches the holding capacity. DNV-RP-E301 recommend drag distance is 5 to 10 times the depth of penetration of the anchor [12].
3) Frequency of Ship Sinking Where N is the frequency of ships crossing the pipeline area. While each P1, P2, P3, P4, and P5 are probability of obtained from twice the length of the ship.
4) Frequency of Dropped Object
The objects that could potentially drop and hit the pipe is hot-tap while installation. Pattern of dropped object is highly dependent on the weight of the object and the depth of the water. Object excursions on the seabed assumed as normal distribution with a deviation angle illustrated in Figure.
Hit probabilities in each ring is calculated using the deviation angles and different depths. After obtaining the probability of each ring then calculate the frequency of dropped object with the formula below [11]:
𝐹𝐷𝑂 = 𝑁 × 𝑃1× 𝑃2 (9)
FDO is an annual frequency of dropped objects, N is the
number of lifting. P1 is the probability dropped objects
every lifting. The value that recommended by DNV-RP-F107 is a 2.2 x 10⁻⁵ and P
2 is probability an object drop
in each ring such as that each ring is illustrated in Figure. Consequence Analysis
For consequence analysis, it is assumed that two types of vessel will be utilized during the period, tugboat provides a consistent summary of generally accepted practice.
Impact damage is based on an energy balance approach where the available kinetic energy from an impacting object is compared to the energy required to produce a dent. The dent size, expressed as a percentage of overall the pipeline diameter, is an indication as the likelihood of a leak or rupture. The relationship is expressed
mathematically as follows [11]:
deformation (dent depth) and t is pipeline wall thickness. The impact capacity of concrete coating is calculated according to [11]:
𝐸 = 𝑌 ∙ 𝑏 ∙ ℎ ∙ 𝑥0 (11)
Where Y is crushing strength of concrete (3 x 42 = 126 Mpa), b x h describe the area of impacting object and xo
is impacting depth, i.e. concrete coating thickness. To calculate the energy impact of the anchor to the pipeline, this below equation can be applied [11]:
(𝑚 − 𝑉) × 𝜌𝑤𝑎𝑡𝑒𝑟× 𝑔 = 12× 𝜌𝑤𝑎𝑡𝑒𝑟× 𝐶𝐷× 𝐴 × 𝑣𝑇2 (12)
Where m is object weight (kg), g is gravity (9.81 m/s2),
V object volume (m3),
water is seawater density (1025
kg/m3), C
D is object drag coefficient, A is projected area
(m2) and v
T is object drop velocity (m/s).
According to DNV-RP-F107, the drag coefficient is shown in Table 4. For the consequence calculation, value of 1.0 is used for drag coefficient as recommended by DNV-RP-F107.
drag coefficient of added mass
.
The kinetic energy of dropped object at terminal velocity is expressed by the following formula [11]:
𝐸𝑇 = 12× 𝑚 × 𝑣𝑇2 (15)
The source of this risk is trawling activities in a certain pipeline zone. The cause of the risk is fishing ship drop trawl and perform bottom trawling in the vicinity of the pipeline zone. It is a possibility that trawl door will penetrate the pipeline trench. When this is happened, it is also a possibility that the trawl door will pull over/hook the pipeline (Figure).
Two standards are the main reference of the consequence assessment of the pipeline due to anchor drag. Those standards are RP-E301 [9] and DNV-RP-E302[13].
The friction force of the trawl line to top of seabed can be calculated as below [11]:
∆𝑅𝑓𝑟𝑖𝑐= 𝜇 × 𝑊𝐼′ × 𝐿𝑠 (17)
Where Ls is the length of line tension, 𝑊𝐼′ weight of trawl per unit length and µ is friction coefficient.
3) Ship Sinking Consequence Assessment
The Journal for Technology and Science, Vol. 26, No. 2, August 2016
Considering the length of the vessel, it is assumed that the vessel will sink relatively slowly in the horizontal position and settle relatively gently onto the seabed and/or pipeline. Hence the load from the sinking vessel is considered to be a quasi-static load governed by its submerged weight. A Dynamic Amplification Factor (DAF) of t.2 is applied to account for moderate dynamic effects. The vessel DWT is used in calculations and is a conservative estimate of submerged weight. It is also assured that there are no air pockets in the sunken vessel. To determine whether the load imposed by a sinking vessel is acceptable to the pipe, it is necessary to establish the static capacity of the pipeline subjected to a point load at 12 o'clock for an exposed pipeline; and line load for a buried pipeline.
Considering the pipe section as a two dimensional ring, then the maximum bending moment as [11]:
𝑀𝑙𝑜𝑎𝑑=
(
𝑃 × 𝑅)
⁄
𝜋 (18)Where R is radius of pipe and P is the pressure load. Considering the maximum capacity of the pipe to be given as a fully plasticized wall (i.e. its plastic moment capacity), one gets [11]:
𝑀𝑐𝑎𝑝𝑎𝑐𝑖𝑡𝑦= 0.25 × 𝑆𝑀𝑌𝑆 × 𝑡2 (19)
IV. RESULT
Result of Mooring Analysis
Based on the result of mooring analysis above, the safe distance between mooring chain and pipeline can be obtained. The result is illustrated in Figure 5.
As shown in Figure 5, the depth of waters where the hot tapping to be performed is about 80 m. Based on the design of planned mooring, the fell nearest point of mooring line (a touch down) against the existing pipe is 150 m while the vertical distance between mooring line to the pipe is 62.7 m. This composition and condition of the soil at the location of pipeline are enable to the dragged anchor of this crane barge.
Result of Risk Assessment due to Dropped Object, and Ship Sinking During Hot Tapping
1) Frequency Analysis
This scenario represents the scenario of incidents due to barge and tugboat that operates during hot tapping period. The frequency of hazard in this scenario is considered to be the hazard to the pipeline.
Table 5 shows the vessel groups and hot tap machine during hot tapping (construction) and Table 6 presents the objects. It is assumed that two vessel classes will be utilized for the hot tapping activity. Those vessels are tugboat having size of 630 DWT (2 units), and barge having size of 8000 DWT (2 units).
For this scenario of frequency analysis, several assumptions are set.
1. Probability of object dropped due to wire rope fracture is 5.00E-06 [14]
2. Probability of vessel sinking during operation 3.00E-04 [15]
3. Working time per day is 8 hours
4. Length of object (hot tap machine) is 2.74 meters. Several potential hazards are considered here, hazard due to drop object (hot tap machine), and ship sinking (tugboat or barge). During hot tapping, barge will be
positioned by 4 anchors having weight of 3.78 tons dropped at a distance of 150 meters from the pipeline resulted vertical distance between pipeline and anchor chain is 62.7 m. The safe or minimum vertical distance between anchor chain and pipeline is 15 m.
a. Frequency of Ship Sinking
To calculate the frequency of ship sinking, a join probability concept is also applied. The crane barge may sink on the pipeline if the vessel that operated in position above the pipeline (CSZ) losing her navigational control AND sink after missing her stability.
Table 7 shows the summary of frequency analysis due to crane barge/ ship sinking operation during hot tap and hit the pipeline for the worst condition of scenario: 0.5% of vessel sinking probability.
b. Frequency of Dropped Object
To calculate the frequency of dropped object, a joint probability concept is applied. The object will hit the pipeline if the vessel is crossing the pipeline AND the vessel is dropping object due to wire rope rupture. AND the object is dropped in the critical object damage zone (CODZ). Should one event is not occur, then the hazard to the pipeline of being dropped object is not possible.
Table 8 shows the summary of frequency analysis due to drop object on the pipeline. As shown, for all scenarios of hot tapping period, frequency of hazard are in the first ranking of frequency according to DNV-RP-F107.
2) Consequence Analysis
It is assumed that two types of vessel will be utilized during the period, tugboat having size of 630 DWT and barge with size of 8000 DWT. Those two type of vessels correspondence to an anchor having weight of 480 Kg and 3780 Kg consecutively.
For consequence analysis, the risks due to ship sinking caused by the tugboat as well as the barge to pipeline are observed. Table 9 shows the consequence due to ship sinking will be more than 20% (ranking 5). Not only the consequence due to ship sinking, but also for dropped object in ranking 5.
3) Risk Matrix
During the period of hot tapping, it is assumed that one utility barge of 8000 DWT and two tugboats of 630 GT (2 x 1000 HP) are operated. Three scenarios of frequency were made (based on 10, 20, and 30 days of hot tapping period). Given the scenarios, risks category due to ship sinking (barge and tugboat) and risk due to drop object (hot tap machine) are still in ALARP as shown in Figure 7 and Figure 8.
CONCLUSION AND MITIGATIONS
There are two conclusions in this study:
1. Mooring chain analysis can be used as a reference for positioning the mooring point of crane barge. The safe mooring distance is affected by distance between connection point at vessel, subsea fasilities and dropping object. By developing the scenario of risk assessment according to the positioning mooring point of crane barge, it affects the potential risk to pipeline damage such as number of ships crossing the pipeline area.
a. Hazard due to dropped object of ships is in the ALARP region.
b. Hazard due to ship sinking is ALARP.
c. A risk assessment for the proposed hot tap operation was undertaken. Four ‘medium’ risk incidents were identified.
d. In any case, additional risk reduction measures were identified to minimize the risk of the incidents related to the hazards. Based on this risk assessment and given the track record successful subsea hot-tap operations worldwide, we considered that a hot tap operation can be undertaken with an acceptable level of safety, provided the appropriate safeguards and management systems are in place.
e. Some recommendations can be delivered such as: the risk of hot tapping installation into existing 28” pipeline due to dropped object as well as ship sinking is ALARP. The company must be able to maintain the level of frequency and consequence during installation through efforts in ensuring that all installation procedures is strictly enroled and applied.
REFERENCE
[1] A. Tajuddin, "Safety Notes," Health Safety Environment Educational Notes (As per KNPC HSE SWP)," Tie-In And Hot Tapping, 13 March 2016. [Online]. Available: http://www.safetynotes.tk/2016/03/tie-in-and-hot-tapping.html. [Accessed 19 August 2016].
[2] J. A. McElligott, J. Delanty and B. Delanty, "Use of Hot Taps for Gas Pipelines can e Expanded," Oil and Gas Journal, vol. 96, no. 48, p. 66, 1998.
[3] K. B. Artana, A. Dinariyana, I. Ariana and K. Sambodho, Penilaian Risiko Pipa Gas Bawah Laut, Surabaya: Guna widya, 2013.
[4] K. Artana, D. W. Handani, K. Sambodho and E. Pratiwi, "Risiko Pipa Gas Bawah Laut Akibat Pembangunan dan Operasional Dermaga," in Conference of Badan Inovasi Bisnis dan Ventura (BIBV) ITS, Surabaya, 2015.
[5] K. Artana , "Risk Assessment of 14” Subsea Gas Pipeline Due to the Development of Jetty at Gresik," 2015.
[6] K. Artana, "Penilaian Resiko Pipa Gas Bawah Laut Ujung Pangkah-Gresik dengan Standard DNV RP F107," Jurnal Teknik Mesin, vol. 9, no. 1, pp. 28-42, 2009.
[7] Y. Liu, H. Hu and D. Zhang, "Probability Analysis of Damage to Offshore Pipeline by Ship Factors," Transportation Research Record: Journal of the Transportation Research Board, vol. 2326, pp. 24-31, 2013.
[8] D. D. Putranta, P. D. Setyorini, A. A. Masroeri and D. S. Antara, "Penilaian Risiko Pipa dan Kabel Bawah Laut Akibat Penggunaan Mooring Vessel pada Proses Pemasangan Tie-In Spool," in Proceeding of Seminar Nasional Kelautan X, Univ. Hang Tuah, Surabaya, 2015.
[9] S. Chakrabarti, Handbook of Offshore Engineering, London:
Elsevier’s Science, 2005.
[10] DET NORSKE VERITAS, DNV-RP-F107, Risk Assessment of Pipeline Protection, Norway: Det Norske Veritas, 2010
[11] DET NORSKE VERITAS, DNV-OS-E301, Position Mooring, Norway: Det Norske Veritas, 2004.
[12] DET NORSKE VERITAS, DNV-OS-E302, Offshore Mooring Chain, Norway,: Det Norske Veritas, 2009.
[13] Lloyd, Lloyd’s Casualty Data Register based in the UK, Referred from, HESS Project in Pipeline Protection Risk Assessment. [14] S. Kristiansen, Maritime Transportation – Safety Management
and Risk Analysis, Elsevier,, Oxford: Elsevier Butterworth-Heinemann, 2005.
Figure 1. Scheme of mooring chain
Figure 2. Risk matrix according to DNV-RP-F107
Figure 3. Normal distribution with a deviation angle illustrated [11] Figure 4. Probability of hit within a ring [11]
The Journal for Technology and Science, Vol. 26, No. 2, August 2016
Figure 7. Risk Matrix due to ship sinking of barge and tugboat during hot tapping
Figure 8. Risk Matrix due to dropped object during hot tapping
TABLE 1.HAZARD COMPATIBILITY
Threat Description
Mobilization Installation
Vessel Speed (knot) Duration (Days)
2,5 5,0 7,5 10 20 30
Dropped anchor
- Tug boat √ √ √ √ √ √
- Crane Barge √ √ √ N/A N/A N/A
Dragged anchor
- Tug boat √ √ √ √ √ √
- Crane Barge N/A N/A N/A N/A N/A N/A
Vessel sinking
- Tug boat √ √ √ √ √ √
- Crane Barge √ √ √ √ √ √
Dropped object N/A N/A N/A √ √ √
TABLE 2. FREQUENCY RANKING ACCORDING TO DNV-RP-F107[11]
Ranking Description Annual Frequency
1 So low frequency that event considered negligible <10-5
2 Event rarely expected to occur 10-4 >10-5
3
Event individually not expected to happen, but when summarized over a large number of pipelines have the credibility to happen once a year
10-3 >10-4
4 Event individually may be expected to occur during the lifetime of
the pipeline (Typically a 100 yr storm) 10
-2 > 10-3
5 Event individually may be expected to occur more than once during
lifetime >10
-2
TABLE 3.FREQUENCY RANKING ACCORDING TO DNV-RP-F107[11]
Ranking Dent/ Diameter (%)
Impact
Energy Damage description
Conditional Probability
D1 D2 D3 R0 R1 R2
1 < 5 EE Minor damage 1 0 0 1 0 0
2 5 - 10 EE
Major damage
0.1 0.8 0.1 0.9 0.1 0
Leakage anticipated
3 10 - 15 EE
Major damage
0 0.75 0.25 0.75 0.2 0.05 Leakage and rupture
anticipated
4 15 - 20 EE
Major damage
0 0.25 0.75 0.25 0.5 0.25 Leakage and rupture
anticipated
5 > 20 EE Rupture 0 0.1 0.9 0.1 0.2 0.7
TABLE 4.DRAG COEFFICIENT [11]
Cat. No Description CD CA
1,2,3 Slender shape 0.7 – 1.5 0.1 – 1.0
4,5,6,7 Box shape 1.2 – 1.3 0.6 – 1.5
TABLE 5.VESSELS AND HOT TAP MACHINE UTILIZED DURING HOT TAPPING
Vessel Type DWT Anchor Weight
Anchor Width
Dimension Number of
Vessels
L B T
Tug Boat 630 480 1.00 36.00 9.00 3.50 2
Barge 8000 3780 2.01 90.24 28.8 5.76 1
TABLE 6.OBJECTS
Object Group Object Weight (kg) Object Width (m) Object Breadth (m)
Hot Tap Machine 4643 2.74 0.36
TABLE 7.SUMMARY OF FREQUENCY ANALYSIS OF SHIP SINKING DURING HOT TAPPING FOR WORST CASE SCENARIO
(PROBABILITY OF SHIP SINKING:5%)
DURATION OF HOT TAPPING: 10 DAYS
SHIPS GROUP A B A+B
Total duration vessel in CSZ during construction (s) 288000 288000 864000
Annual probability of vessel in CSZ will sink 3.95E-10 4.93E-10 1.48E-09
FREQUENCY RANKING 1 1 1
DURATION OF HOT TAPPING: 20 DAYS
SHIPS GROUP A B A+B
Total duration vessel in CSZ during construction (s) 576000 576000 1728000
Annual probability of vessel in CSZ will sink 7.89E-10 9.86E-10 2.96E-09
FREQUENCY RANKING 1 1 1
DURATION OF HOT TAPPING: 30 DAYS
SHIPS GROUP A B A+B
Total duration vessel in CSZ during construction (s) 864000 864000 2592000
Annual probability of vessel in CSZ will sink 1.18E-10 1.48E-10 4.44E-09
FREQUENCY RANKING 1 1 1
TABLE 8.SUMMARY OF FREQUENCY OF HAZARD DUE TO DROPPED OBJECT FOR WORST CASE
SHIPS GROUP DURATION OF HOT TAPPING: 20 DAYS
A B A+B
Total duration vessel in CSZ during construction (s) 288000 576000 864000
Annual probability of Crane Barge in CODZ, unintentionally dropping object and
hit the pipeline 1.48E-09 2.96E-09 4.44E-09
FREQUENCY RANKING 1 1 1
TABLE 9.SUMMARY OF CONSEQUENCE OF HAZARD DUE TO ALL POTENTIAL HAZARDS
SHIP SINKING
Vessel group A B
Effective impact energy to speel pipeline (KJ) 5480 59496
Denting/ Diameter 100% 100%
Consequence Ranking 5 5
DROPPED OBJECT
Object Group Hot Tap Machine
Effective Impact Energy to Steel Pipeline 203.73