121 System Dynamics Modeling for E-Goverment Implementation:
A Case Study in Bandung City, Indonesia
Farah Alfanur, Takeshi Arai, Utomo Sarjono Putro
146
Analysis on Indonesia Strategic Framework to Face Asean 5 in
Asean Free Trade Area (AFTA) 2015
Deddy P. Koesrindartoto, Barli Suryanta
167
Strategi Operasi Industri Kecil yang Berkeunggulan Kompetitif:
Kasus Pengusaha Sepatu Sentra Industri Kecil Cibaduyut Bandung
Widjajani, Gatot Yudoko
177
Influence of Word of Mouth Communication Towards Indonesian
Online Shopper Purchase Intention
Mustika Sufiati Purwanegara, Eka Yuliana
198 Predifining Emotion Throught Product Design
Theresia Reni, Herry Hudrasyah
212
Model Grafik dengan Rating Multi Atribut (GMMR) dalam Resolusi
Konflik Trans Metro Bandung
Dini Turipanam Alamanda, Utomo Sarjono Putro, Pri Hermawan, Dhanan Sarwo Utomo
226 Pengaruh Dimensi Etika terhadap Sikap Konsumen pada Viral
Stealth Marketing
A. Dian Sri Rezeki Natsir, Mustika Sufiati Purwanegara
Farah Alfanur
Master of Science in Management, School of Business and Management Institut Teknologi Bandung
Takeshi Arai
Department of Industrial Administration, Faculty of Science and Technology, Tokyo University of Science
Utomo Sarjono Putro
School of Business and Management Institut Teknologi Bandung
Indonesian Journal for the Science of Management
Volume 9 Number 2 2010
Terakreditasi “B” berdasarkan Keputusan Direktur Jenderal Pendidikan Tinggi, Departemen Pendidikan Nasional
Nomor: 65a/DIKTI/Kep/2008, Tanggal: 15 Desember 2008. Masa berlaku, Oktober 2008 s.d. Oktober 2011.
System Dynamic Modelling for
E-Goverment Implementation: A Case
Study In Bandung City, Indonesia
Abstract
Governments around the world have developed e-Government programs hoping to obtain great benefits. However, many e-Government projects have failed to deliver their promises. Some of such failures are thought to be the results of lack of understanding about the relationships among 'technologies', 'information use', 'organizational factors', 'social contexts involved in the selection, implementation and use of information and communication technologies (ICT)'. These factors stated above might have produced mismatches and unintended consequences. This research draws on not a few precedent studies as to those factors, and the case of the e-Government program in Bandung municipality, Indonesia, is assumed as a typical example of municipalities in developing nations. In this study, a simulation tool which helps to find the best way to create the efficient and useful e-Government is presented. In particular, the model, which is the core of the simulation tool, takes not only the supply side perspective which describes the mechanism of creating and operating the e-Government system but also the demand side perspective which explains the people's intention of communicating with the
e-Government and their behaviors toward it. The simulation tool is constructed based onSystem
Dynamics as an integrated and comprehensive approach to understand the e-Government and its use. Because of lack of suitable statistical data, simulations were carried out by using subjectively estimated but plausible values of parameters after the sensitivity analysis. From the results of simulations, very complicated trade-off relationships among the allocated project budgets to different types of programs were suggested.
1. Introduction
1.1. E-government Problem in Indonesia
Based on World Bank definition, e-government refers to the use by government agencies of information technologies (such as Wide Area Networks, the Internet, and mobile computing) that have the ability to transform relations with citizens, businesses, and other arms of government (www.worldbank.org).
In summary, the purpose of e-government implementation is to create online customers instead of in-line customers. E-government delivers services without public institution official's intervention and long queue system just to meet a simple service. In addition, e-government has a role in supporting good governance. The use of technology which facilitates citizens to access information can reduce suspicions of their government by increasing the public institution's transparency and accountability.
E-government can also escalate public participation where citizens being able to be involved in the-government decision making activity. And hopefully e-the-government will improve bureaucratic productivity and efficiency and increase economic development.
E-government has been recognized as a powerful strategy for the government transformation. In recent years, governments around the world have developed e-government programs hoping to obtain important benefits such as cost savings, effective and efficient time, improved service quality, increased accountability, and more public participation among others. However, many e-government projects failed to deliver their promises. Some of such failures are the results of lack of understanding about the relationships among technologies, information use, organizational factors, and social contexts involved in the selection, implementation, and use of information and communication technologies (ICT).
The transition from traditional government to e-government is one of public policy issues in this moment. Initiative to applied e-government in Indonesia begins in 2003. E-government initiative in Indonesia has
th
been introduced through President Instruction No. 6/2001 in 24 April 2001 about Telematics (Telecommunication, Media and Information) which explained that government institution should use telematics technology to support good governance and accelerate democratic process.
E-government has been recognized as a catalyst or tool for the-government administrative reform. Scholars suggest information technologies have the potential not only to improve the quality of services, but also to produce cost savings and to make-government policies and programs more effective. However, it is estimated that the failure rate of e-government projects may be as high as 85%.
Therefore, despite the possibilities of e-government, scholars and practitioners argue information technology (IT) in general, and e-government in particular, have not accomplished the promise of a more efficient, effective, and democratic public administration. This is a clear indication that research on e-government is not addressing some important factors.
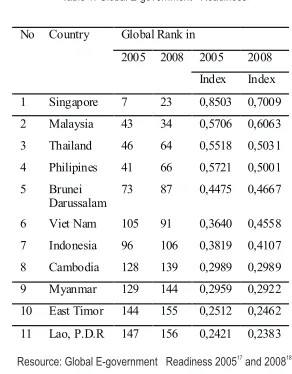
However, e-government development is not significant enough. From e-government Readiness, Indonesia has low ranking among Southeast Asia countries moreover in global e-government readiness. Indonesia rank position in e-government Readiness in south Asia is described in table 1.
No Country Global Rank in
Table 1. Global E-government Readiness
17 18
Resource: Global E-government Readiness 2005 and 2008
Indonesia among south Asian countries is ordered in the seventh position under Brunei Darussalam and Vietnam. In global area, Indonesia is in 85 rank in 2004, and rank 96 in 2005 and in the present has rank 106. The Economist Intelligence Unit (EIU) has published an annual e-readiness ranking of the world's largest economies since 2000. The ranking evaluates the technological, economic, political and social assets of 68 countries and their cumulative impact on their respective information economies.
The e-readiness ranking is a weighted collection of nearly 100 quantitative and qualitative criteria, organized into six distinct categories measuring the various components of a country's social, political, economic and of course technological development. The underlying principle behind the ranking is that digital business is at its heart business\, and that for digital transactions to be widely adopted and efficient they have to thrive in a holistically supportive environment. E-readiness is not simply a matter of the number of computers, broadband connections and mobile phones in the country (although these naturally form a core component (Javadi & Gharakhani, 2006). Mathematically, the e-readiness score is a weighted average between six distinct different categories which scaled from zero to ten. These are, in turn, weighted according to their assumed importance as influencing factors. Major data sources include the Economist Intelligence Unit, Pyramid Research, the World Bank and The World Information Technology and Services Alliance (WITSA), among others (EIU, 2003-2006).
The task was to determine the current condition and factors of e-government adoption so that the city government could consider an e-government strategic plan around a clear understanding of both what is feasible policy and what is commonly attained for the next few years. These task will be done by using system dynamic simulation with the STELLA software.
1.2 Research Question and Purpose of the Research
This research will answers these research questions:
1. What are the factors constitutes the leading edge of e-government adoption in Bandung city?
2. What kinds of government policies that can make e-government implementation are more effective, efficient, better and feasible for Bandung city?
While the purposes of this research are :
1. Studying and investigating the factors of the e-government adoption and implementation. 2. Create simulation model for e-government adoption problem based on its factors.
3. Determine a trade-off relationships among the allocated project budgets to different types of programs in 2010 until 2025 to maximize the number of e-government adoption.
2 Methods
Firstly the author conducted the interviews with the leaders and several staff from the unit for Communications and Information Technology of Bandung city government (BAKOMINFO). Based on the results of interviews, the author decided to make a conceptual model which explains the mechanism of people's adoption of e-government from supply and demand side perspectives that are derived from literature review. Secondly, the author made a simulation model and determined data and parameter setting to see the behavior of the model. The objective of this research after analyze causal relationship between e-government factors is to make a relationships among the allocated project budgets to different types of programs.
2 1 Result of Interview with Bandung City Government
Factors that influence e-government implementation are : 1)ICT adaptation from government's staff office. 2)The government systems. 3)Technology. The main challenges of the use of ICT in government system (E-government) are the capability and management readiness from all stakeholder.
E-Government in Bandung still in one way communication . Citizen, they can follow the changes of government system through e-government until now. But often, they are more likely to meet the government or public services staff directly by face to face for their services ( i.e. tax payment, etc). They want to get a complete and accurate information or services which accordance with their needs. Also they expected the technology easy to use, usefulness, and very fast to access. But usually the information that provided by the government are not complete and accurate enough. Besides bandwidthcondition in Bandung is inadequate.
Bandung municipality government consists of multiple units, which each must provide information about its function. The main problem is units are very rare to update the information. Several reasons : 1)Culture to make a documentation is still not usual for them (Indonesian people). 2)Culture of sharing informations (stingy).
However, they got 3 awards based on 1)concern in science and technology, 2)feature, design, the number of pdf file, and the number of visitors, 3) favorit features such as Public transportation route, Tourism map and provide 2 languange (English : for entrepreneur/investor, foreign students, and tourist. Indonesia: for citizen and domestic students).
3 Conceptual Model
This paper initiate discussion of e-government adoption issue by proposing a basic conceptual model of e-government adoption that analyzes from demand side perspective that places users as the focal point for e-government adoption strategy and supply side perspective which is derived from surveys of e-government offerings by the-government. In this chapter, the author makes a conceptual model on the basis of literature review that has been collected and by the use of the concept of system dynamics. The author has collected factors that influence the rate of adoption of e-government from the various literature reviews and then make a causal relationship between these factors.
The model for simulation which based on the conceptual model are also discussed in this paper. The simulation is made using STELLA software.
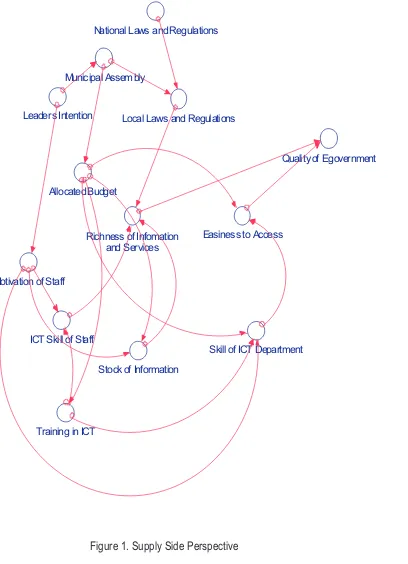
3 1 The Supply Side Perspective
Similarly to the website of a private company, the attractiveness and usefulness of that of a city to the people living both within and outside the city are dependent on the richness of information and services provided at its website and the easiness to access the targeted information and services (Takeshi Arai, 1999).About the richness of information and services provided, (Kaylor, 2001) presents a list of functional dimensions across which their study assesses e-government implementation among U.S. and assesses the degree to which functions and services are web-enabled using a four-points, namely, 1) information about a given topic exists at the website, 2) link to relevant contact (either a phone number or email address) exists at the website, 3) downloadable forms available online on a given topic, 4) transaction or other interaction can take place completely online.
The stage of each function primarily depends on national and local legal restrictions, the ICT skills of local government officials and the stock of information. In addition, the latter two factors primarily depend on the allocated budget to improve its web-enabled stage.
Leaders Intention Municipal Assembly
Local Laws and Regulations National Laws and Regulations
Richness of Infomation and Services
Easiness to Access
ICT Skill of Staff
Stock of Information Motivation of Staff
Training in ICT Allocated Budget
Skill of ICT Department
Quality of Egovernment
Figure 1. Supply Side Perspective
Quality of e-government is based on two factors such as the richness of information and services and the easiness to access. The richness of information and services are influenced by the ICT skill of staff, stock of information, local laws and regulations. If the ICT skill of staff is higher, they will have more ability to seek many information from various sources and put it into the website. If there are many stock of information to be provided in the website, it would make the information on the website become rich.
Another supporting literature of supply side analysis was done by (Solomon, 2008) that analyses municipal e-government in Kebele, Egypt. This author presents below the key driving factors that need to be addressed at city administration level.
He has observed that these factors are addressable given the existing initiatives of the city government for capacity building:
Availability of trained personnel : as stated by residents who participated in filling questionnaire, ten to employ adequately manpower is a factor for an effective service delivery and a need for creating a human resource that can adopt itself to new technologies for effectively executing tasks.
Adequate skill of staff on use of ICT : Either employment should require this skill or employees need to be trained on use of computers.
3) ICT Infrastructure: It is observed that there is little ICT infrastructure at Kebele level. Since infrastructures such as access to internet, adequate number of fixed.
4) telephone lines, Local Area Network, and local telephone communication network are key factors for e-local governance applications, means should be found to acquire them.
5) Creation of up-to-date and reliable basic data on residents: It is observed that many of the residents' data is not up-to-date and there is no effective mechanism to acquire reliable, correct and recent information. Since any information that is not correct will lead to a wrong decision-making, creating mechanisms to gather up-to-date information on residents is a key factor. Hence means should be found to continually update changes on residents and on any other data that Kebeles depend on for their day-to-day activities.
3 2 The Demand Side Perspective
One demand side perspective is study of citizen interaction with e-government. The results of some research reveal that citizens access governmental Web sites more often to obtain information than to transact. In addition, more experienced users were more likely to visit government Web sites for information and to complete transactions. This demand side trying to determine the key factors that influence citizen interaction with electronic government (Reddick, 2005). The main rationale of e-government initiatives is to put together services focused on citizen's needs.
This study is also use one leading model Technology Acceptance Model (TAM) in order to explain user's intention to adopt and continue to make use of the e-government. The model goes beyond the demographic classification of adopters to explain two important psychological dimensions that influences the adoption process that is Perceived Usefulness (PU) and Ease of Use (EOU). Perceived Usefulness (PU) is defined as “the extent to which a person believes that the technology, under investigation, will enhance his/her productivity or job performance” (Davis, 1989). EOU is defined as “the extent to which a person believes that using a technology will be simple” (Davis, 1989).
The TAM model hypothesizes the following: the higher the perceived usefulness of the new technology, the more likely it is to be adopted by its consumer. This proposition points to the decisions that to adopt a new technology service (e.g. electronic government) is based on a subjective perception on the part of the user (Mahadeo, 2009).
Figure 2 captures the key factors that influence e-government adoption from the demand side perspective. Detailed explanation from this demand side model can be seen in figure 3-7.
3 3 New Product Diffusion
New product diffusion is a widely researched issue (for example Rogers 2003) and many new product diffusion models exist in the literature, however one of the most well known and widely used is the Bass model. The Bass diffusion model assumes that adoption for a product stems from two main sources; innovators who adopt the product due to external sources of awareness, usually interpreted as the effect of advertising and from imitators who adopt the product as a result of contact with previous adopters i.e. from word-of-mouth (Bass, 1969). This Bass diffusion model is related and will be included in demand side perspective that will present below in model construct.
percevedusefulness
Figure 3 explains about civic mindedness. Civic Mindedness is citizens that more engaged in civic affairs. Typically, those citizens are likely to have the following characteristics: socially engaged, politically active, and paying close attention to the news media.
Figure 3. Civic Mindedness
This stock and flow of civic mindedness is a first step of all process in demand side perspective. If there is some citizen who has a civic mindedness, then the process of adoption in demand side perspective will occur.
The rates of civic mindedness have significant influence to the rate of e-government adoption (potential rate). Potential rate of adoption is depends on the cultural and facilitating conditions. The number of people who have the civic mindedness can be increased and decreased.
percevedusefulness
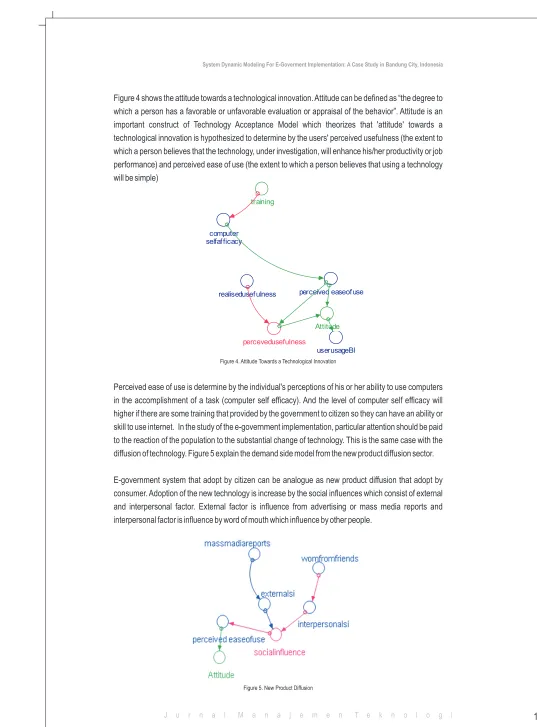
Figure 4 shows the attitude towards a technological innovation. Attitude can be defined as “the degree to which a person has a favorable or unfavorable evaluation or appraisal of the behavior”. Attitude is an important construct of Technology Acceptance Model which theorizes that 'attitude' towards a technological innovation is hypothesized to determine by the users' perceived usefulness (the extent to which a person believes that the technology, under investigation, will enhance his/her productivity or job performance) and perceived ease of use (the extent to which a person believes that using a technology will be simple)
Figure 4. Attitude Towards a Technological Innovation
Perceived ease of use is determine by the individual's perceptions of his or her ability to use computers in the accomplishment of a task (computer self efficacy). And the level of computer self efficacy will higher if there are some training that provided by the government to citizen so they can have an ability or skill to use internet. In the study of the e-government implementation, particular attention should be paid to the reaction of the population to the substantial change of technology. This is the same case with the diffusion of technology. Figure 5 explain the demand side model from the new product diffusion sector.
E-government system that adopt by citizen can be analogue as new product diffusion that adopt by consumer. Adoption of the new technology is increase by the social influences which consist of external and interpersonal factor. External factor is influence from advertising or mass media reports and interpersonal factor is influence by word of mouth which influence by other people.
Because the influence from their society (social influence), it will make the people feel the e-government is easy to use (perceived ease of use). The higher social influence, the more people will feel that government system is easy to use. Social influences are related to a person's attitude towards e-government services.
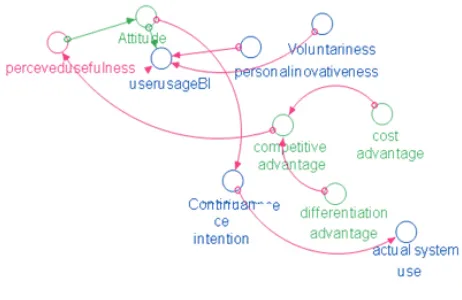
The continuance intention to use e-government is influence by the strength of the prospective user's intention to make or to support the adoption of e-government innovation (user usage BI) and the actual system use. The continuance intention sector can be seen in figure 6. Since perceived usefulness is considered the most significant factor, government should continue developing the websites which possess a competitive advantage (i.e. cost advantage and differentiation advantage) over the traditional way of services and publicize this advantage to the public. The citizen's understanding of these benefits will increase their intention to continue using e-government websites.
Figure 6. Continuance Intention to E-government Adoption
The user usage BI depends on the degree to which the use of the innovation is perceived to be voluntary or of free will (voluntariness) and personalinovativeness. Personal innovativeness in using IT is a trait reflecting a willingness to try out any new technology. Innovations create uncertainty about their expected consequences, and individuals who are uncomfortable with uncertainty will tend to interact with their social network before making a decision. Overall, using an innovation is seen as a form of public consumption; it can be significantly influenced by friends and colleagues.
Attitude toward adopting the technology has a direct and positive effect on behavioral intention (BI) to adopt the technology. Attitute towards a technological innovation is hypothesized to be determined by the user perception of the usefulness and ease of used of the system. Figure 7 shows the perception of compatibility in e-government use. Compatibility is “the degree to which an innovation is perceived as consistent with the existing values, past experience, and needs of potential adopters”. As the user's utilization of the target technology deepens, the compatibility will gradually change influencing in complex interaction with both perceived usefulness and ease of use. The degree to which potential adopters are prepared to accept an Information Technology is affected by the way they are accustomed to work. The perception of compatibility of the target technology will have a positive effect on Easy of Use and perceived usefulness.
percevedusefulness
realisedusefulness
userusageBI Attitude perceived easeofuse
userincrease perceptionofcompatibility
Figure 7. The Perception of Compatibility in E-government Use
3 4 Correspondence Between Supply and Demand Side Perspective
Quality of e-Government in supply side perspective has a correspondence with the user usage Behavioural Intention (BI) in demand side perspective. Quality of e-Government depend on the user usage BI which user usage BI determine indirectly by perceived usefulness and perceived ease of use.
4 Model for Simulation
After presenting a basic conceptual model from supply and demand side perspective which used the basic theory of causal relationship in system dynamics, the next step is to create what is termed a stock and flow diagram. A stock is the term for any entity that accumulates or depletes over time. A flow is the rate of change in a stock. This stock and flow diagram will be used as a simulation model that will be processed with STELLA software. In this section, the author explores model structure of simulation which divided into five sectors and explain the simulation data and setting of parameter of the simulation.
The causal loop diagram is a valid starting point for the creation of a stock and flow, that is a System Dynamics (SD) model. The main SD “building blocks”, or elements, like stocks/level, flows, rates, auxiliary variables and constants all contribute to build and deeply analyze the context that surrounds the documents elaboration procedures, both inside and outside the e-government system, thus making it possible to formalize quantitatively what we have previously described in the causal map. At the end of the simulation of the model it is immediate and clear. The visualization of these problems which may arise in the long term period, or thesevariables upon which we should insist to make it easier to spread the new technology and switch to the new procedures.
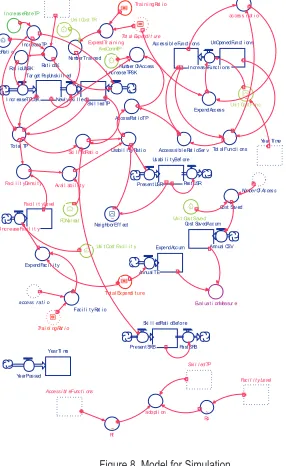
Data and parameters have been determined then the simulation can be run. Simulation model based on two conceptual model of supply and demand side perspective can be seen in figure 8.
Tar get PopUnsk i l l ed
Acc es si bl eFunct i ons UnOpenedFunct i ons
I ncreas eFunc t i ons
ExpendAcc es sUni t Cost Func ~
The author has constructed a model for simulation based on the conceptual model explained in the preceding part. Since the collection of the required data used for estimation of the parameters which may be included in the model was not easy in the case study city in a short period, here the author tried to build a simpler one which is equipped with the essential factors. Because the model is aimed to use as a decision support system in the planning process of the e-government project in Bandung city, in the next chapter how to utilize the simulation model in the city will be demonstrated by setting some plausible situations based on the collected data and the literature reviews by the author.
The simulation model is composed of five sectors (see in figure V.9), namely (1) Target population, (2) Usable facilities, (3) the WOM effect, (4) Municipal government project and (5) Monitoring E-government. Detail structures of all sectors are mentioned next.
Figure 9. Outline of the Model
(1). Target population (skilled and unskilled):
In this sector (see in figure 10), the number of skilled target population and those of unskilled target population are calculated. The growth rate of the target population (IncreaseRateTP) should be set based on some authorized population forecasts. The annual budget allocated for the E-government project (TotalExpenditure) and the percentage of the portion allocated to the people's trainings (TrainingRatio) are policy variables. Here, the author assumes that the percentage of the unskilled among the people who will move in from the outside the city will be a little higher than that of the present target population. Population ratio is 0.8 because of there are some people who will move in from the outside the city and move out from the city. Total expenditure was allocated to training. Training is designed to increase the number of people to have the skill to use internet (skilledTP). The numbers of people that will be trained depends on the allocated budget for training (ExpendTraining) throughout the training costs for each person (UnitCostTR).
Figure 10. Target Population Sect
(2). Usable facilities:
Facility level is the number of facility such as PC that provided by the government to the public for government access. The growth rate of facility level is depends on the allocated budget for e-government facility (ExpendFacility) and cost of each unit facility (UnitCostFacility). The availability of facility is depends on the availability of computers per inhabitants ideally (FDNormal) and the availability of computers per inhabitants in reality (FacilityDensity). The availability of facility will affect the percentage of the portion of usability of e-government system. The higher the availability of facilities, the higher the usable rate of e-government.
(3). The WOM Effect:
Figure 12 shows the word of mouth sector. In this sector, the portion of skilled target population (skilled ratio) in present and before are determine to set the growth rate of the usability before (Usability Before). The portion of skilled target population (skilled ratio) in present is influenced by the ratio of e-government usability (UsabilityRatio). As shown in figure 12, the neighbor's influence (NeighborEffect) by word of mouth is affects the level of usefulness by population. The higher the influence effect from neighbor, the more higher the usability ratio.
Usabi l i t yRat i o
Usabi l i t yBef or e
Pr esent USR Past USR
~ Nei ghbor Ef f ect
Figure 12. WOM Sector
(4). Municipal Government Project:
Municipal government project can be seen in figure 13. In this sector, the numbers of e-government functions that are available and not available currently are identified. The growth rate of the target number of e-government functions should be set based on total allocated budget which makes the access of e-government is available (ExpendAccess) and cost to build and make each unit function (UnitCostFunction). The allocated budget portion to e-government access (AccessRatio) is policy variables which determine and can be controlled by the-government.
Content or function provided on the website so that it can be accessed by the public influence the adoption rate of e-government. It is assumed that the higher the number of functions that can be accessible will increase the number of people to adopt e-government. Function in this case can be a function of the form of information, interaction, or transaction. With the increasing number of these functions, the public will feel that e-government systems is usefulness and in accordance with their needs.
Figure 13.
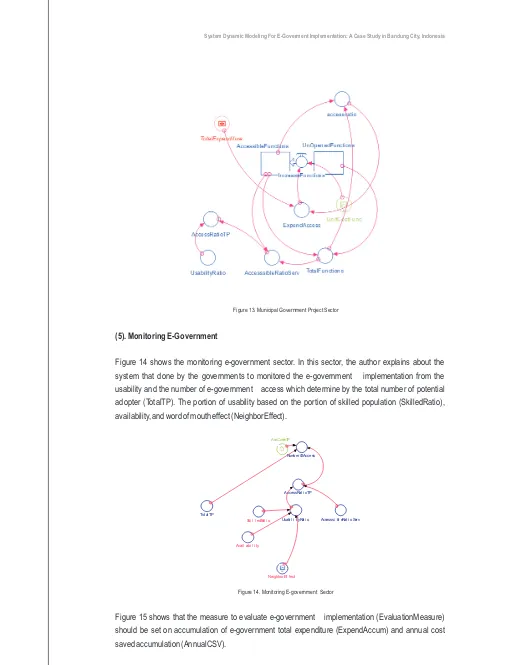
(5). Monitoring E-Government
Figure 14 shows the monitoring e-government sector. In this sector, the author explains about the system that done by the governments to monitored the e-government implementation from the usability and the number of e-government access which determine by the total number of potential adopter (TotalTP). The portion of usability based on the portion of skilled population (SkilledRatio), availability, and word of mouth effect (NeighborEffect).
Municipal Government Project Sector
Tot al TP
AccessRati oTP Number OfAccess AveCommTP
Accesssi bl eRat i oSer v Usabi l i t yRat i o
~ Nei ghbor Ef fect Ski l l edRat i o
Avai l abi l i ty
Figure 14. Monitoring E-government Sector
Tot al Expendi t ur e
Cost Saved
Uni t Cost Saved
Eval uat i onMeasur e ExpendAccum
Annual TE
Cost SavedAccum
Annual CSV
Number Of Access
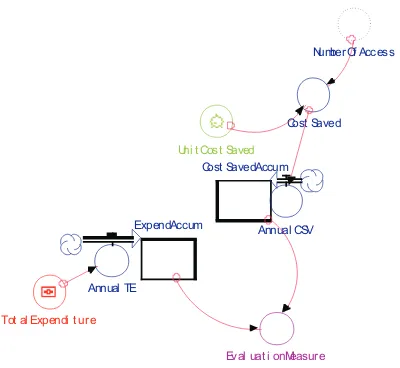
Figure 15. Monitoring E-government Sector
4 1 Validation
The model constructed has ten Levels (stock variables), but two of them are used to memorize their values at one period before. Two of them are used for calculating the total amount of each variable, and one of them is for calculating the periods (years) elapsed. Only five Levels, namely SkilledTP, TargetPopUnskilled, Facilitylevel AccessibleFunctions and UnOpenedFunctions are the primary components.
Changes in these five variables depend on three policy variables, namely TotalExpenditure, TrainingRatio and ForAccessRatio, which are input at every period, and eight parameters. In addition they are also affected by a graph function NeighborEffect. When the author can collect the necessary data in Bandung for estimating values of the parameters stated above, the appropriate values of the parameters will be estimated easily. However, the author doesn't have only a part of the necessary data. Although the values of these parameters can be estimated by use of the data in some cities in Japan, they cannot be directly applied to the Bandung city.
Though the structure of the model is simple, it has the primary mechanisms which are picked out in the preceding sectors. The validity of the model has not been proved empirically at present, but there are no fatal defects in the model structure.
4 2 Simulation Data and Setting of Parameter
In the beginning, data and parameters must be determined in advance as an input before doing simulation. In this case, the author determined a parameter and policy variables called Total Expenditure which is allocated to the three programs that is access expenditure, training expenditure, and facility expenditure. It also related with the total population of Bandung city. In this simulation, the author determine total target population (TP) for e-government system by dividing into two parts that is the number of people who have the skill to use computer and internet (skilled target population) and the number of people who don't have the skill to use computer and internet (unskilled target population).
In this situation, target population is the number of heads of households. The decision made on the basis that the e- government services largely involve the interests of the household, so this measure can represent the population of e-government targets.The total number of households in Bandung city is
760.000. From the total number of household there are 200,000 skilled and 560,000 unskilled population. Target population is total of skilled and unskilled target population.
The equation in the model is like this : TargetPopulation=TargetPopUnskilled +SkilledTP (1)
It determine that there are 50 ideal functions in e-government system (Gauging e-government , Kaylor,
2001). There are two types: functions that have been available(Accessible functions) and functions that
are not yet available (unopened functions). It determines in Bandung city there are five functions that are available and 45 functions that are not available.
The number of accessible functions = 5
The number of unopened functions = 45
Based on Bass diffusion model that have been mentioned previously, neighbor effects as an interpersonal influence are also become a parameter (see figure 16). Neighbor's effect influences the usability ratio around 10%. This figure described that the higher influence because of neighbor effect, the higher the ratio of usability from the people. So, neighbor's effect has a significant influence to the usability ratio but the proportion is not too high.
Figure 16. Graph of Neighbor Effects
NeighborEffect=Graph(UsabilityBefore)
(0.00, 1.01), (0.1, 1.01), (0.2, 1.01), (0.3, 1.01), (0.4, 1.03), (0.5, 1.05), (0.6, 1.10), (0.7, 1.11), (0.8, 1.11), (0.9, 1.12), (1, 1.12)
E-government total expenditure of Bandung city government is $25,000 which will be allocated to three different programs such as training expenditure, access expenditure, and facility expenditure. There are several conditions that existed currently in Bandung city as an input in the model such as:
The number of facility level in Bandung city is three. It means that currently there are three PCs as a public facility that provided by the government.
The price of one PCs (Unit cost facility) is $500.
The number of people who have the skill to use internet (Skilled Target population) is 200,000
The number of people who don't have the skill to use internet (Unskilled target population) is 560,000
Training cost for one person (Unit cost training) is $20.
The author wants to determine the number of e-government adoption in Bandung with a simulation tool. The simulation tool is constructed based on System Dynamics as an integrated and comprehensive approach to understand e-government and its use. Because of lack of suitable statistical data, simulations were carried out by using subjectively estimated but plausible values of parameters after the sensitivity analysis as one of system dynamics validation. From the results of simulations, very complicated trade-off relationships among the allocated project budgets to different types of programs were suggested.
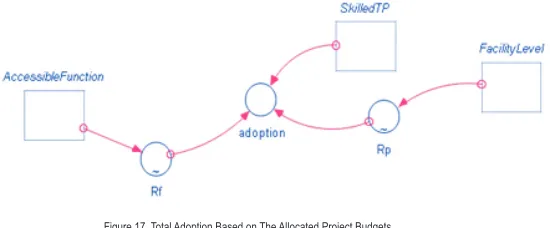
The objective of this research is to find the best parameters and policies with a very complicated trade-off relationships among the allocated project budgets to different type of programs. That's why the author make a model that can be seen in figure 17 to determine which is the best allocated project budgets to optimize the number of adoption. Measure the number of adoptions based on distribution of the budget. Determine the budgetary allocation to maximize the number of e-government adoption.
The model assumes that not all of the number of skilled population will adopt e-government because it depends on the availability of existing functions on the websites and facilities that provided by government. It is considers that it is not possible for adoption of e-government if there are no facility or function in this case Rf and Rp is 0. Thus, the implementation of e-government will occur if there are people who have the skill to use the internet, there is function that provided on the website so that it can be accessed by the public, and the availability of computer facilities (PC) whether public facilities which provided by the government or private facilities.
In a case study in Bandung city, the skilled target population, the number of households who have been in training and have the skills to use the Internet is 200.000 or around 26% from total 760.000 household.
Function (Rf)
Content or function provided on the website so that it can be accessed by the public influence the adoption rate of e-government. It is assumed that the higher the number of functions that can be accessible will increase the number of people to adopt e-government. Function in this case can be a function of the form of information, interaction, or transaction.
With the increasing number of these functions, the public will feel that e-government systems is usefulness and in accordance with their needs. It is related with the demand side model that mentioned in previous part (figure 2), quality of e-government depend on the richness of information.
Figure 18 shows the graphic that described the relationship or ratio between accessible functions and rate of adoption It is assumed that Rf is the ratio between the functions that can be accessed and the number adoptions that describes the relationship between the increasing number of functions with the rate of e-government adoption. The connectivity can be seen on the graph in figure 20 where every five additional functions lead to the increasing rate of adoptions from 0 to 0,06 and so on.
Figure 17. Total Adoption Based on The Allocated Project Budgets
Here the author determines an allocation budget to maximize the number of e-government adoption. The allocation budget from different types of programs: training, access, and facility. It can be seen from the model that the number of adoption is determined from the number of people who have the skill to use internet (skilled Target population), the percentage of the increasing number of adoption due to the number of functions that available for them (Rf), and the percentage of the increasing number of adoption due to the number of facilities (computer) that available for them (Rf).
The equation of that relationship is as follows :
adoption=SkilledTP*Rf*Rp (2)Explanation of each variable mentioned above are as follows:
SkilledTP
Adoption of e-government depends on the number of people who already have skills and Internet literacy which is closely related to the training costs incurred by government to train citizen so that the number of Internet-literate society increases. Training is to ensure the citizen to feel that e-government system is easy to uses and perceived usefulness
Figure 18. Ratio Between Accessible Functions and Rate of Adoption
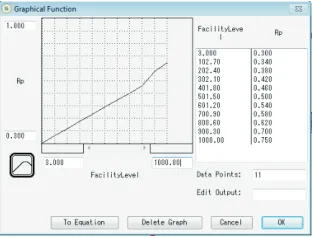
3. Facility (Rp)
It is need equipment or facility such as from a PC or mobile phone to access e-government. Availability of the facility affects the level of government adoption. With the availability of facilities it will facilitate the public to access e-government. To access e-government, people can use private or public facilities because they don't have their own facilities. Government budget are allocated for public facility such as PC or computer.
The people who use private facilities to access e-government is around 30% while the people who will use public facilities provided by the government is around 70%. If there are no public facilities provided by the government then adoption could still happen because there is 30% or 0,3 people who can adopt by using their private facilities. It can be seen from Figure 19 that the maximum amount of facilities that can be provided by government is 1.000 computers in 20 years time. Each additional facility will increase the rate of adoption.
5. Result and Analysis
The allocation budget for three programs is determines to find the maximum number of e-government adoption.The author makes 50 combinations among access, facility, and training ratio randomly then input them to the model. From 50 combinations and results which can be seen in table 2, shows that the maximum number of adoption was obtained from the combination number 34 which is allocated 3% budget for access, 7% for training, and 90% for facility in 2010.
5.1. Result
The result of simulation can be seen in table 2. From the results of simulations, very complicated trade-off relationships among the allocated project budgets to different types of programs were suggested. First, the budget for public facilities that aims to provide facilities to the public to access government has a significant effect on the rate of adoption of e-government that is 90% of total expenditure. This is in accordance with demand-side model in this study that the quality of e-government is depends on the easiness to access by citizen.
Table 2. Total Adoption based on allocated budget for access, training, and facility
Figure 19. Ratio Between Facility Level and The Rate of Adoption
The budget for training people also has effect on the rate of adoption that is 7% of total expenditure. The increasing number of people who have the skill to use the internet has a great potential which will further increase the adoption rate. The budget for accessible functions on the website has an effect on the rate of adoption that is 3% of total expenditure. This is also in accordance with demand side model in this study which explain that the quality of e-government is depends on the richness of information and services. The budgets for training and accessible functions are not too significant compared to the budget for the facility.
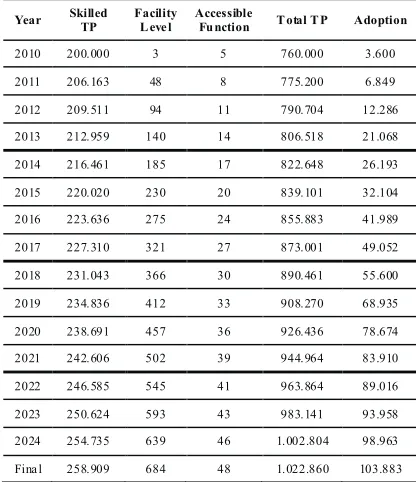
Table 3 shows the variable outcome from the simulation results. It can be seen from the table that for the budget that allocated 3% for access, 7% for training, and 90% for facility, the total number of e-government adoption is maximum that is 103.883 people. From this allocation budget, the number of adoption in 2025 is increase around 28% from 2010.
Table 3. Table of Simulation Outcome
Year Skilled
The increasing number of function per year is around 6% from the total function where in 2025 the maximum number of accessible function is 47 from 50 target functions. The increasing number of facilities (Facility Level) per year is 4,5% while the increasing number of skilled target population per year is around 0,8%. Total adoption in 2025 is 27 times from the total adoption in 2010.
5.2. Analysis
The author makes an analysis of the simulation results and has the following findings:
7% budget is allocated for training people because the unit cost training is low, namely only $20. Also, in the current condition, the number of trained people is relatively high (about 30% of target population). In other words, because of the lower unit cost, the government can give more training opportunities to the unskilled people in spite of small amount of allocated budget.
1. 90% of total budget is allocated for facility level (the number of PC). The budget allocated for the facility is very high because: (1) the unit cost of facility is high, namely $500 and (2) the number of facilities available in Bandung city are very low. If the government can provide a large amount of facilities to the public then the number of e-government adoption will increase. It also make the citizen doesn't feel the difficulty to access e-government especially the people who have a digital divide that majority live in rural areas. We assume that only 30% of skilled population who have a private internet connection and 70% is need public facility provided by the government. If more people are using private Internet connections so the budget for facilities can be reduce.
2. 3% of total budget is allocated for access. The allocation budget for access is low because the model assumed that the maximum increasing number of functions per year is five according to the reality in Bandung city. If the government can provide the good and useful function for citizen then the citizen will be highly motivated to adopt e-government.
6 Conclusion
According to “the United Nations e-government readiness rankings” in recent years, Indonesia holds a low rank among Southeast Asian countries due to several factors that make the rate of adoption of e-government low. The objective of this study was to identify the factors those influence the adoption rate of e-government by the literature reviews and to create a simulation model for developing feasible strategies to maximize the adoption of e-government in Bandung city, Indonesia in the future as a typical example of cities in developing nations.
The following remarks have been derived from this research:
A detailed conceptual model which is the core of a simulation model was composed. It includes both the supply sector which depicts the mechanism of constructing and operating the e-government system and the demand sector which represents the citizens' intention of communicating with the e-government and their behaviors toward it. Based on the detailed conceptual model, a simplified simulation model for planning the policy of the e-Government development was constructed by the use of System Dynamics as an integrated and comprehensive approach to understand the e-government and its use.
The relationship between the adoption rate of e-government and the expenditure for the development of e-government in Bandung city which will be allocated to three following programs was analyzed by means of the simulation: increasing accessible services or functions provided on the website, training people in order that they can have the skill to use the internet and have the potential to adopt government and installing facilities or publicly supplied PCs to access e-government. This is done because most of the data obtained by the author is about the expenditure of Bandung city government allocated for e-government development.
The budget for installing public facilities that aims to provide or lend PCs to the public for access to the e-government has a significant effect on the rate of adoption of the e-government. However, the budget for increasing accessible functions on the website and training is not effective compared to the facility program.
4. The simulation model in this research is applicable to strategic planning of e-government implementation in a municipality government. This simple simulation model should be more refined and fully extended in the future by the use of more data. However, this research is valuable due to the development of a basic technique in the public management field.
There are some future works for this research:
In the analysis of e-government implementation in this research only the budgetary aspect was considered. There are still many aspects that have not been analyzed, for example, neighbor effect, cultural condition and organizational conditions.
One of the future works is to determine the cost of each function (unit cost function) or each service provided on the website because the cost depends on the required technology and information.
The simulation model in this study is also that of a one department of Bandung city government. There are 13 unit departments in Bandung city government which have different functions and roles. Therefore, they have different target populations and functions or services that will be provided. The next step is to apply the model to all the departments in Bandung city.
References
Bass, Frank M. (1969). New Product Growth For Model Consumer Durables. Management Science, January, Vol.15, No.5.
Davis, F. D., Bagozzi, R. P., and Warshaw, P. R. (1989). User acceptance of computer technology: A comparison of two theoretical models. Management Science, Vol. 35, pp. 982-1003
Instruksi Presiden Republik Indonesia Nomor 3 tahun 2003 tentang Kebijakan dan Strategi nasional pengembangan E-government
Javadi, M.M., Gharakhani,Aref. Evaluating Iran's progress in ICT sector using e-Readiness Index, A system Dynamics Approach
Kaylor,C., Deshazo, R., Van Eck, D. (2001). Gauging e-government : A report on implementing servixes among American cities. Government Information Quarterly 18 , p293-307
Mahadeo, J, D. (2009). Towards an Understanding of the Factors Influencing the Acceptance and Diffusion of e-government Services. Electronic Journal of e-government Volume 7 Issue 4, (pp391-402), available online a www.ejeg.com
Reddick,C.G. Citizen interaction with e-government : From the streets to servers? Government Information Quaterly 22 (2005) 38–57
Solomon Atnafu, Dessalegn Mequanint and Yigremew Adal. (2008). E-local governance: A case study on life-event services in the Kebeles of the city government of Addis Ababa. Proceedings of the LOG-IN Africa e-Local Governance 1st International Conference June 5-6, Cairo, Egypt 157-169
Takeshi Arai. (1999). Questionnaire to the small cities in Japan about the constraints on and the effects of utilizing the Internet. Proceedings of the Autumn Conference of Japan Society of Management Information, p355-358 (in Japanese).