P/M Parts
FIGURE 11.1 (a) Examples of typical parts made by powder-metallurgy processes. (b) Upper trip lever for a commercial irrigation sprinkler, made by P/M. Made of unleaded brass alloy, it replaces a die-cast part, at a 60% cost savings. Source: Courtesy of Metal Powder Industries Federation.
Particle Shapes
FIGURE 11.2 Particle shapes and characteristics of metal powders and the processes by which they are produced.
(a) One-dimensional (b) Two-dimensional
Acicular (chemical decomposition)
Irregular rodlike
(chemical decomposition, mechanical comminution)
Flake (mechanical comminution)
Dendritic (electrolytic)
(c) Three-dimensional Spherical
(atomization, carbonyl (Fe),
precipitation from a liquid)
Irregular (atomization,
chemical decomposition)
Angular (mechanical disintegration, carbonyl (Ni )) Rounded
(atomization, chemical decomposition)
Powder Production
FIGURE 11.3 Methods of metal-powder production by atomization: (a) gas atomization; (b) water atomization; (c) atomization with a rotating consumable electrode; and (d) centrifugal atomization with a spinning disk or cup.
Vacuum
Spindle Inert gas
Rotating consumable electrode
Nonrotating
tungsten electrode
Collection port (b)
Atomizing gas spray Molten metal
Metal particles
(a)
(c) (d)
Tundish
High-pressure water manifold
Atomization tank
Water
atomization Dewatering
Liquid metal
Metal particles
Spinning disk
Tundish
Atomizing chamber Ladle
Molten metal Ladle
Particle Size Distribution
FIGURE 11.4 (a) Distribution of particle size, given as weight percentage; note that the highest percentage of particles have a size between 75 and 90 µm. (b) Cumulative particle-size distribution as a function of weight. Source: After R.M. German.
20
15
10
5
0
W
eight (%)
10 100 1000
Particle size (µm)
100
75
50
25
0
Cumulative weight finer (%)
Particle size (µm)
10 100 1000
Compaction
FIGURE 11.5 (a) Compaction of metal powder to produce a bushing. (b) A typical tool and die set for compacting a spur gear. Source: Courtesy of Metal Powder Industries Federation.
Compacted shape
(green) Upper punch
Lower punch Powder
Feed Shoe
(b)
Ejector
Lower punch
P/M spur gear (green)
Core rod Upper punch
(a) Die
1. 2. 3. 4.
Density vs. Compacting Pressure
FIGURE 11.6 (a) Density of copper- and iron-powder compacts as a function of compacting pressure. Density greatly influences the mechanical and physical properties of P/M parts. Source: After F.V. Lenel. (b) Effect of density on tensile strength, elongation, and electrical conductivity of copper powder. (IACS is International Annealed Copper Standard for electrical conductivity.)
Elo ngat ion Cond uctiv ity Tensile streng th lb/in3
0.29 0.30 0.31 0.32
30 25 20 15 10 psi x 10 3 T
ensile strength (MPa) Elongation (%)
Electrical conductivity (% IACS)
200 150 100 (b) 40 35 30 25 20 100 95 90 85 80
Sintered density (g/cm3) 8.0 8.2 8.4 8.6 8.8
Apparent Density Density of iron Density of copper
0 200 400 600 800 1000 1200 MPa 0 1 2 3 4 5 6 7 8 9 Density (g/cm 3 )
0 20 40 60 80 100
Compacting pressure (tons/in2)
0 0.3 0.2 0.1 lb/in 3 (a)
Copper powder, coarse 3.49 g/cm3
Iron powder, fine 1.40
Iron powder, coarse 2.75
Mechanics of Compaction
FIGURE 11.8 Coordinate system and stresses acting on an element in compaction of powders. The pressure is assumed to be uniform across the cross-section. (See also Fig. 6.4.)
(a) (b) (c) (d) (e)
L /D =1.66
700 MPa
600
500
400
300
200
100
D/2
C L
L
FIGURE 11.7 Density variation in compacting metal powders in different dies: (a) and (c) single-action press; (b) and (d) double-single-action press, where the punches have separate movements. Note the greater uniformity of density in (d) as compared with (c). Generally, uniformity of density is preferred, although there are situations in which density variation, and hence variation of properties, within a part may be desirable. (e) Pressure contours in compacted copper powder in a single-action press. Source: After P. Duwez and L. Zwell.
p0
L
x
d x
D
px
px+ d p
x
µ!r
!r
Resultant pressure distribution:
Cold Isostatic Pressing
FIGURE 11.9 Schematic illustration of cold isostatic pressing in compaction of a tube. (a) The wet-bag process, where the rubber mold is inserted into a fluid that is subsequently pressurized. In the arrangement shown, the powder is enclosed in a flexible container around a solid core rod. (b) The dry bag process, where the rubber mold does not contact the fluid, but instead is pressurized through a diaphragm. Source: After R.M. German.
(a) (b)
Cover
Fluid
Mold seal plate
Rubber mold (bag)
Powder Metal
mandrel Pressure vessel
Wire
mesh basket
Pressure source
Upper cover
Fluid
Powder Pressure
vessel
Pressing rubber mold Rubber
diaphragm
Forming rubber mold
Lower inside cover
Lower
outside cover Pressure
Pressures and Capabilities
FIGURE 11.10 Process capabilities of part size and shape complexity for various P/M operations; P/F is powder forging. Source: Metal Powder Industries Federation.
6 5 4 3 2 1 0
Relative shape complexity
in. 30 20 10 0.2 0.4 0.6 HIP CIP P/M PIM Size (m) 0 P/F 0 Pressure
MPa psi ×103
Metal
Aluminum 70–275 10–40
Brass 400–700 60–100
Bronze 200–275 30–40
Iron 350–800 50–120
Tantalum 70–140 10–20
Tungsten 70–140 10–20
Other Materials
Auminum oxide 110–140 16–20
Carbon 140–165 20–24
Cemented carbides 140–400 20–60
Ferrites 110–165 16–24
Hot Isostatic Pressing
FIGURE 11.11 Schematic illustration of the sequence of steps in hot isostatic pressing. Diagram (4) shows the pressure and temperature variation versus time.
Part Pressure
Temperature
Time Gas inlet
End cap
High-pressure cylinder Insulation
Workpiece
Heating coils
End cap
1. Fill can 2. Vacuum bakeout
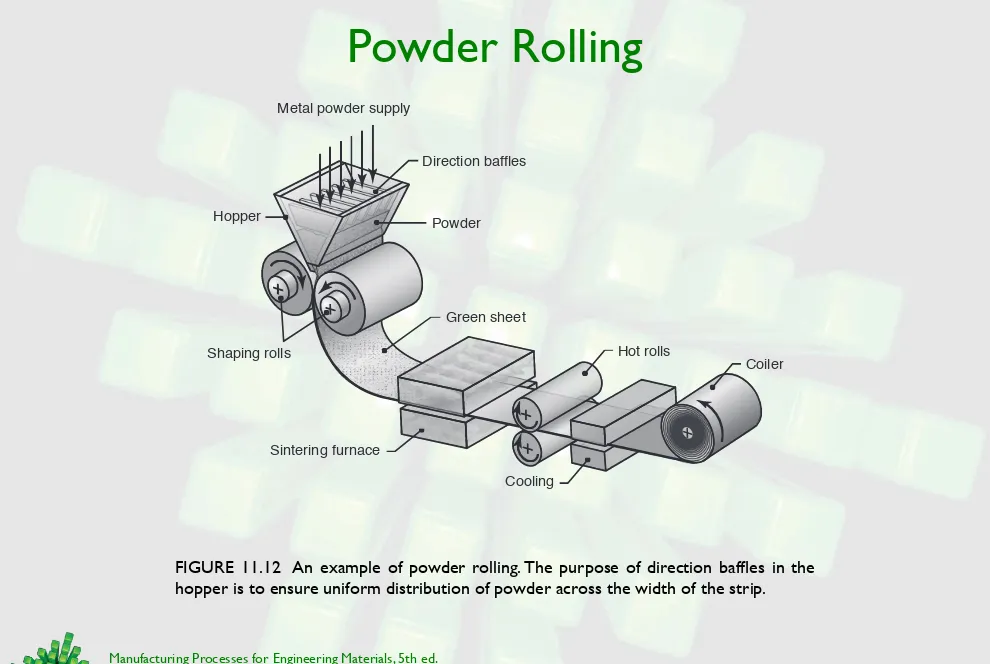
Powder Rolling
FIGURE 11.12 An example of powder rolling. The purpose of direction baffles in the hopper is to ensure uniform distribution of powder across the width of the strip.
Hopper Powder
Direction baffles
Shaping rolls
Metal powder supply
Green sheet
Sintering furnace
Hot rolls
Cooling
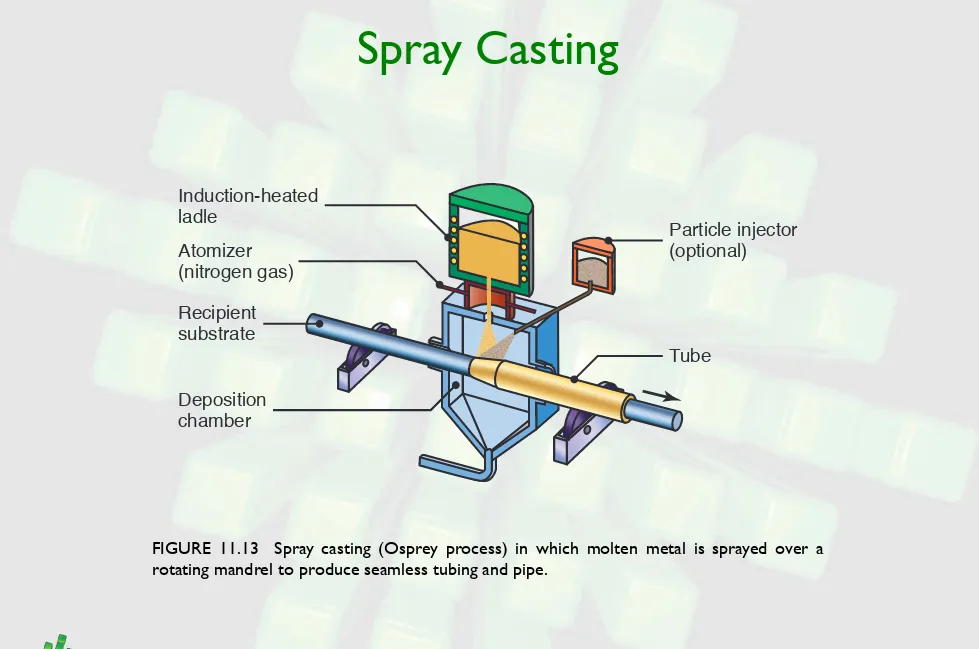
Spray Casting
FIGURE 11.13 Spray casting (Osprey process) in which molten metal is sprayed over a rotating mandrel to produce seamless tubing and pipe.
Tube
Particle injector (optional)
Induction-heated ladle
Atomizer
(nitrogen gas)
Recipient substrate
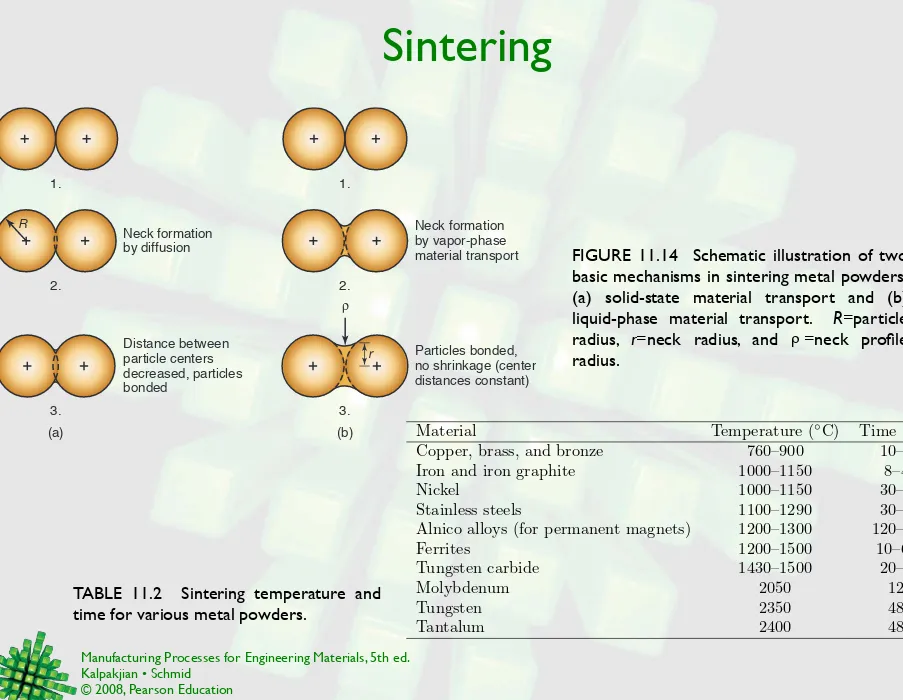
Sintering
TABLE 11.2 Sintering temperature and time for various metal powders.
(a) 1. 1. 2. 2. 3. 3. (b) Neck formation by diffusion Distance between particle centers decreased, particles bonded Neck formation by vapor-phase material transport Particles bonded, no shrinkage (center distances constant)
r R
R
Material Temperature (◦C) Time (min)
Copper, brass, and bronze 760–900 10–45
Iron and iron graphite 1000–1150 8–45
Nickel 1000–1150 30–45
Stainless steels 1100–1290 30–60
Alnico alloys (for permanent magnets) 1200–1300 120–150
Ferrites 1200–1500 10–600
Tungsten carbide 1430–1500 20–30
Molybdenum 2050 120
Tungsten 2350 480
Tantalum 2400 480
FIGURE 11.14 Schematic illustration of two basic mechanisms in sintering metal powders: (a) solid-state material transport and (b) liquid-phase material transport. R=particle radius, r=neck radius, and =neck profile radius.
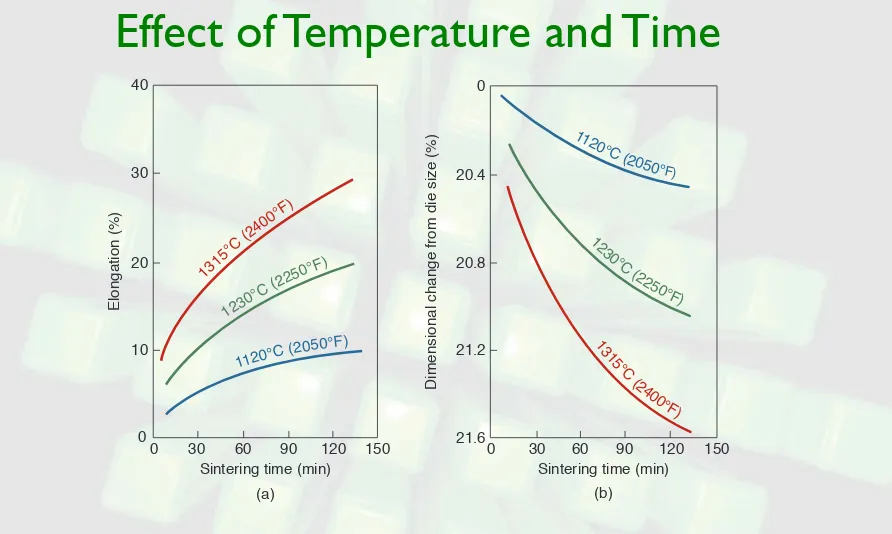
Effect of Temperature and Time
FIGURE 11.5 Effect of sintering temperature and time on (a) elongation and (b) dimensional change during sintering of type 316L stainless steel. Source: ASM International.
Elongation (%) 40 30 20 10 0
0 30 60 90 120 150
Sintering time (min) 1315
°C (2
400° F)
1230
°C (2
250°F)
1120°C (2
050°F) 0 20.4 20.8 21.2 21.6
Dimensional change from die size (%)
0 30 60 90 120 150
Sintering time (min)
112
0°C (2050°
Mechanical Properties of P/M Materials
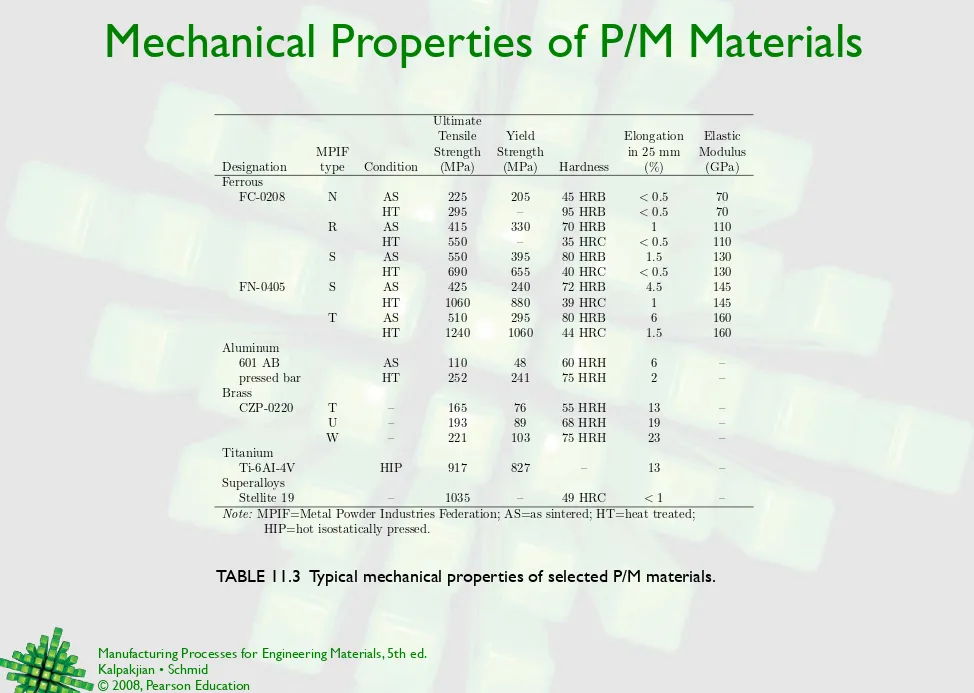
TABLE 11.3 Typical mechanical properties of selected P/M materials.
Ultimate
Tensile Yield Elongation Elastic
MPIF Strength Strength in 25 mm Modulus
Designation type Condition (MPa) (MPa) Hardness (%) (GPa) Ferrous
FC-0208 N AS 225 205 45 HRB <0.5 70
HT 295 – 95 HRB <0.5 70
R AS 415 330 70 HRB 1 110
HT 550 – 35 HRC <0.5 110
S AS 550 395 80 HRB 1.5 130
HT 690 655 40 HRC <0.5 130
FN-0405 S AS 425 240 72 HRB 4.5 145
HT 1060 880 39 HRC 1 145
T AS 510 295 80 HRB 6 160
HT 1240 1060 44 HRC 1.5 160
Aluminum
601 AB AS 110 48 60 HRH 6 –
pressed bar HT 252 241 75 HRH 2 –
Brass
CZP-0220 T – 165 76 55 HRH 13 –
U – 193 89 68 HRH 19 –
W – 221 103 75 HRH 23 –
Titanium
Ti-6AI-4V HIP 917 827 – 13 –
Superalloys
Stellite 19 – 1035 – 49 HRC <1 –
Note: MPIF=Metal Powder Industries Federation; AS=as sintered; HT=heat treated;
Titanium Property Comparison
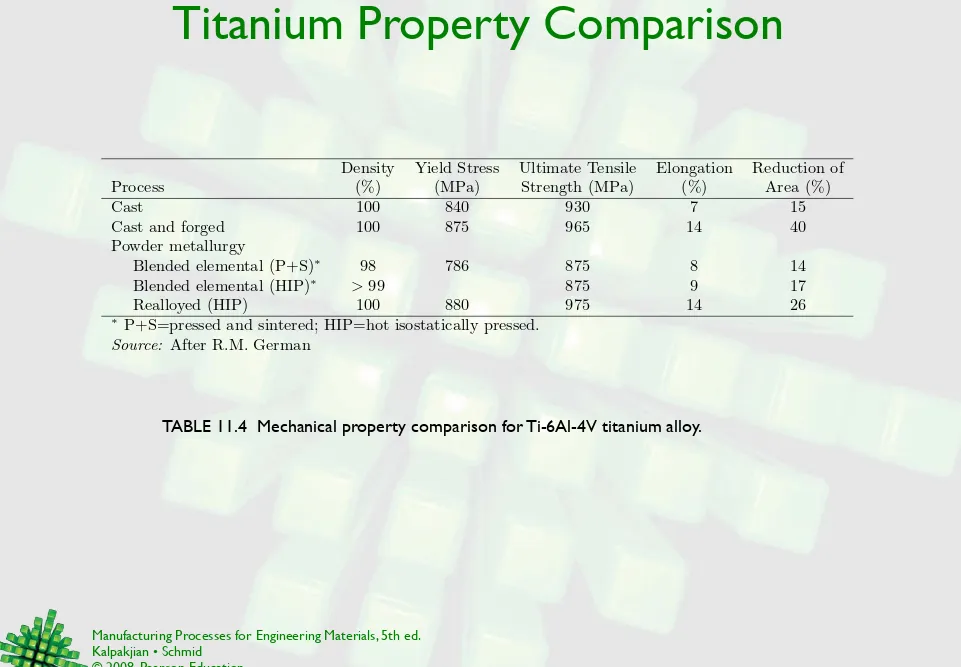
TABLE 11.4 Mechanical property comparison for Ti-6Al-4V titanium alloy.
Density Yield Stress Ultimate Tensile Elongation Reduction of Process (%) (MPa) Strength (MPa) (%) Area (%)
Cast 100 840 930 7 15
Cast and forged 100 875 965 14 40
Powder metallurgy
Blended elemental (P+S)∗ 98 786 875 8 14
Blended elemental (HIP)∗ > 99 875 9 17
Realloyed (HIP) 100 880 975 14 26
∗ P+S=pressed and sintered; HIP=hot isostatically pressed.
P/M Example: Bearing Caps
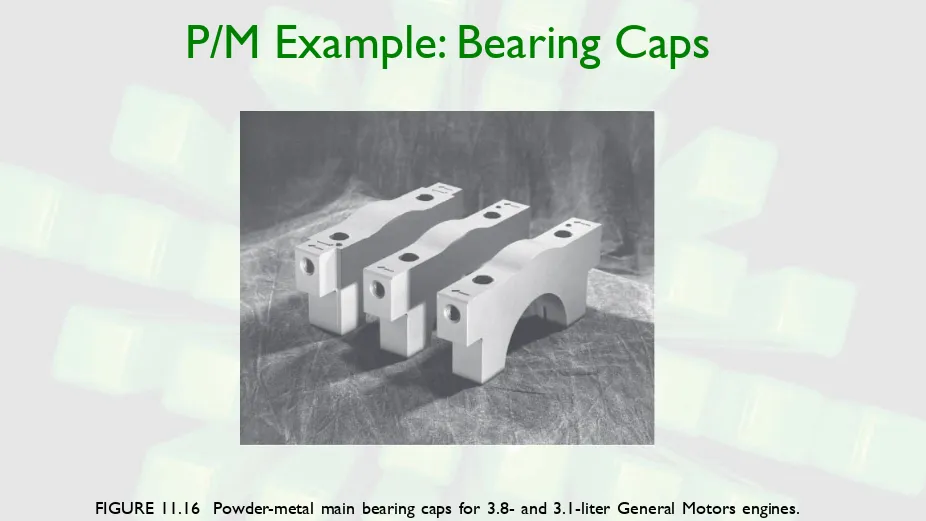
FIGURE 11.16 Powder-metal main bearing caps for 3.8- and 3.1-liter General Motors engines.
Geometry for P/M Dies
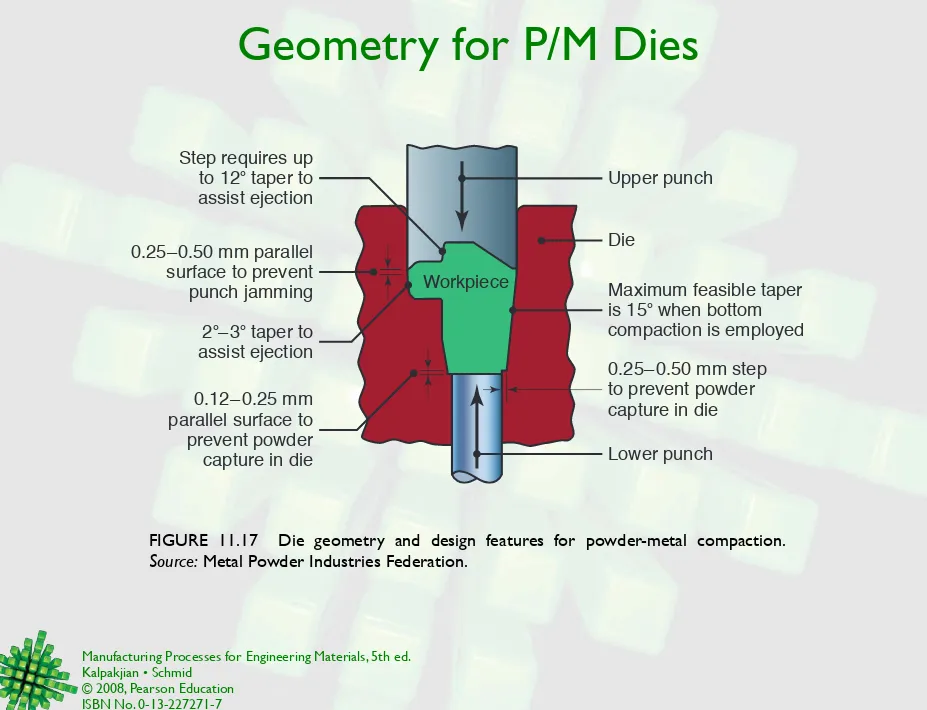
FIGURE 11.17 Die geometry and design features for powder-metal compaction.
Source: Metal Powder Industries Federation.
Workpiece
Die
2°–3° taper to assist ejection 0.25–0.50 mm parallel
surface to prevent punch jamming Step requires up
to 12° taper to assist ejection
Maximum feasible taper is 15° when bottom
compaction is employed Upper punch
0.12– 0.25 mm parallel surface to prevent powder capture in die
0.25–0.50 mm step to prevent powder capture in die
Design
Considerations
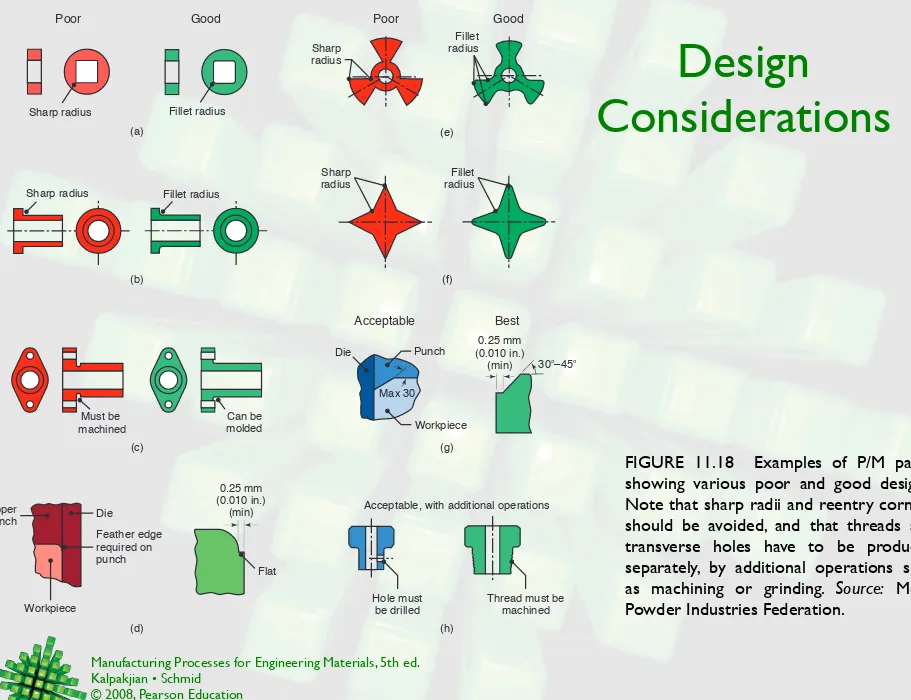
FIGURE 11.18 Examples of P/M parts, showing various poor and good designs. Note that sharp radii and reentry corners should be avoided, and that threads and transverse holes have to be produced separately, by additional operations such as machining or grinding. Source: Metal Powder Industries Federation.
(b) (c) (d) Good Poor (f) (a) (e) Poor Good (g) (h) Sharp radius Fillet radius
Must be machined
Can be molded Sharp radius Fillet radius
Upper punch Die Workpiece Feather edge required on punch 0.25 mm (0.010 in.) (min) Flat
Acceptable, with additional operations
Hole must be drilled
Thread must be machined Best Acceptable Sharp radius Sharp radius Fillet radius Fillet radius Max 30 Workpiece Punch Die
30°–45°
0.25 mm (0.010 in.)
Design Considerations
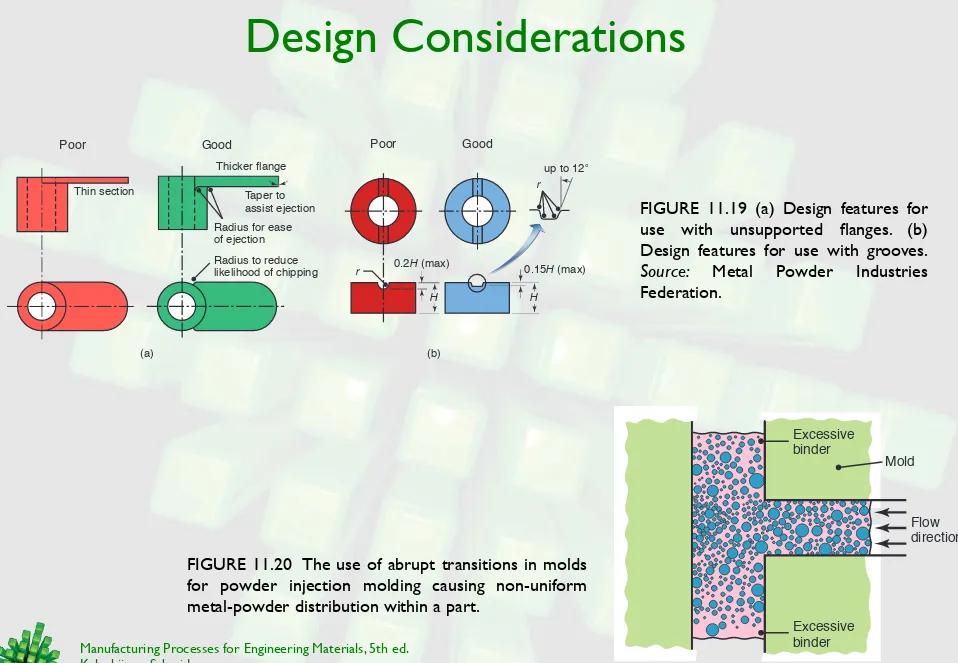
FIGURE 11.19 (a) Design features for use with unsupported flanges. (b) Design features for use with grooves.
Source: Metal Powder Industries Federation.
(a) (b)
Thin section
Thicker flange
Radius to reduce likelihood of chipping Radius for ease of ejection
Taper to assist ejection
Poor Good
r
H H
0.2H (max)
up to 12° r
0.15H (max)
Poor Good
FIGURE 11.20 The use of abrupt transitions in molds for powder injection molding causing non-uniform
Excessive binder
Flow direction
Powder build-up
Process Comparison
TABLE 11.5 Competitive features of P/M and some other manufacturing processes.
Process Advantages Over P/M Limitations as Compared With P/M
Casting Wide range of part shapes and sizes
produced; generally low mold and setup cost.
Some waste of material in processing; some finishing required; may not be feasible for some high-temperature al-loys.
Forging (hot) High production rate of a wide range
of part sizes and shapes; high me-chanical properties through control of grain flow.
Some finishing required; some waste of material in processing; die wear; relatively poor surface finish and di-mensional control.
Extrusion (hot) High production rate of long parts;
complex cross-sections may be pro-duced.
Only a constant cross-sectional shape can be produced; die wear; poor di-mensional control.
Machining Wide range of part shapes and sizes;
short lead time; flexibility; good di-mensional control and surface finish; simple tooling.
Types of
Ceramics
and
Glasses
TABLE 11.6 Types and general characteristics of ceramics and
Type General Characteristics
Oxide Ceramics
Alumina High hot hardness and abrasion resistance, moderate strength and toughness; most widely used ceramic; used for cutting tools, abrasives, and electrical and thermal insulation.
Zirconia High strength and toughness; resistance to thermal shock, wear, and corrosion; partially-stabilized zirconia and transformation-toughened zirconia have better properties; suitable for heat-engine components.
Carbides
Tungsten carbide High hardness, strength, toughness, and wear resistance, depending on cobalt binder content; commonly used for dies and cutting tools.
Titanium carbide Not as tough as tungsten carbide, but has a higher wear resistance; has nickel and molybdenum as the binder; used as cutting tools.
Silicon carbide High-temperature strength and wear resistance, used for engines components and as abrasives.
Nitrides
Cubic boron nitride Second hardest substance known, after diamond; high resistance to oxidation; used as abrasives and cutting tools.
Titanium nitride Used as coatings on tools, because of its low friction characteristics.
Silicon nitride High resistance to creep and thermal shock; high toughness and hot hardness; used in heat engines.
Sialon Consists of silicon nitrides and other oxides and carbides; used as cutting tools. Cermets Consist of oxides, carbides, and nitrides; high chemical resistance but is somewhat
brittle and costly; used in high-temperature applications.
Nanophase ceramics Stronger and easier to fabricate and machine than conventional ceramics; used in automotive and jet-engine applications.
Silica High temperature resistance; quartz exhibits piezoelectric effects; silicates contain-ing various oxides are used in high-temperature, nonstructural applications.
Glasses Contain at least 50% silica; amorphous structure; several types available, with a wide range of mechanical, physical, and optical properties.
Glass ceramics High crystalline component to their structure; stronger than glass; good thermal-shock resistance; used for cookware, heat exchangers, and electronics.
Graphite Crystalline form of carbon; high electrical and thermal conductivity; good thermal-shock resistance; also available as fibers, foam, and buckyballs for solid lubrication; used for molds and high-temperature components.
Ceramic Structure
FIGURE 11.21 The crystal structure of kaolinite, commonly known as clay; compare with Figs. 3.2-3.4 for metals.
Oxygen ions
Aluminum ions
Properties of Ceramics
Transverse
Rupture Compressive Elastic Poisson’s
Strength Strength Modulus Hardness Ratio Density
Material Symbol (MPa) (MPa) (GPa) (HK) (ν) (kg/m3)
Aluminum oxide Al2O3 140–240 1000–2900 310–410 2000–3000 0.26 4000–4500
Cubic boron nitride cBN 725 7000 850 4000–5000 – 3480
Diamond – 1400 7000 830–1000 7000–8000 – 3500
Silica, fused SiO2 – 1300 70 550 0.25 –
Silicon carbide SiC 100–750 700–3500 240–480 2100–3000 0.14 3100
Silicon nitride Si3N4 480–600 – 300–310 2000–2500 0.24 3300
Titanium carbide TiC 1400–1900 3100–3850 310–410 1800–3200 – 5500–5800
Tungsten carbide WC 1030–2600 4100–5900 520–700 1800–2400 – 10,000–15,000
Partially stabilized zirconia PSZ 620 – 200 1100 0.3 5800
Note: These properties vary widely, depending on the condition of the material.
TABLE 11.7 Approximate range of properties of various ceramics at room temperature.
Strength:
Elastic modulus:
Thermal conductivity:
UTS
≈
UTS
oe
−nPE
≈
E
o(
1
−
1
.
9
P
+
0
.
9
P
2
)
k
=
k
o(
1
Temperature Effects
FIGURE 11.22 Effect of
temperature on thermal
expansion for several ceramics, metals, and plastics. Note that the expansions for cast iron and for partially stabilized zirconia (PSZ) are within about 20%.
2.0 1.8 1.6 1.4 1.2 1.0 0.8 0.6 0.4 0.2 0 20.2
400 800 1200 1600 2000 2400 2800 3200 °F
200 400 600 800 1000 1200 1400 1600 Temperature (°C)
Linear thermal expansion (%)
Polyethylene
Nylon
Al alloys
Cast iron and MgO
Ni-base superalloy
Partially stabilized
ZrO2
Al2O3
ZrSiO4
(zircon) SiC
Lithium aluminum silicate
Fused
SiO2
Si3N4
600 500 400 300 200 100 0 T
ensile strength (MPa)
0 200 400 600 800 1000 1200 1400 1600 500 1000 1500 2000 2500
°F 90 80 70 60 50 40 30 20 10 0
psi x 10
3
High-purity silicon nitride (Fine grain)
High-purity silicon nitride
Al2O3
High-purity SiC
SiC
Sialon 116
Silicon nitride (reaction bonded)
Glass ceramic
Low-density SiC
Temperature (°C)
FIGURE 11.23 Effect of temperature on the strength of various engineering ceramics. Note that much of the strength is maintained at high temperatures; compare with Figs. 2.9 and 8.30.
800 1600 2400 °F GPa 400 300 200 100 0 60 50 40 30 20 10 0
Modulus of elasticity (psi
x 10
6 )
SiC
SrO2
MgAl2O4
TiC Al2O3
Si3N4
MgO
ThO2
0 400 800 1200 1600 Temperature (°C)
Example: Ceramic Bearings
FIGURE 11.25 A selection of ceramic bearings and races. Source: Courtesy of Timken, Inc.
Processes & Particle Production
TA B L E 1 1 . 8 G e n e r a l characteristics of ceramics processing methods.
(a) (b) (c)
Process Advantages Limitations
Slip casting Large parts; complex shapes; low
equip-ment cost.
Low production rate; limited dimensional accuracy.
Extrusion Hollow shapes and small diameters; high
production rate.
Parts have constant cross-section; limited thickness.
Dry pressing Close tolerances; high production rate
with automation.
Density variation in parts with high
length-to-diameter ratios; dies require
high abrasive-wear resistance; equipment can be costly.
Wet pressing Complex shapes; high production rate. Limited part size and dimensional
accu-racy; tooling costs can be high.
Hot pressing Strong, high-density parts. Protective atmospheres required; die life
can be short.
Isostatic pressing Uniform density distribution. Equipment can be costly.
Jiggering High production rate with automation;
low tooling cost.
Limited to axisymmetric parts; limited di-mensional accuracy.
Injection molding Complex shapes; high production rate. Tooling costs can be high.
Slip Casting
FIGURE 11.27 Sequence of operations in slip casting a ceramic part. After the slip has been poured, the part is dried and fired in an oven to give it strength and hardness. The step in (d) is a trimming operation. Source: After F.H. Norton.
(a)
(b)
(c)
(d)
Trimming
knife
Doctor-Blade Process
FIGURE 11.28 Production of ceramic sheets through the doctor-blade process.
Take-up spool
Ceramic tape on carrier tape
Carrier film Air (filtered)
in Exhaust
out
Slurry chamber and doctor blade Drying
chamber
Doctor blade Controller
for take-up spool
Ceramic slurry
Ceramic film
Density Variation in Compacts
FIGURE 11.29 Density variation in pressed compacts in a single-action press. Note that the variation increases with increasing L/D ratio; see also Fig. 11.7e. Source: After W.D. Kingery.
10 20 40 54 50
65 90100
L
D
Punch Punch
Die L
Extruding and Joggering
FIGURE 11.30 (a) Extruding and (b) jiggering operations in shaping ceramics. Source: After R.F. Stoops.
(b) (a)
Mold return Deairing
chamber
Clay slug
Bat former
Jigger tool Water
Formed ware
Extruder To vacuum
FIGURE 11.31 Shrinkage of wet clay, caused by removal of water during drying; shrinkage may be as much as 20% by volume. Source: After F.H. Norton.
Interparticle water
Clay particles
Dry Pore
water
Glasses
Soda-lime Lead Borosilicate Fused 96% Silica
Glass Glass Glass Glass
Density High Highest Medium Low Lowest
Strength Low Low Moderate High Highest
Resistance to thermal shock Low Low Good Better Best
Electrical resistivity Moderate Best Good Good Good
Hot workability Good Best Fair Poor Poorest
Heat treatability Good Good Poor None None
Chemicals resistance Poor Fair Good Better Best
Impact abrasion resistance Fair Poor Good Good Best
Ultraviolet-light transmission Poor Poor Fair Good Good
Relative cost Lowest Low Medium High Highest
Glass Sheet & Tubing
FIGURE 11.32 The float method of forming sheet glass. Source: Corning Glass Works.
Controlled
atmosphere furnace
Furnace Float bath Lehr
Rollers Molten
tin
FIGURE 11.33 Continuous manufacturing process for glass tubing. Air is blown through the mandrel to keep the tube from collapsing. Source:
Corning Glass Works.
Tube Molten glass
Mandrel
Glass Bottles
FIGURE 11.34 Stages in manufacturing a common glass bottle. Source: After F.H. Norton. Gob
2. Gob in blank mold Blank
mold
Neck
ring Tip
1. Gob falling into blank mold
3. Blow down in blank mold
Blow head
Baffle
Air Air
4. Blow back in blank mold
Air
5. Blank mold reversed
6. Parison hanging on neck ring, reheated during transfer
8. Bottle blown, cooling 7. Parison in
blow mold
Blow mold
Parison
Tongs
Glass Pressing
FIGURE 11.35 Manufacturing steps for a glass item by pressing in a mold. Source: Corning Glass Works.
1. Empty mold 2. Loaded mold 3. Glass pressed 4. Finished piece
FIGURE 11.36 Pressing glass in a split mold. Note that the use of a split mold is essential to be able to remove the part; see also Figs. 10.34, 10.35, and 10.36. Source: After E.B. Shand.
3. Glass pressed 2. Loaded mold
1. Empty mold 4. Finished
Residual Stresses in Glass
FIGURE 11.37 Stages in the development of residual stresses in tempered glass plate. Residual stresses
(b) (a)
Compression Tension
1. Hot glass, no stresses.
2. Surface cools quickly, surface contracts, center adjusts, only
minor stresses.
3. Center cools, center contracts, surface is compressed,
center in tension. Thickness
Metal-Matrix Composites
Fiber Matrix Typical Applications
Graphite Aluminum Satellite, missile, and helicopter structures
Magnesium Space and satellite structures
Lead Storage-battery plates
Copper Electrical contacts and bearings
Boron Aluminum Compressor blades and structural supports
Magnesium Antenna structures
Titanium Jet-engine fan blades
Alumina Aluminum Superconductor restraints in fusion power reactors
Lead Storage-battery plates
Magnesium Helicopter transmission structures
Silicon carbide Aluminum, titanium High-temperature structures
Superalloy (cobalt base) High-temperature engine components
Molybdenum, tungsten Superalloy High-temperature engine components
Example: Brake Caliper
FIGURE 11.38 Aluminum-matrix composite brake caliper, using nanocrystalline alumina-fiber reinforcement.
Powder-in-Tube Process
FIGURE 11.39 Schematic illustration of the steps involved in the powder-in-tube process. Source:
Courtesy of Concurrent Technologies Corporation. Superconducting
ceramic powder
1. Fill 2. Pack
High-purity silver tube
3. Extrude/Draw
Wire
4. Roll
Case Study: Engine Valves
FIGURE 11.40 A valve lifter for heavy-duty diesel engines, produced from a hot-isostatically-pressed carbide cap on a steel shaft. Source: Courtesy of Metal Powder Industries Federation and Bodycote, Inc.
Steel shaft
Steel cap