P-ISSN: 2087-1228 E-ISSN: 2476-9053 Binus Business Review, 8(2), August 2017, 99-106
DOI: 10.21512/bbr.v8i2.1711
Firm Size as Moderator to Non-Linear Leverage-Performance Relation:
An Emerging Market Review
Umar Farooq
1; Ali Qamar Jibran
21 FAST School of Management, National University of Computer & Emerging Sciences Loonaywala Stop (9 Km from Motorway Interchange) Faisalabad-Chiniot Road Faisalabad, Pakistan
2 COMSATS Institute of Information Technology, 1.5 KM Defence Road, Off Raiwind Road, Lahore, Pakistan
1[email protected]; 2[email protected]
Received: 8th November 2016/ Revised: 2nd February 2017/ Accepted: 13th April 2017
How to Cite: Farooq, U., & Jibran, A. Q. (2017). Firm Size as Moderator to Non-Linear Leverage-Performance Relation: An Emerging Market Review. Binus Business Review, 8(2), 99-106.
http://dx.doi.org/10.21512/bbr.v8i2.1711
ABSTRACT
The purpose of this research was to investigate the leverage-performance relation with moderating firm size in developing countries like Pakistan. Data were collected from 304 Pakistani non-financial firms for the period of 2005-2013. It is found that overall leverage-performance relation is negative for all types of firms. However, such losses are more prominent for small size firms. Results also show that the leverage-performance relation is nonlinear for medium and large size firms. However, these firms are not targeting optimal level and over-leveraging that ultimately decrease their profits. So, financial managers of small size firms should avoid debt financing while for large and medium size firms, managers need to adjust their debt ratio to its optimal level.
Keywords: firm size, leverage, performance, emerging market
INTRODUCTION
Capital structure is one of most studied areas
of corporate finance from last few decades (Gama & Galvão, 2012; Stretcher & Johnson, 2011). Despite
the abundant literature of capital structure, researchers are failed to consent to a single generalized theory. Although Modigliani and Miller (1958) proposed
irrelevancy theory and argued that firm value was
not affected by capital structure decisions, the theory was only applicable to perfect market conditions which were not subsisted in the real world. Myers (1984) also argued that in the absence of perfect market conditions, the capital structure became more relevant. Consequently, following irrelevancy theory, various theories are devised to explain the leverage-performance relation in real world practices.
However, some researchers document different
results and explain various rationales in this respect.
Some find positive leverage-performance relation
while others believe conversely and describe debt as negative connotation (Abor, 2010). Even some
researchers find insignificant or inconsistent results
in this respect (Fama & French, 1998; Lemmon & Zender, 2001). The reason behind such contradictory and inconsistent results is contingency and situational factors (Jermias, 2008). O’Brien (2003) also suggested that studying direct leverage-performance relationship could portray misleading conclusions due to situational and contingency factors. The magnitude and even direction of leverage-performance relation can change due to these factors. Therefore, it is important to consider moderating factors while studying leverage-performance relation.
Previously, most of the researches explore direct leverage-performance relation while few articles consider moderating factors in this context. For instance, Jermias (2008) and O’Brien (2003)
studied firm strategy and competitiveness, Simerly
and Li (2000) explored environment dynamism, and McConnell and Servaes (1995) argued that the growth opportunities were as potential moderators to
the leverage-performance relation. However, one of the firm specific less researched areas that can also moderate the leverage-performance relation is the firm
Firm size is viewed as significant factor that can affect the firm’s relationship with its external environment (Ezeoha, 2008). Since larger firms have more capacity to influence their stakeholders,
their role is more critical in corporate environment.
Similarly, these firms play significant role in
commercializing innovative ideas provided by small
firms. From macroeconomic perspective, economic
growth comes from the growth of large size concerns. Thus, with its increasing recognition to external
business environment, firm size can be considered as important factor to internal corporate finance decisions
(Voulgaris, Asteriou, & Agiomirgianakis, 2004). If these arguments are true, capital structure decisions and their consequences can also be affected
by firm size especially in developing countries
where environment is more dynamic. The dynamic environment can variably affect the competitiveness of
large and small firms that affect their capital structure
decisions. The purpose of this research is also to investigate the leverage-performance relationship
within contingency factor of firm size for Pakistani non-financial firms. In Pakistan, existing literature is
vacant from study of leverage-performance relation in
moderation of firm size. Hence, the first contribution
of this research is contextual where underlying topic is investigated in case of developing countries like
Pakistan for non-financial firms. However, some of the researches have explored firm size as moderator to the capital structure decisions in other countries (González & González, 2012; Ozenbas & Portes, 2011; Voulgaris
et al., 2004). They explore how different factors affect
financing decisions in small and large firms while
no attention is given to the consequences of these
financing decisions. Meanwhile, they do not search whether financing decisions due to moderating effect of size is profitable or not. For instance, if large or small firm has more or less debt then it becomes more important to know whether this financing decision will increase their firm value or not. This research is
intended to answer this successive research question
and focuses on the firm value when small, or large firms deploy more or fewer debt. Therefore, novelty
of this research revolves around twofold objectives which are contextual contribution and consequences
of financing decisions for small and large firms.
Originally, it was Modigliani and Miller (1958)
who first started the debate of leverage-performance relation. They argued that under efficient market
hypotheses such as neutral tax, no agency cost,
symmetric information and no transaction cost, the firm value was irrelevant of its capital structure. However,
the implication of irrelevancy theory is questioned due
to the non-existence of efficient market in real world (Harris & Raviv, 1991). After that, various researchers
have established the rationales for the implication of leverage-performance relation in the absence of
efficient market. Trade-off theory, pecking order
theory, and agency theory are three most prominent relevancy theories.
According to trade-off theory, benefits and
costs are associated with debt and firms should follow a targeted debt ratio where benefits are maximum against minimum loss (Graham, 2000; Kim & Sorensen, 1986). The benefit of debt is tax advantages.
Conversely, increased debt level augments the chance
of default and the cost of financial distress. Such costs
are segregated into two categories of direct cost of
financial distress and indirect cost of financial distress. However, firms can maximize their value to follow optimal debt ratio where its benefits are maximum
with minimum cost (Kim & Sorensen, 1986).
Similarly, agency theory articulates debt as positive connotation in term of controlling mechanism of agency problems (Jensen & Meckling, 1976). Managers are the agent of their shareholders, and they should work in the best interest of their principal.
However, conflict can arise between the objectives of
managers and their shareholders especially regarding
free cash flows (Jensen, 1986). It is argued that managers can use free cash flows for their personal benefits while deploying more debt can enforce them to invest such free cash flows to positive Net Present
Value (NPV) projects to meet new-fangled obligations. Moreover, creditors also impose debt covenants that
restrict managers to use these cash flows for their personal benefits. This implies that debt can act as
monitoring mechanism and increase managerial performances.
Conversely, pecking order theory postulates negative leverage-performance relationship. The
theory states that firms prefer the internal funds over debt and equity while financing the operations (Myers & Majluf, 1984). It suggests that firms follow hierarchy of financing options that start from retaining
earnings to external debts to equity. Since asymmetric information prevails in the market, it believes that investors will underprice newly issued shares. To
avoid such losses managers consider equity financing as a last resort. Thus, profitable firms prefer their internal funds to finance their operations that lead to
negative leverage-performance relation.
However, according to Ezeoha (2008), these
traditional capital structure theories do not endow
with sufficient explanation of capital structure for small, medium or large firms. The implication of these theories can vary within these categories of firm size because small and large firms contain different characteristics which can direct to different financial
decisions (Voulgaris et al., 2004). Subsequent part
explores how these categories of firm size differ from
each other and affect capital structure decisions.
Previous literature has explored various
assets than the small firms. Such characteristics make it easier for larger firms to access debt markets without difficulty. Thus, it is much possible that large firms deploy more debts than small firms.
However, the important thing is what will be the value of large and small firms if they deploy more
debt. The purpose of this research is to investigate the
role of firm size in the leverage-performance relation. Moderating effects of firm size in leverage-performance
relation is found to be ignored previously, although,
people can find research investigating
leverage-performance relation for SMEs without comparing
it with large firms. For instance, Abor (2010) studied leverage-performance relation for SMEs from Ghana
and South Africa and found that in general debt and especially long term debts were negatively associated
with firm profitability. On the contrary, Jaggi & Gul
(1999) suggested there were moderating effects of size to the relationship between investment opportunities,
free cash flow and debt. Their results revealed that
there was a positive relationship between debt and free
cash flows for low investment opportunity when firm size was high. They found that size was a significant
moderator to the relation between investment
opportunities, free cash flow and performance.
González and González (2012), and Voulgaris et al. (2004) examined determinants of capital structure
to the contingency of firm size, but they did not
consider it with leverage-performance relation. This research proposed that leverage-performance relation
could vary within different firm size. Since large firms generated high and less volatile profits with strong
liquidity, their risk was also lower comparatively. Similarly, information is less asymmetric
in large firms that also decrease their uncertainty level. Moreover, large firms hold high tangible
assets that they can use as collateral for external
debt. Consequently, these large firms access the debt
market easily at lower cost to gain tax advantages. Thus, in accordance with the trade-off theory, one can anticipate positive leverage-performance relation for
large size firms. Agency theory also describes such
positive leverage-performance relationship for large
firms. Since large firms generate more profits and hold high free cash flows, managers can use it for their benefits. To avoid such agency issue, debt can act
as monitoring mechanism and enforce managers for
better performances. Hence, the first hypothesis of this
research is as follows.
H1: There is positive relation between debt ratio
and firm profitability for larger firms.
On the contrary, small firms contain low liquidity and low profits with more volatility that increases its risk premium. Small firms show more exposure
to market dynamism that increases its idiosyncratic risk, and ultimately excesses return comparatively. This argument can be more prominent in developing countries where the environment is more volatile. In Pakistan, high-risk premium that increases the cost of
debt for small firms can also be predicted. Moreover, information is more asymmetric for small firms that make it difficult to access the debt market at lower cost. Thus, it is possible that small firms can not surpass tax benefits against the high cost of debt. Hence, the
second hypothesis of this research is as follows.
H2: There is negative relation between debt ratio
and firm profitability for small firms.
METHODS
To conclude the proposed theory, 304
nonfinancial firms listed at KSE are selected for the
period of 2005 to 2013. Selected panel data include 2.557 observations and are collected from annual
publications of balance sheet analysis of nonfinancial firms published by State Bank of Pakistan. However,
this selection of the sample is made after excluding
financial firms, default firms, firms which report negative equity, and firms’ observations which show zero sales. The financial sector is excluded because
they have different characteristics especially its
operations. Default firms are also excluded because these firms normally show continuous deteriorating performances due to financial distress. Their inclusion can affect the comparative analysis of debt financing on firm performances. The reason to exclude negative
equity observations is due to accumulated losses more than share capital that can mislead the results. Moreover, with zero sales, no activity is performed and shows no value to their performances and should not be the part of analysis.
To assess the moderating effects of firm size on the leverage-performance relation, fixed effect model
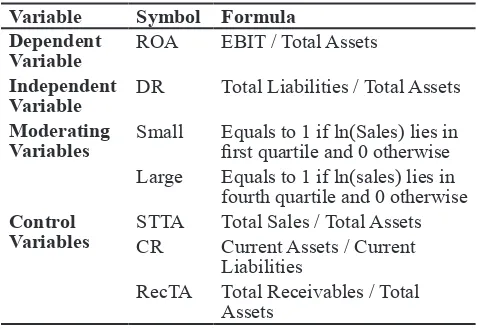
is used. Table 1 shows the detail of variables used in the proposed model. The dependent variable is Return on Assets (ROA) while independent variables include Debt Ratio (DR) and its cross effects with small and
large firm size. Medium firm size is taken as the
reference category, so its cross effect is not included. Firms are categorized as small, medium and large on the basis of natural log of their sales (ln (Sales)). Firms
whose values lie within the first quartile of ln (Sales) are considered as small firms. Similarly, firms who lie in the fourth quartile are labeled as large firms while
remaining second and third quartile are considered
as medium size firm. This methodology is consistent with González and González (2012) who categorized firms on the basis of quartiles of ln (sales).
ROAit= α + β 1DRit + β 2DRit*Small+β 3DRit*Large +
β 4STTAit + β 5CRit + β 6RecTAit + Ut + Vi + εit” (1)
Proposed model in Equation 1 also includes three control variables of Sales to Total Assets (STTA), Current Ratio (CR), and Receivables to Total Assets (RecTA). Ut and Vi represent the unobserved
variations due to firm variants and time specific of
models. To check the reliability of results, various diagnostics as proposed by Torres-Reyna (2007)
are also conducted. It is notable that coefficient of DR (β1) represents the slope of debt ratio for the
reference category of medium firms. However, for small and large firms, DR becomes (β1 + β2) and (β1
+ β3) respectively. β2 and β3 show marginal effects of
debt when a firm is small and large respectively as compared to medium firms. These marginal effects and their slopes explore whether debt financing is optimal decision for small, medium and large firms or
not. Consequently, hypotheses of this research could
also be testified.
Table 1 Definition of Variables
Variable Symbol Formula Dependent
Variable
ROA EBIT / Total Assets
Independent Variable
DR Total Liabilities / Total Assets
Moderating Variables
Small Equals to 1 if ln(Sales) lies in first quartile and 0 otherwise Large Equals to 1 if ln(sales) lies in
fourth quartile and 0 otherwise Control
Variables
STTA Total Sales / Total Assets CR Current Assets / Current
Liabilities
RecTA Total Receivables / Total Assets
RESULTS AND DISCUSSIONS
Descriptive statistics for the sampled data are presented in Table 2. Data is categorized on
size firms which are small, medium, and large. The descriptive analysis shows that small firms earned low profitability of only 3,9% as the average ROA compared to 10,4% and 14,1% ROA of medium and large firms respectively. Moreover, Standard Deviation (SD) of ROA for small firms is also high variations
of 14% even with lower average returns. Thus, it can be concluded that comparatively small firms contain fewer profits with more variation that is consistent with prior discussion. However, not much difference
is found between average Debt Ratio (DR) of small
and large firms, but it is with more variations for small firms.
Results also describe usage of high Short Term Debt Ratio (STDR), calculated as the ratio of current
liabilities to total assets) regardless the type of firm.
One of the reasons behind the over reliance on current
liabilities can be attributed to the inefficiencies of
capital markets in Pakistan. Capital markets especially bond markets are not developed in Pakistan that
confines the financing options to short term instruments
generally (Raza, Aslam, & Farooq, 2013). The results
also reveal that small firms have documented better liquidity (1,560) as than medium firm (1,327) and even large firms (1,494). This can be because more investment in current assets used by small firms as a
short term debt ratio for both the categories does not
differ significantly. STTA for small firms also shows
low statistics and indicates that more investment in
working capital is not utilized optimally. Hence, it can be concluded that small firms contain low and volatile profits, better liquidity, and low asset efficiencies than large firms in Pakistani non-financial firms.
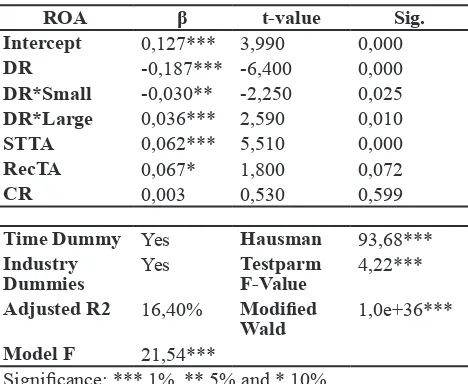
Table 3 provides the results of the proposed model. Because the data is panel, it is important to
decide that whether fixed effect model has appropriate or random effect. The researchers conduct Hausman
test to examine the null hypothesis that estimations
of both fixed and random effect models are same. Significant value shows that there are substantial differences in the coefficients estimated by fixed and random effect models and one should select fixed
effect model.
Table 3 also shows that Hausman test is significant and confirms that fixed effect is more
appropriate compared to random effect model. The
researchers also conduct diagnostics test for fixed
model as explained by Torres-Reyna (2007). To check
Table 2 Descriptive Statistic
ROA DR STDR STTA CR RecTA
Mean Small 0,039 0,555 0,409 1,073 1,560 0,096
Medium 0,104 0,593 0,423 1,253 1,327 0,095
Large 0,141 0,560 0,416 1,450 1,494 0,110
SD Small 0,140 0,237 0,215 1,928 1,867 0,123
Medium 0,097 0,191 0,168 0,688 1,062 0,094
Large 0,124 0,191 0,189 1,041 1,013 0,130
Max Small 1,772 0,996 0,959 21,062 14,600 1,183
Medium 0,604 1,046 0,956 4,525 9,579 0,565
Large 0,633 0,999 0,972 7,021 12,229 0,704
Min Small -1,213 0,006 0,000 0,000 0,077 0,000
Medium -0,553 0,063 0,000 0,118 0,169 0,000
Large -1,236 0,024 0,024 0,182 0,214 0,000
whether time dummies are important to be included, testparm test is used. Results show that f-value of
testparm test is significant and using time dummies to
the proposed model is more appropriate.
Because Hausman test is significant, there is no
need to conduct Breusch-Pagan Lagrange Multiplier for the random effect model. The other important
assumption of fixed effect model is cross sectional dependence of residuals. However, the cross section
dependence assumption is important for the macro panel (Torres-Reyna, 2007). Panel data used is micro data with less number of years and high numbers of entities. Therefore, cross sectional dependency is not critical. The researchers use Pesaran CD test although the results are not calculated due to few number of years across a high number of entities. Similarly, another assumption of serial correlation is not critical for micro data (Torres-Reyna, 2007).
The assumption of heteroskedasticity is checked by modifying Wald test in STATA. It is
found that chi2 is highly significant and rejects the
null hypothesis with constant variances. This shows that the heteroskedasticity prevails and can affect
t-values of each variable. However, to control this, the researchers use robust fixed effect model as proposed by Torres-Reyna (2007). Similarly, significant Model
of f-value (44,80) concludes that overall model is
significant variations in the dependent variable. So, verification of assumptions and taking appropriate
measures accordingly indicates that results obtained are reliable. Subsequent part interprets the results obtained from proposed model.
Table 3 Size and Leverage-Performance Relation
ROA β t-value Sig.
Time Dummy Yes Hausman 93,68***
Industry Dummies
Yes Testparm
F-Value
4,22***
Adjusted R2 16,40% Modified Wald
1,0e+36***
Model F 21,54***
Significance: *** 1%, ** 5% and * 10% (Source: Authors’ calculation)
Results reveal that all the variables except a
control variable of CR provide significant results. It shows that for medium firms, a unit change in DR decreases its ROA by 18,7% or -0,187 on average. For small firms, these losses further decrease by 3% or -0,030. Consequently, DR in small firms becomes
-0,217 (-0,187-0,030). Low and volatile earnings and more asymmetric information can be the main reason of this negative marginal effect. Ozenbas and Portes (2011) argued that cost of debt was high for small
firms which credit was constrained due to asymmetric
information. Voulgaris et al. (2004) also argued that asymmetric information made the lenders lend with high cost of debt or collateral.
Conversely, marginal effect of large firms is
positive and shows the increase in DR also increase
its profits by 3,6% compared to the medium firms. Then, DR for large firms is -0,151 (-0,187 + 0,036).
The positive marginal effect can be from the better access to debt market with less asymmetric
information. Thus, overall debt financing negatively affects the firms’ profits for all three types of firms while such losses are more prominent for small firms.
This negative leverage-performance relation can be explained with pecking order theory that argues the preference of internal funds. Similarly, Zeitun and Tian (2007) provided another argument that in developing countries, companies were often overleveraged to solve its problems which ultimately decreased the performances.
No study till date can define the optimal level
of capital structure. This increases the probability that
firms do not get the optimal level to gain its maximum benefits with the minimal cost of debt and become
overleveraged. This argument appears to be more relevant to agency problem persists in developing
countries, especially for large firms containing high free cash flows. Moreover, the implication of the
pecking order theory can also be negated because of
positive marginal effects of large firms containing
more internal funds. If the argument of overleverage is accepted, the leverage-performance relation will be
nonlinear. Some level of DR and its benefits exceed
its cost while the level cost of debt also surpasses its
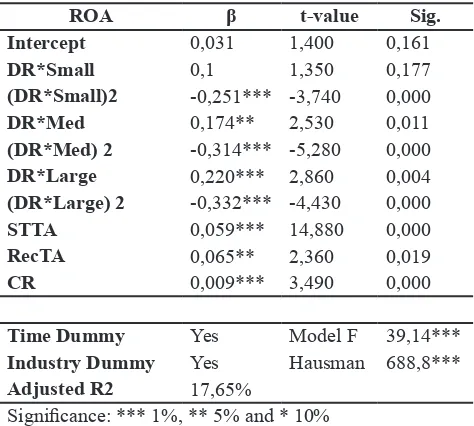
benefits. Table 4 provides the results of fixed effect
model with squares of cross effects of DR of three
types of firms as proposed in the following model. The
quadratic nonlinear leverage-performance relation is
expected for the small, medium and large firm, so its
squares are used. The equation is as follows.
ROA = α + β 1DRit*Small + β2 (DR*Small)2 + β
Results reveal that all cross effects of DR
are significant except for small firms. Insignificant
DR*Small accepts the null hypothesis that its beta equals to zero. Conversely, square of cross effect (DR*Small)2 is significant and negative. Hence, the leverage-performance relation is linear and negative for
small firms. It is consistent with the second hypothesis
proposed in this research. Reasons behind this can be the volatile and low earnings with asymmetric
of pecking order theory can also be the reason of
negative linear relation for small firms. Results from
descriptive analysis indicate better liquidity position
especially in term of current assets for small firms. It is much possible that small firms rely on its internal
funds rather than external debt.
Nevertheless, the leverage-performance relation
is found nonlinear for medium and large firms. It
also shows that cross effects of DR for medium and
large firms are positive while its squares are negative. These results are also significant. This proves that
initially, the leverage-performance relation is positive
for medium and large firms, and after a particular debt level, it becomes negative. Specifically, initially increase in DR, ROA of medium and large firms is increased by 0,174 and 0,220 respectively. However,
after a particular DR increase, it decreases the ROA
of medium and large firms by -0,314 and -0,332
respectively. That particular debt level is the optimal
DR where profits are maximized. Therefore, the first hypothesis is partially accepted as for large firms that
the leverage-performance relation is positive in a particular debt level.
Table 4 Nonlinear Leverage-Performance and Size
ROA β t-value Sig.
Intercept 0,031 1,400 0,161
DR*Small 0,1 1,350 0,177
(DR*Small)2 -0,251*** -3,740 0,000
DR*Med 0,174** 2,530 0,011
(DR*Med) 2 -0,314*** -5,280 0,000
DR*Large 0,220*** 2,860 0,004
(DR*Large) 2 -0,332*** -4,430 0,000
STTA 0,059*** 14,880 0,000
RecTA 0,065** 2,360 0,019
CR 0,009*** 3,490 0,000
Time Dummy Yes Model F 39,14***
Industry Dummy Yes Hausman 688,8***
Adjusted R2 17,65%
Significance: *** 1%, ** 5% and * 10% (Source: Authors’ calculation)
From the process of optimization, it can see the optimal DR. The process shows the step in the optimization process. Taking the derivative of proposed model regarding DR, the result is found.
ΔROA = β1 Small + 2 β2DR (Small) + β3 Med + 2 β4 DR(Med)2 + β
5 Large + 2 β6 DR(Lar ge)2 (3)
ΔDR
Since in optimal level f’ (ROA) will be zero, the following equation is extracted for DR where ROA is at its optimal value.
DR = -β1 Small-β3 Med-β5 Large 2 β2 (Small)2+2 β
4 (Med) 2+2 β
6 (Large) 2 (4)
By using table 4, optimal level for small firms is as
follows.
DR = -β1 = 0 = 0 → 2 β2 -0,251
Relation is linear and no optimal level (5)
For medium size optimal level will be as follows.
DR = -β3 = - 0,174 = 0,2771 or 27,71% 2 β4 2 (-0,314)
(6)
For large firms, optimal level will be
DR = -β5 = - 0,220 = 0,3313 or 33,13% 2 β6 2 (-0,332)
(7)
Thus, for medium firms, its ROA will increase
in line with the increase in DR till its value reaches
to 0,2771, while after this, the level of DR profits
starts to decrease. This implies that Pakistani medium
non-financial firms should target 0,2771 of DR on average to maximize its value. However, in practice, the average DR for medium firms is 0,593 as found
in Table 2 of descriptive statistics. Similarly, for large
firms, the desired DR is 0,3313 while in practice its
average DR is 0,560 as found in Table 2. Thus, in
general, large firms are also far away from its optimal
level. This indicates that on average medium and large
firms are over-leveraged that could be the reason of
overall negative relation found in Table 3.
These results also reveal an important implication of trade-off theory. Results show that optimal DR for
the medium firm is 27,71% while for large firms is 33,31%. This proves that optimal level of DR changes for different types of firms. Therefore, modified
trade-off theory proposed states that targeted optimal level under trade-off theory is not a general value, but it can
depend on firm’s specific moderators such as firm size.
There are four important implications based on that. First, the leverage-performance relation is negative
and linear for small firms. Second, the
leverage-performance relation is nonlinear for medium and large
firms. Third, in practice medium and large firms do not
follow optimal level and over-leveraging that decrease
its profits. Last, optimal DR is not a generalized value and depends on firm’s specific moderations.
CONCLUSIONS
and large non-financial firms. It postulates that debt financing by large firms increase its profits while same financing decision by small firms does conversely.
Regression analysis accepts both of the proposed
hypotheses. Results show that debt by small firms affects its profits severely while for large size firms
this adverse effect is found the minimum. It is argued
that small firms contain more asymmetric information
with low and volatile returns that make debt more
costly. Conversely, large firms have better access to
debt market with less asymmetric information so it deploys debt with less cost comparatively. Results also
state that marginal effect of large firms is positive but
overall DR still shows negative results. It is suggested
that firms overleveraged in pursuit of the optimal level that decreases the overall profits.
Moreover, the leverage-performance relation
is also found nonlinear for medium and large firms. Meanwhile, for small firms, it is linear and negative. Therefore, debt financing always affects the value of small size firms negatively. However, for medium and large firms, it affects a certain level while positively. After that, the profits start to decrease. Results describe that debt financing increases medium firms’ profits till the DR reaches 0,2771. Then, these profits
start to decrease. Similar results are found in large
firms with the optimal level of 0,3313. However,
descriptive statistics show that in real practice medium
and large firms have the average debt ratio of 0,59 and 0,56 respectively. Thus, both large and medium firms
should not target optimal level and be over-leveraged itself.
The outcome of this research has strong practical
implications as it will help financial managers in choosing appropriate financing decisions for different types of firms in developing countries like Pakistan. It is recommended that financial managers of small firms should avoid debt. However, in medium and large firms, optimal targeted DR should be followed to
avoid the overleveraging problem.
REFERENCES
Abor, J. (2010). Debt policy and performance of SMEs evidence from Ghanaian and South African.
The Journal of Risk Finance, 8(4), 364-379.
doi:10.1108/15265940710777315
Ezeoha, A. E. (2008). Firm size and corporate financial-leverage choice in a developing economy: Evidence from Nigeria. The Journal of Risk Finance, 9(4), 351-364. doi:10.1108/15265940810895016
Fama, E., & French, K. (1998). Taxes, financing decisions, and firm value. Journal of Finance, 53(2), 819-843. Gama, A. P. M., & Galvão, J. M. M. (2012). Performance,
valuation and capital structure : Survey of family firms. Corporate Governance, 12(2), 199-214. doi:10.1108/14720701211214089
González, V. M., & González, F. (2012). Firm size and capital structure: Evidence using dynamic panel data. Applied Economics, 44(36), 4745-4754. doi:1 0.1080/00036846.2011.595690
Graham, J. R. (2000). How big are the tax benefits of debt?
Journal of Finance, 55(5), 1901-1941.
Harris, M., & Raviv, A. (1991). The theory of capital structure. The Journal of Finance, 46(1), 297-355. Jaggi, B., & Gul, F. A. (1999). An analysis of joint effects
of investment opportunity set, free cash flows and size on corporate debt policy. Review of Quantitative
Finance and Accounting, 12(4), 371-381.
Jensen, M. (1986). Agency costs of free cash flow, corporate finance and takeovers. American Economic Review, 76(2), 323-329.
Jensen, M., & Meckling, W. (1976). Theory of the firm, managerial behavior, agency costs and ownership structure. Journal of Financial Economics, 3(1), 30-60.
Jermias, J. (2008). The relative influence of competitive intensity and business strategy on the relationship between financial leverage and performance. The
British Accounting Review, 40, 71-86. doi:10.1016/j.
bar.2007.11.001
Kim, W. S., & Sorensen. (1986). Evidence on the impact of the agency costs of debt on corporate debt policy.
Journal of Financial and Quantitative Analysis, 21(2), 131-144.
Lemmon, & Zender. (2001). Looking under the lamppost: An empirical examination of the determinants of
capital structure (No. 2192502). Retrieved from
http://leeds-faculty.colorado.edu/Zender/papers/ LZjun_07_01.pdf
McConnell, J., & Servaes, H. (1995). Equity ownership and the two faces of debt. Journal of Financial
Economics, 39(1), 131-157.
Modigliani, F., & Miller, M. (1958). The cost of capital, corporate finance and the theory of investment.
American Economic Review, 48(1), 261-297.
Myers, & Majluf, N. (1984). Corporate financing and investment decisions when firms have information that investors do not have. Journal of Financial
Economics, 13(1), 187-221.
Myers, S. C. (1984). The capital structure puzzle. The Journal
of Finance, 39(3), 575-592. doi:10.2307/2327916
O’Brien, J. (2003). The capital structure implication of pursuing a strategy of innovation. Strategic
Management Journal, 24(2), 415-431.
Ozenbas, D., & Portes, L. S. V. (2011). Does firm size matter? The relationship between firm level volatility, GDP volatility and capital structure decisions for firms of different size groups. The Business Review, 17(2), 35-41.
Raza, H., Aslam, S., & Farooq, U. (2013). Financing pattern in developing nations empirical evidence from Pakistan. World Applied Sciences Journal, 22(9), 1279-1285. doi:10.5829/idosi.wasj.2013.22.09.40 Simerly, R., & Li, M. (2000). Environmental dynamism,
financial leverage and performance: a theoretical integration and an empirical test. Strategic
Management Journal, 21(1), 31-49.
Stretcher, R., & Johnson, S. (2011). Capital structure: Professional management guidance.
Managerial Finance, 37(8), 788-804.
Torres-Reyna, O. (2007). Panel data analysis fixed and
random effects using Stata (v. 4.2). Retrieved from
http://www.demonish.com/cracker/1426308968_ fc8b5f133d/panel101.pdf
Voulgaris, F., Asteriou, D., & Agiomirgianakis, G. (2004). Size and determinants of capital structure in the Greek manufacturing sector. International
Review of Applied Economics, 18(2), 247-262.
doi:10.1080/0269217042000186714
Zeitun, R., & Tian, G. G. (2007). Capital structure and corporate performance : Evidence from Jordan.
Australasian Accounting Business and Finance