74
from the research in the field of study. The data were the result of students’ speaking score, the result of students’ confidence, comparison between speaking
scores and self-confidence scores, the result of normality and homogeneity, testing of normality, testing of homogeneity, linear regression, testing hypothesis using manual calculation, testing hypothesis using SPSS program, interpretation of the result, and discussion.
A. The Result of Students’ Speaking Score
The problem of the study;is there relationship between self-confidence level and students’speaking ability at the fourth semester of English study program of IAIN Palangka Raya academic year 2013/2014? To answer the research problem the correlation “r” product momentformula was applied to see the significance correlation between the students’ confidence and their speaking ability.
In this study, the writer did twice observation to saw the students’ learning activity in their speaking class. The first observation was held on Thursday, April 29, 2015; at 9.00 a.m. up to 11.00 a.m. in class A and the second observation was held on Monday, May 4, 2015; at 9.00 a.m. up to 11.00 a.m. in class D.
The last test, for D class who consisted to the class who consisted of 16 students, but all of them, only17 students as try out group and 40 students as the real sample because several students hindered to join speaking test.
Table 4.1
The Students’ Speaking Score
No. Initial Score 1 Score 2 Final Score Grade
1 DR 84 84 84 Very Good
2 MI 81 83 82 Very Good
3 KW 90 84 87 Very Good
4 RJ 84 82 83 Very Good
5 NADP 93 87 90 Very Good
6 DSW 84 86 85 Very Good
7 EAA 83 83 83 Very Good
8 ES 80 82 81 Very Good
9 SH 86 80 83 Very Good
10 ST 89 85 87 Very Good
11 SM 92 90 91 Very Good
12 AH 80 80 80 Good
13 RHI 87 85 86 Very Good
14 YS 79 79 79 Good
15 ESA 79 79 79 Good
16 IR 81 83 82 Very Good
17 STI 80 80 80 Good
18 HW 84 78 81 Very Good
19 DKN 80 80 80 Good
20 RN 75 81 78 Good
21 FMR 79 79 79 Good
22 STA 91 91 91 Very Good
23 MT 92 86 89 Very Good
24 ANA 89 85 87 Very Good
25 RHY 84 80 82 Very Good
26 FM 78 76 77 Good
27 AAI 86 80 83 Very Good
28 RA 92 96 94 Very Good
29 NS 83 85 84 Very Good
30 RAA 85 91 88 Very Good
31 ANH 78 78 78 Good
No. Initial Score 1 Score 2 Final Score Grade
33 RL 89 79 84 Very Good
34 MA 79 79 79 Good
35 BAF 87 79 82 Very Good
36 SW 87 83 85 Very Good
37 AN 86 84 85 Very Good
38 DS 96 90 93 Very Good
39 RR 87 91 89 Very Good
40 BL 85 81 83 Very Good
Highest score 94
Lowest score 77
Mean 83.9
Standard deviation 4.31
Based on the data above, it can bee seen that the students’ highest score was 94 and the students’ lowest score was 77. To determine the range of score, the class interval the writer calculated using formula as follows:
The highest score (H) = 94 The lowest score (L) = 77 The total range (R) = H-L+1
= 94 – 77 + 1 = 18
The class interval = R
t −10−20
= hdt tt −20
= 20
Table 4.2
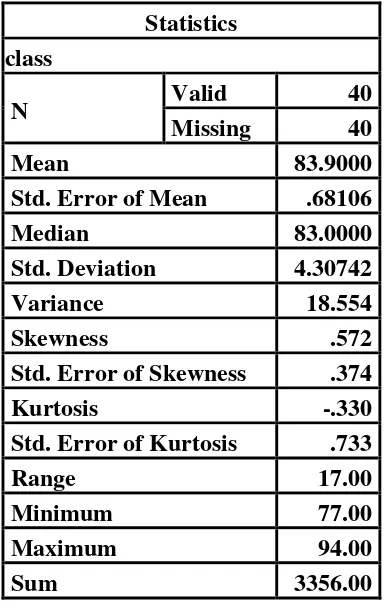
The Table Calculation of Mean, Median, Modus, Standard Deviation, and Standard Error of Mean of the Speaking Test Scores Using SPSS 16.0
Program Statistics class
N Valid 40
Missing 40
Mean 83.9000
Std. Error of Mean .68106
Median 83.0000
Std. Deviation 4.30742
Variance 18.554
Skewness .572
Std. Error of Skewness .374
Kurtosis -.330
Std. Error of Kurtosis .733
Range 17.00
Minimum 77.00
Maximum 94.00
Sum 3356.00
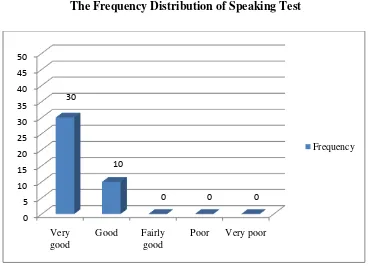
Figure 4.1
The Frequency Distribution of Speaking Test
Beside that technical of scoring through four scales above, the researcher also made rating classification which used to give students obtained. The following was rating scale classification:58
Rating Scale Classification
81 – 100 5 Very Good
61 – 80 4 Good
41 – 60 3 Fairly good
21 – 40 2 Poor
0 – 20 1 Very Poor
It can be seen from figure, three were 30 students got score 81 – 100 it indicated as very good, three were 10 students got score 77 – 80 it indicated as good.
58
Daryanto, EvaluasiPendidikan, Jakarta: RinekaCipta, 2005, p. 211
0 5 10 15 20 25 30 35 40 45 50
Very good
Good Fairly good
Poor Very poor
30
10
0 0 0
B. The Result of Students’ Confidence Test
The next step the writer did test for self-confidence, there are three times for confidence test , first test was held on Monday, May 25, 2015; at 09.00 a.m. up to 11.00 a.m. second test held on Wednesday, May 27, 2015; at 12.30 p.m. up 13.00 p.m. and the third Thursday, May 28, 2015; at 07.00 a.m. up to 08.30 a.m. The result of self-confidence test as follows:
Table 4.3
The Students’ Score of Self-Confidence Test
No Initial Item Total
28 RA 5 5 5 3 5 5 5 5 5 5 4 3 4 5 4 5 4 4 3 5 89 29 NS 4 4 5 2 4 5 2 4 5 4 5 4 4 4 3 4 3 3 4 4 77 30 RAA 4 5 1 5 3 4 2 2 3 4 3 5 4 3 5 5 2 3 2 5 70 31 ANH 4 4 2 3 4 4 3 4 4 4 3 3 3 5 3 4 3 4 2 4 70 32 RKU 5 5 4 2 4 4 3 5 5 3 2 4 3 4 4 4 2 5 5 4 77 33 RL 4 4 4 4 4 5 3 5 4 4 4 3 4 4 4 4 4 4 4 5 81 34 MA 4 5 4 4 4 5 3 5 4 4 5 3 4 4 4 4 4 4 4 4 82 35 BAF 4 4 4 3 2 4 4 4 4 3 3 4 4 5 5 2 4 4 5 5 77 36 SW 4 5 4 4 3 4 3 4 4 4 4 5 3 4 3 3 3 4 5 4 77 37 AN 4 5 1 2 5 5 4 5 3 5 2 4 5 5 5 3 4 4 4 5 80 38 DS 4 5 5 5 3 5 4 5 3 5 4 5 3 3 3 4 5 5 3 4 83 39 RR 4 4 5 5 5 5 2 2 5 4 2 2 5 4 5 5 3 3 4 4 78 40 BL 2 4 3 4 4 5 2 4 3 4 3 3 1 1 3 4 2 2 2 4 60
Based on the data above, it can be seen that the students’ highest score was 89 and the students’ lowest score 57. To determine the range of score, the class
interval of temporary, the writer calculated using formula as follows: The highest score (H) = 89
The Lowest score (L) = 60 The total range (R) = H-L+1
= 89-60+1 = 30 The class interval = R
t = 10−20
= 30
10 = 3
= 3
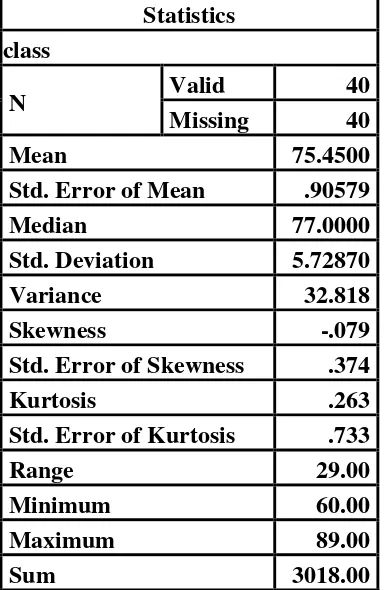
Table 4.4
The Table Calculation of Mean, Median, Modus, Standard Deviation, and Standard Error of Mean of the Self-Confidence Test Scores Using SPSS 16.0
Program Statistics class
N Valid 40
Missing 40
Mean 75.4500
Std. Error of Mean .90579
Median 77.0000
Std. Deviation 5.72870
Variance 32.818
Skewness -.079
Std. Error of Skewness .374
Kurtosis .263
Std. Error of Kurtosis .733
Range 29.00
Minimum 60.00
Maximum 89.00
Sum 3018.00
To know the interpreted of confidence each student the writer calculated the percentage of each students, it can be seen as follows:
Table 4.5
The Interpreted of Self Confidence No Initial Name Score (%) Interpretation
1 DR 80 Strong
2 MI 86 Very Strong
3 KW 70 Strong
4 RJ 75 Strong
5 NADP 82 Very Strong
6 DSW 77 Strong
7 EAA 74 Strong
9 SH 80 Strong
10 ST 80 Strong
11 SM 80 Strong
12 AH 77 Strong
13 RHI 71 Strong
14 YS 70 Strong
15 ESA 70 Strong
16 IR 77 Strong
17 STI 70 Strong
18 HW 77 Strong
19 DKN 77 Strong
20 RN 70 Strong
21 FMR 70 Strong
22 STA 80 Strong
23 MT 75 Strong
24 ANA 69 Strong
25 RHY 70 Strong
26 FM 70 Strong
27 AAI 70 Strong
28 RA 89 Very Strong
29 NS 77 Strong
30 RAA 70 Strong
31 ANH 70 Strong
32 RKU 77 Strong
33 RL 81 Very Strong
34 MA 82 Very Strong
35 BAF 77 Strong
36 SW 77 Strong
37 AN 80 Strong
38 DS 83 Very Strong
39 RR 78 Strong
40 BL 60 Moderately
Highest score 89
Lowest score 60
Mean 75.45
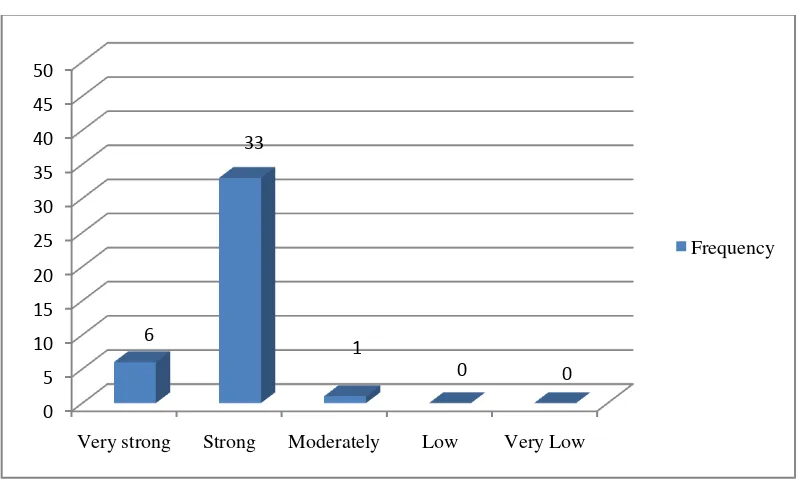
The interpretation score was rated as follow : 0% - 20% = very low
21% - 40% = low
41% - 60% = moderately 61% - 80% = strong 81% - 100% = very strong
Figure 4.2
The Frequency Distribution of Self-Confidence Score of Each students.
It can be seen from the figure above, the students score of self-confidence, there were 6 students that indicated as very strong confidence, there were 33 students that indicated as strong confidence, there was 1 student that indicated as moderately confidence.
0 5 10 15 20 25 30 35 40 45 50
Very strong Strong Moderately Low Very Low
6
33
1
0 0
C. Comparison Between Speaking Scores and Self-Confidence Scores
Having described from the specification table in previous page it can be known the comparison between speaking score and self-confidence score.
Based on the test have been constructed, the comparison between speaking scores and self-confidence scores followingways:
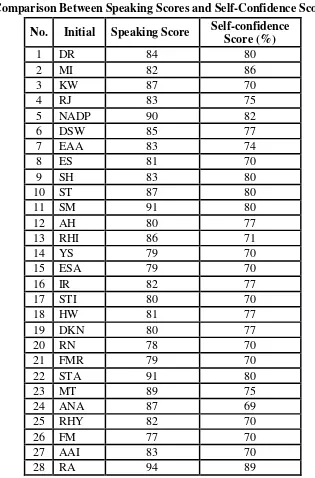
Table 4.6
Comparison Between Speaking Scores and Self-Confidence Scores No. Initial Speaking Score Self-confidence
Score (%)
1 DR 84 80
2 MI 82 86
3 KW 87 70
4 RJ 83 75
5 NADP 90 82
6 DSW 85 77
7 EAA 83 74
8 ES 81 70
9 SH 83 80
10 ST 87 80
11 SM 91 80
12 AH 80 77
13 RHI 86 71
14 YS 79 70
15 ESA 79 70
16 IR 82 77
17 STI 80 70
18 HW 81 77
19 DKN 80 77
20 RN 78 70
21 FMR 79 70
22 STA 91 80
23 MT 89 75
24 ANA 87 69
25 RHY 82 70
26 FM 77 70
27 AAI 83 70
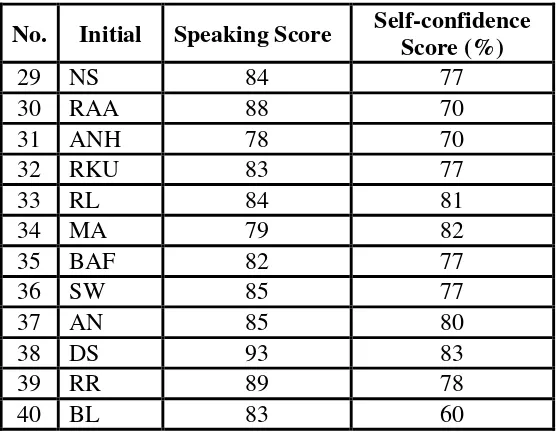
No. Initial Speaking Score Self-confidence Score (%)
29 NS 84 77
30 RAA 88 70
31 ANH 78 70
32 RKU 83 77
33 RL 84 81
34 MA 79 82
35 BAF 82 77
36 SW 85 77
37 AN 85 80
38 DS 93 83
39 RR 89 78
40 BL 83 60
D. The Result of Normality and Homogeneity a. Testing of Normality
One of the requirements in this research was the test of normality assumption. Related to data normality, Irianto states:
“The data of population will be normal if the mean same with the modus
and median. It means some of scores gather in the middle position, meanwhile the frequency of average and low score show descent that more balance. Because of the descent of the low scores frequency and the high score is balance, so that the down of curve line to right and left will be balance”59
Table 4.7
Test of Normality Distribution Test One-Sample Kolmogorov-Smirnov Test
Speaking Self-confidence
N 40 40
Normal Parametersa,b Mean 83.9000 75.4500
59
Std. Deviation
4.30742 5.72870
Most Extreme
Differences
Absolute .133 .179
Positive .133 .179
Negative -.060 -.157
Kolmogorov-Smirnov Z .840 1.134
Asymp. Sig. (2-tailed) .481 .153
a. Test distribution is Normal. b. Calculated from data.
b. Testing of Homogeneity
In Testing the homogeneity of the scores test on SPSS for windows was employed. Firstly, the hypothesis was stated as follows:
Ha: The variance of Speaking and self-confidence was homogeneous.
After that, the homogeneity variance was computed. The next steps compared the result of homogeneity test with the level of significance at 0.05. Table below showed the result of homogeneity test.
Table 4.8
Test of Homogeneity of Variance Result on the Test Score Speaking and Self-confidence
Test of Homogeneity of Variances score
Levene Statistic df1 df2 Sig.
2.381 1 78 .127
the null hypothesis of speaking score could be accepted in which the variance of self-confidence in both classes were homogeneous.
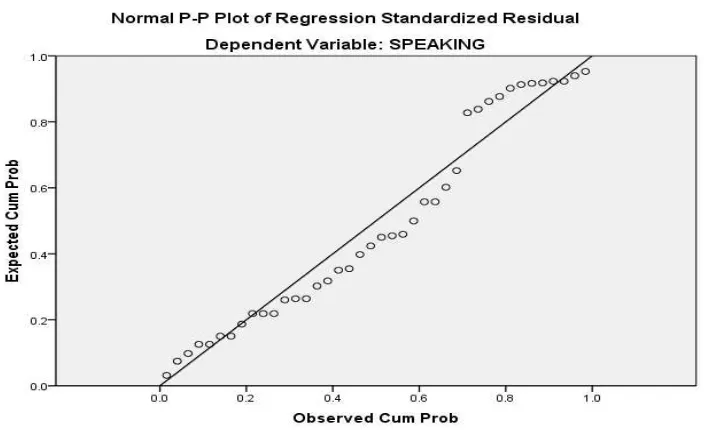
E. Linear Regression
To describe the linear association between quantitative variables, a statistical procedure called regression often used to construct a model. The following was the data of self-confidence and speaking ability test scores in the present study. The scatterplot could reveal the extent of linear assosiation between variables. The following was scatterplot about the data linear test in the present study.
Hartonostated the data are named by linear if data points spread closely and draw straight line. On the other hand, if the data points spread disorderly and do not draw a straight line, it meant the data do not have linear or non-linear.60 From the scatter above, the data points have shown a straight line from the left
60
bottom to the right up corner. It means the data in the present study had linear association between variable x (self-confidence level) and variable y (speaking ability). As the result, the data in the present study can be analyzed by using product moment correlation because had linear association between variables. F. Testing Hypothesis Using Manual Calculation
To found out the correlation between self-confidence level and students’ speaking ability at the fourth semester of English study program used the product moment formula as below :61
rxy = 𝑁∑𝑋𝑌−
(∑𝑋)(∑𝑌)
𝑁∑𝑋2− ∑𝑋 2 {𝑁∑𝑌2− ∑𝑌 2}
rxy : Table coefficient of correlation
∑ 𝑋 : Total value of score X ∑ 𝑌 : Total value of score Y
∑ 𝑋𝑌 : Multiplication Result between Score X and Y N : Number of studentsof the study.
No. X Y X2 Y2 XY
1 80 84 6400 7056 6720
2 86 82 7396 6724 7052
3 70 87 4900 7569 6090
4 75 83 5625 6889 6225
5 82 90 6724 8100 7380
6 77 85 5929 7225 6545
7 74 83 5476 6889 6142
8 70 81 4900 6561 5670
9 80 83 6400 6889 6640
61
10 80 87 6400 7569 6960
11 80 91 6400 8281 7280
12 77 80 5929 6400 6160
13 71 86 5041 7396 6106
14 70 79 4900 6241 5530
15 70 79 4900 6241 5530
16 77 82 5929 6724 6314
17 70 80 4900 6400 5600
18 77 81 5929 6561 6237
19 77 80 5929 6400 6160
20 70 78 4900 6084 5460
21 70 79 4900 6241 5530
22 80 91 6400 8281 7280
23 75 89 5625 7921 6675
24 69 87 4761 7569 6003
25 70 82 4900 6724 5740
26 70 77 4900 5929 5390
27 70 83 4900 6889 5810
28 89 94 7921 8836 8366
29 77 84 5929 7056 6468
30 70 88 4900 7744 6160
31 70 78 4900 6084 5460
32 77 83 5929 6889 6391
33 81 84 6561 7056 6804
34 82 79 6724 6241 6478
35 77 82 5929 6724 6314
36 77 85 5929 7225 6545
37 80 85 6400 7225 6800
38 83 93 6889 8649 7719
39 78 89 6084 7921 6942
40 60 83 3600 6889 4980
Total ∑X ∑Y ∑X2 ∑Y2 ∑XY
Based on the calculation of correlation variable X and variable Y above, it can known of each. Based on the product moment will be found the product of rxy
as follow : 𝑟𝑥𝑦 =
40 253656 − 3018 . (3356)
40. 228988 −(3018)2 . 40. 282292 −(3356)2
= 10146240−10128408
9159520−9108324 .11291680−11262736
= 17832
51196 . (28944 ) =
17832 1481817024
= 17832
38494 ,37652 = 0.46323649
= 0.463
Based on the calculation above it was found that the total of variable X and variable Y was 0.463, so between the both variables there was moderately correlation. So, the hypothesis stating that Ha was accepted and hypothesis stating
that Ho was ignored. Where between the self-confidence and students’ speaking
ability there was moderatelycorrelation. It meant that there was moderately correlation between the self-confidence and students’ speaking ability.
And the result was looked at from interpretation orientation as follow : Table 4.9
Interpretation Orientation62 Score of “r” Product Moment Interpretation
0.00 - 0.200 Very low/No correlation
0.200-0.400 Low correlation
0.400-0.700 Moderately correlation
0.700-0.900 High correlation
0.900 – 1000 Very high correlation
62
Based on the interpretation that was stated by anassugiono, if the value of rxy was on 0.400 – 0.700 so, between variable X and variable Y there was
moderately correlation. The result of the calculation that was counted by the product moment above showed that the result was 0.463, so that Ha accepted and
Ho was ignored.
Even so, it was know the result of “r” = 0.304<0.463>0.393 it can be explain that the value of “r” was smaller than 5% and it was smaller than 1% as
the result, the value of “r” was there was fair and moderately correlation but the correlation was positive.
if rxy>ttable refused Ha it meant it was significant and if rxy<ttable received Ho,
it meant it was not significant. Based on the calculation above 0.463 and n = 40, so df = n – 2 = 38 and ttable was 0.463. So, it can be seen that rxy>ttable so that the
result was the Ha was accepted and Ho was refused. In this case that variable X
(self-confidence) ensures students’ to do good speaking, hangman other aspect can help the speaking skill.
And to know the contribution of the variable X and variable Y was used the formula as below :
KP = r2 x 100%63 Where :
KP = determinant coefficient score r = correlation coefficient score KP = r2× 100% = 0.4632 x 100 =21.44%
63
So it meant that the variable X (Self-confidence level) gave the contribution’ ability in speaking at fourth semester of students English program was 21.44% and 78.56% was influenced by other aspects.
G. Testing Hypothesis Using SPSS Program
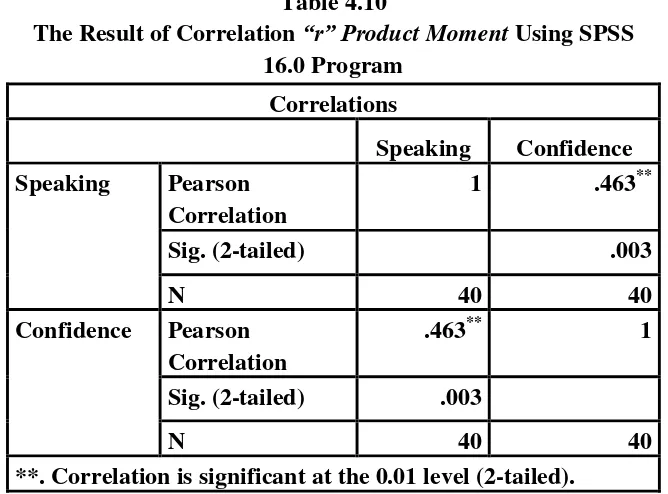
The writer also applied SPSS 16.0 program to calculate correlation “r” product moment in testing hypothesis of the study. The result of calculation
correlation “r” product moment using SPSS 16.0 was support the manual calculation. The result of calculation correlation “r” product moment using SPSS 16.0 program could be seen as follows:
Table 4.10
The Result of Correlation “r” Product Moment Using SPSS
16.0 Program Correlations
Speaking Confidence Speaking Pearson
Correlation
1 .463**
Sig. (2-tailed) .003
N 40 40
Confidence Pearson Correlation
.463** 1
Sig. (2-tailed) .003
N 40 40
**. Correlation is significant at the 0.01 level (2-tailed).
It could be interpreted based on the result of calculation that Ha there wasa
positive correlation on students speaking ability at the fourth semester of State Islamic Institute (IAIN) Palangka Raya, academic year 2013/2014.
H.Interpretation of the Result
Based on the result of manual calculation, It meant stating that Ha was
accepted and Ha was rejected.Furthermore, the result of calculation using SPSS
16.0 found that there was a positive correlation between the students’ confidence and their speaking ability.
The finding of the study interpreted that the alternative hypothesis stating that there was significance positive correlation between the students’ confidence and their speaking ability was accepted and the null hypotheses stating that there was no significance correlation between the students’ confidence and their speaking ability was rejected.
I. Discussion
The research problem stated: “is there relationship between the students’ confidence and their speaking ability at the fourth semester of IAIN Palangka Raya academic year 2013/2014?” Hence, the question looked for an answer is there any significance correlation between the students’ confidence and their
speaking ability. To answer the research problem the correlation “r” product moment formula was applied.
The result of the data analysis showed that there was correlation between the students’ confidence and their speaking ability at the fourth semester of IAIN
would get low score of speaking test. Furthermore, the result of the data calculation using SPSS 16.0 found that there was correlation between the students’ confidence and their speaking ability. The finding of the study
interpreted that the alternative hypothesis stating that there was a positive significance correlation between the students’ confidence and their speaking
ability at the fourth semester of IAIN Palangka Raya academic year 2013/2014 was accepted and the null hypothesis stating that there was no correlation between the students’ confidence and their speaking ability at the fourth semester of IAIN
Palangka Raya academic year 2013/2014 was rejected. It meant that; 1) the students who had strong confidence, they would get high score of speaking test. 2) Since, the rxywas 0.463 it interpreted to moderately correlation. 3) There was
positive correlation between the students’ confidence and their speaking ability. These findings were suitable with the theories as stated in chapter II that helping learners feel good about themselves by making thembelieving in their capacities needs to be incorporated within the teachingprocess. For instance, some learners are good at this and others are goodat that, but they need to recognize that they are all gifted in one way or inanother. Clement & Kruidener in Ms. Zakia Djebbarisaidthat self-confidence was a social product which was due to contacts betweenenvironments where different language communities exist togetherwithout excluding its cognitive components. In this vein, states that:
the extent ofidentification with the L2 group. Linguistic self-confidence in Clément’s view is primarily a socially defined construct.64
Goleman in Ms. Zakia Djebbari said that Self-confidence appears to involve knowing one’s own abilities andhaving enough faith in them to make
sound decisions in the face ofuncertainty and pressure. It is a belief in one’s own abilities to take on adifficult challenge. A confident person displays a powerful self-presentationand expresses him or herself in an influential, remarkable,and unhesitating way.65 Mruck in Ms. Zakia Djebbari said if confidence is viewed ascompetence, this depends on two things, an individual’s hopes, desires, oraspirations, which are termed “pretensions,” and his or her ability to realize them, which in turn requires competence.Accordingly, studies which converge from educational psychologists tendsto focus on behavioral outcomes and the degree of discrepancy betweenone’s “ideal” self and “real” self.66
Because the reason above, it could conclude that self-confidence was important, because the student who had high confidence they will more spirit to speak English. Besides that, the lecturer or teacher have important role to build their students’ self-confidence, created a supportive classroom environment that encourages them to speak and take part in oral activities without fear. The speaking lecturer should create situations that persuade students to produce oral language. They may help students identify their fears and help them learn to regulate and deal with them. They can also help students maintain positive beliefs
64
Ms. Zakia Djebbari. “Self Confidence and Pronunciation Training to Enhance the EFL
Speaking Competence”, Dissertation of Doctorate, Tlemcen: Abu Bekr Belkaid University, 2014, p.. 47, t.d
65Ibid, p.48 66