* Prof. Dominic Cooper BSMS Inc. 6648 East State Road 44, Franklin, Indiana, 46131, USA Tel: +1 (317) 736 8980 E-mail: [email protected]
ASSE- 0307-013
The Impact of Management
’
s Commitment on Employee Behavior: A Field Study
Prof. Dominic Cooper* C. Psychol. C.FIOSH, BSMS Inc. 6648 East State Road 44, Franklin, Indiana, 46131, USA.
ABSTRACT
Behavioral safety was implemented in a nickel refinery over a 93-week period with 275 employees, plus contractors. Measurement focused on managerial commitment behaviors and employee safety behaviors. Safety behavior improved by 40%. Lost time injuries reduced by 82.2% in the first year, reducing to Zero in the second. Minor injuries reduced by 35%. Multiple regression showed managerial commitment impacted 35% on employee safety behavior. The timing and magnitude of impact suggests management must continually demonstrate their commitment to safety.
KEYWORDS
Managerial Commitment, Safety behavior, Goal-setting, Feedback.
1. INTRODUCTION
Top performing companies express high commitment to safety by developing a process in which the workforce can participate, and which can be implemented and monitored so both management and the workforce can receive feedback1. A systematic behavioral safety process fulfils these conditions. The intention is to focus workers attention and action on their safety behavior to avoid injury. Interventions are aimed entirely upon the observable interactions between safety behavior and the working environment.
Behavioral safety attempts to identify those unsafe behaviors implicated in the majority of injuries. These behaviors and/or their proxies (e.g., hoses left lying across walkways) are developed into specific behavioral checklists. Trained observers use these to monitor and record people’s work behavior on a regular basis (e.g., daily). Derived from the observation results, ‘Percent safe’ scores provide feedback so people can track their progress against self-set, assigned or participative improvement
goals2. Feedback mechanisms include verbal feedback at the point of observation, graphical charts and/or written performance summaries so corrective actions can be taken3,4. Results indicate significant reductions in injury rates are possible within a relatively short time5 with the impact lasting for many years6.
Those companies implementing behavioral safety possess a high degree of organizational commitment to safety7. However, the commitment of individual manager’s to the organization’s safety goals and the behavioral safety process is a significant factor8. Managers need to provide the necessary resources, give the workforce the authority to run and manage the process alongside the usual safety management systems, and actively support the process. In many instances this does not occur.
2. MANAGEMENT’S COMMITMENT
Managerial commitment is defined as "engaging in and maintaining behaviors that help others achieve a goal’8. Broadly speaking, measurement can be undertaken in two ways: Direct questions are asked of managers9 or their commitment behaviors are monitored10. Not many managers admit they are uncommitted to safety when asked, whereas behavior provides the ultimate proof of commitment10. An extensive search of the psychological, managerial and safety literatures reveals the existing managerial commitment evidence is almost entirely based on perceptual questionnaires or semi-structured interviews. With few exceptions8,11,12 little empirical work has assessed the actual impact of managerial commitment behaviors on employee behavior.
Management Levels: Although unclear, the available
evidence suggests different management levels exert different effects on employee behavior. For example, in a Dutch questionnaire study of 207 workers on 15 construction sites13, it was found that senior managers exert a greater influence on employee motivation to behave safely than supervisors do. Conversely, a Canadian 7th Professional Development Conference & Exhibition
study14,15 using a questionnaire survey with 23,615 production workers, suggest supervisors exert a greater influence on employee behavior than senior plant managers do. These two examples suggest the effects of management’s commitment are likely to be moderated by situational aspects such as the prevailing safety culture16, industrial sector and type of organizational structure17.
3. STUDY AIMS
The purpose of the current study was to ascertain the impact that managerial support behaviors exerted on employees safety behavior, utilizing senior, middle and front-line management behavioral checklists over a 93-week period in a Nickel Refinery.
4. METHOD
Participants and Setting: The refinery contained eight main
departments on a 55-acre site, employing approximately 275 personnel. The five main production departments operated a continuous 24-hour, 3 x 8 hour rotating shift system, with two shifts 'resting' at any one time. Shipping operations worked a 2 x 8 hour shift system (am and pm). Site support functions comprised administration, laboratories, medical facilities, engineering maintenance, and safety, who worked a 'normal' five-day, 39-hour week. Transitional contractors from seven companies also participated (e.g., welders, fitters, canteen staff, cleaners, etc.).
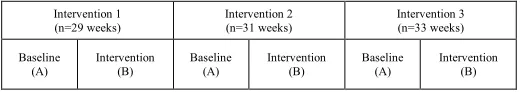
Intervention Design: This study utilized a
repeated-measures time series design with 43 work groups across three separate interventions, over 93 weeks. Intervention 1 lasted 29 weeks, with 31 and 33-week durations for interventions 2 and 3, respectively (see Figure 1). The primary measurement variables focused on employee safety behavior and managerial supportive behavior. Injury rates and their associated costs comprised the secondary variable used to assess the efficacy of the interventions.
Figure 1: Experimental Design
Intervention 1 (n=29 weeks)
Intervention 2 (n=31 weeks)
Intervention 3 (n=33 weeks)
Baseline (A)
Intervention (B)
Baseline (A)
Intervention (B)
Baseline (A)
Intervention (B)
Safety Performance Measures: The site was divided into 27
observation areas across eight main departments, containing 43 work-groups. Based on analyses of the company’s historical injury records for the previous two years, behavioral checklists for the 27 areas were developed. Each contained a maximum of 20 behaviors (e.g., personnel are holding the handrails when using stairs) pertaining to the work area of interest. These were placed into various
categories (e.g., housekeeping, personal protective equipment, etc.) to facilitate analyses and feedback.
Each checklist contained three columns: Safe; Unsafe, and Unseen. The safe and unsafe columns were used to calculate an Observed Percent Safe score, which was used as the primary dependent variable in this study. The unseen column was used when behavior did not take place during an observation session (i.e. it could not be observed).
Management's Commitment: Managers themselves
identified the management commitment behaviors. The resulting behavioral support checklists did not change throughout the duration of the study. Senior management’s checklist contained 11 items (See Figure 2 for an example), and middle management’s contained 16 items. The managers were trusted to complete these once per week on a self-report basis. A visible ongoing support (VOS) proxy measure provided an indicator of front-line management’s commitment. Completed by employee observers weekly, these contained seven items. Each contained two columns (Yes & No), so an ‘Observed Percent Support score’ could be calculated.
Figure 2: Senior Management Commitment Index
Injuries: The lost-time injury (LTI) and minor injury rate
(inclusive of occupational health exposures) were the company’s primary outcome measures used to assess the effectiveness of the behavioral safety process. The site calculated these based on the number of incidents per 200,000 hrs worked.
5. PROCEDURE
Obtaining Employee Participation: Briefings with allsite
personnel took place prior to any training or implementation taking place (inclusive of contractors), to seek employee participation. At these, the workforce indicated their most serious safety concerns and the most common unsafe behaviors they engaged in. Actions on the concerns were completed soon after the briefing sessions and then publicized to reinforce employee participation.
1 Accompanied an observer during an observation 2 Attended a workgroup feedback meeting
3 Discussed safety performance with employee(s) (one-to-one)
4 Discussed line management on-going support 5 Developed plans for corrective actions
6 Ensured that some corrective actions were closed 7 Approved funding for safety improvement(s) 8 Reviewed progress with management team and/or SHE advisor
9 Conducted an incident investigation (as required) 10 Attended a safety training course
The unsafe behaviors were used to help develop behavioral checklists.
Project Team and Managerial Training: A project team
comprising two hourly paid coordinators (one for direct employees and one for external contractors) and a safety champion drawn from the senior management team on site were trained over five days in the principles and practice of behavioral safety.
All managers also attended a one-day training session (n=5) to acquaint them with the project’s logistics, to develop the management support checklists, and be trained in behavioral observations.
Observer Recruitment & Training: The project team
initially recruited and trained 113 volunteer observers. Each were trained how to observe, give verbal feedback, set participative improvement goals and conduct weekly feedback sessions with their workgroups. A one-week practice period (or shift cycle) facilitated accuracy checks on the observations.
Establishing Baselines: To establish a baseline, observers
monitored everyone in their workgroup for 15-30 minutes every day they were at work, for four weeks (or four shift cycles). Observers randomly chose the time of day when their observation would take place. To minimize the potential impact on baseline performance, observers were instructed not to give verbal feedback unless someone was in imminent danger of hurting themselves or their colleagues. Written or posted graphical feedback was not provided. Observations were recorded and analyzed in a dedicated computerized behavioral safety-tracking program.
Goal-setting: At the end of each four-week baseline period,
workgroups attended their respective goal-setting session led by the workgroup observers, where participative goals were set5. Each workgroup’s goal was posted on their graphical feedback chart as a line at the appropriate percent-safe goal level. No explicit goals were set for the managerial support behaviors.
Monitoring & Feedback: After goal setting, observers
continued to monitor their colleague’s safety behavior on a daily basis for 15-30 minutes at randomly chosen times of day. The project co-coordinators entered the observation data at the end of each working day into the tracking program. The managers entered their own checklist scores directly into the online computer program once per week. Observers completed VOS checklists weekly to indicate whether they had received the requisite support from front-line managers.
Each workgroups observation data were analyzed weekly to provide the percent safe score, which was posted on their
graphical feedback chart. A written analysis reporting results by category of behavior (e.g., use of tools, housekeeping, etc) was discussed at weekly 30-minute meetings. Monthly reports that summarized the sites average percent safe score, the percentage of observations missed and the average percent support score for each managerial level were also produced for senior management meetings.
Repeat Interventions: Excluding the initial workforce
briefings and project team training, Interventions 2 and 3 repeated the above process in exactly the same way. Different workers observed during each intervention: The intention was for all workgroup members to become an observer eventually. Each intervention used slightly different behavioral checklists, developed on an evolutionary basis. Behaviors consistently recorded as 100% safe for an extended period during the previous intervention were replaced. Each checklist was approved by the appropriate workgroup prior to being put to use.
6. RESULTS
Behavioral Safety Performance: For Intervention 1(see
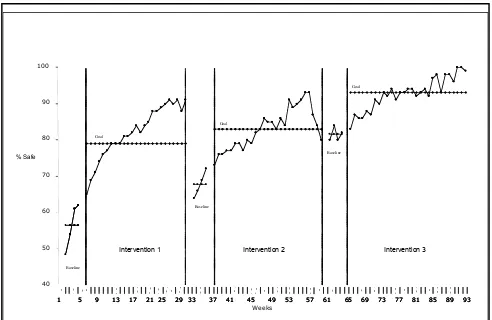
Table 1) the average four-week baseline score (56.5%; S.D.= 6.14) for the site as a whole indicated that just over half of the behaviors observed were performed safely when the project began. The site’s average safety goal of 79 percent represented a goal-difficulty level of 22.5 percent improvement. The mean average percent safe score of 82.16 (SD=7.30) shows the site goal was exceeded. A One-way Analysis of Variance (ANOVA) reveals the change in safety performance scores was highly significant [F (1, 27) = 44.09, p<001]. Shown in Figure 3, the site goal was achieved within seven weeks of setting the goal, with this level of performance maintained or exceeded over the remaining 18 weeks of the intervention.
Within Intervention 2, the average baseline score of 67.75% (SD=3.50) for the site indicate underlying safety behavior had improved by some 11.25% over Intervention 1 baseline. The average site goal was 83 percent. The mean average percent safe score of 83.15%, (S.D.=5.65) shows the average site goal was achieved at Week 12 and more or less maintained or exceeded for the next 14 weeks. A One-way Analysis of Variance (ANOVA) again reveals the change in safety performance scores from the baseline average was highly significant [F (1, 29) = 27.66, p<001].
(SD=4.44) indicates the site achieved its goal of a 93 percent average site goal for this intervention. Again, this
represents a highly significant change [F (1, 29) =24.83, p<001] from the Intervention 3 baseline.
Table1: Individual Phase Mean Average Percent Safe Scores
Figure 3: Average weekly Site % Safe Scores for each intervention
Injury Reduction: In terms of corresponding injury
performance during the 93-week study period, the lost-time injury rate (# of injuries/per 200,000 hrs worked) for 2001 was 0.45 compared to 2.54 in the year 2000, representing an 82.2% decrease. As shown in Figure 4, by the end of the study period in 2002, the lost-time injury rate had reduced to zero. This remained zero in 2003 (The project continued unaided during this time).
In terms of minor incidents (inclusive of occupation health exposures to nickel particulates and minor physical injuries) to both direct employed and contractors, the minor incident rate in 2000 was 54.05.
This reduced to 44.65 in 2001 and 35.25 in 2002. Thus minor incidents reduced by approximately 35% over the 93-week period. The minor incident rate continued to decrease
in 2003 to 19.74 providing a total reduction of 63% over three years (see Figure 5) as the site continued with the behavioral safety process.
Figure 4: Number of lost time accidents and injury rates by year
Figure 5: Number of Minor Injuries and Injury Rates (inc. of Occ. Health Exposures)
% Safe B/Line % Safe Performance
Period
# of Recordable Injuries Recordable Incident Rat e Per 200,00 0 hrs Worked
# of
# of Recordable Injuries Recordable Incident Rat e Per 200,00 0 hrs Worked
# of
Intervention 1 Intervention 2 Intervention 3
40
Intervention 1 Intervention 2 Intervention 3
1 # of Lost Time Injuries Incident Rate per 200,00 hrs
1996 1997 1998 1999 # of Lost Time Injuries Incident Rate per 200,00 hrs
Management’s Commitment: The main aim of this study was [a] to explore the potential impact of management support on safety performance and [b] ascertain if the impact of management support differs by managerial level. Multivariate analysis of variance (ANOVA), correlational analysis and multiple regressions were used to assess the relationship between the different levels of management support and safety performance.
Time Series Data Transformation: To avoid spurious
correlations or multi-collinearity when using regression methods, time series analysis requires stationarity be established through differencing or some other technique to ensure the ranges of the different series are invariant18. Differencing is a data pre-processing step which attempts to de-trend data to control autocorrelation and achieve stationarity by subtracting the previous series value from the current value. Single differencing was used for each data series. To check if each data point was independent of others in a series (i.e., random), each was analyzed via autocorrelations using natural logs to remove any non-constant variance. No significant autocorrelations were obtained, indicating that each separate data series contained random or independent data.
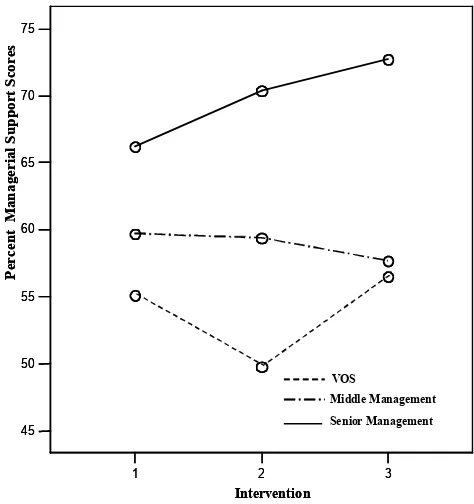
Descriptive Statistics: The average percent support scores
for all three management levels, across all three interventions are presented in Table 2. These show that both middle management and VOS levels remained fairly static, whereas those for senior management steadily increased, suggesting an interaction between management support and intervention period.
Table 2: Individual Phase Mean Averages for Leadership and Support Behaviors
SML = Senior Management; MML = Middle Management; VOS = Visible Ongoing Support
Interactions: Multivariate analysis tested for possible
interactions. Management commitment (Senior, Middle Management and VOS) was entered as the dependent variable with Intervention period treated as the fixed factor. Percent safe scores were entered as the covariate. The results (see figure 6) show there was a commitment x intervention interaction, that was greater for VOS [F (3, 89) = 19.24, p<.01], followed by senior [F (3, 89) = 14.93, p<.01] and middle management commitment [F (3, 89) = 9.93, p<.01]. Moreover, the magnitude of support differed significantly [F (2, 89) = 151.63, p<.01] between the three managerial levels across the three interventions.
Figure 6: Interactions between management support and intervention
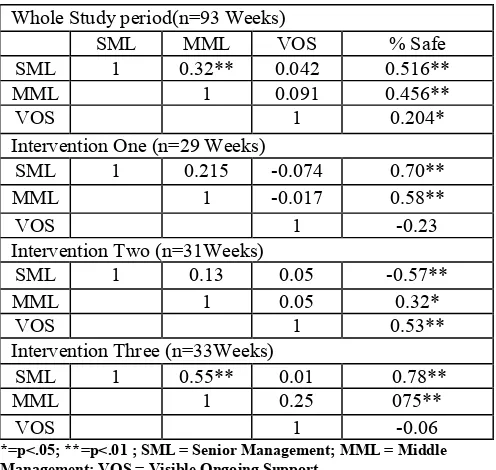
Correlation analyses: Pearson product-moment correlations
Table 3: Inter - variable correlation's for study period
Whole Study period(n=93 Weeks)
SML MML VOS % Safe
SML 1 0.32** 0.042 0.516**
MML 1 0.091 0.456**
VOS 1 0.204*
Intervention One (n=29 Weeks)
SML 1 0.215 -0.074 0.70**
MML 1 -0.017 0.58**
VOS 1 -0.23
Intervention Two (n=31Weeks)
SML 1 0.13 0.05 -0.57**
MML 1 0.05 0.32*
VOS 1 0.53**
Intervention Three (n=33Weeks)
SML 1 0.55** 0.01 0.78**
MML 1 0.25 075**
VOS 1 -0.06
*=p<.05; **=p<.01 ; SML = Senior Management; MML = Middle Management; VOS = Visible Ongoing Support
Whole Study Period: Across the whole study period,
significant correlations were obtained for senior (r=0.52, p<. 01, n=93) & middle (r=0.46, p<.01, n=93) management scores and Visible Ongoing Support (r=0.20, p<.05) with percent safe. The coefficients of determination (r2) for senior (0.27) & middle (0.21) management and VOS (0.04) scores indicate a direct link between different levels of managerial support behavior and employee safety behavior.
Intervention Periods: Correlational analyses by intervention
indicate that each level of managerial support is related to safety behavior at different moments in time. Senior management scores were positively related to safety behavior during interventions 1 (r=0.70, p<.01) and 3 (r=0.78, p<.01), but negatively related during Intervention 2 (r=-0.57, p<.001). Significant relationships were also obtained for middle management during Interventions one (r=0.58, p<.01), two (r=0.32, p<.05) and three (r=0.75, p<.01). A significant relationship for VOS was obtained only during Intervention 2 (r=0.53, p<.01). Thus, there appears to be a robust, but dynamic, relationship between the three levels of management support and employee safety performance.
Inter-Variable Correlations: Inter-variable correlational
analyses yielded a significant correlation between middle and senior management scores (r=0.32, p<0.01, n=93) across the whole study period. An exploration of these correlations for each intervention shows that middle management support was significantly related to senior management support (r=0.55, p<.01, n=31) during Intervention 3 only. No other significant inter-variable correlations were obtained.
Regression Analysis. To attempt to tease out more specific
relationships, stepwise multiple correlational techniques were used to identify the magnitude of variance explained by each variable for the whole study period. Observed percent safe was the dependent variable with senior management, middle management and Visible Ongoing Support treated as independent variables. Shown in Table 4, the adjusted R2results indicate combined senior and middle management support significantly [F (2, 92) = 25.27, p<.01] impacted safety performance (R2= 0.35) by about 35%. Visible Ongoing Support (VOS) appears to have had no impact on the percent safe data over the whole study period.
7. DISCUSSION
The results reported here demonstrate the effectiveness of behavioral safety in the workplace19
, particularly when implemented by employees5
. Average behavioral safety performance for the site increased substantially over each separate intervention, achieving an overall 36% improvement. Correspondingly, the site also achieved a 100% reduction in the lost-time injury rate and 35% in minor incident rate, suggesting a 1:1 ratio between safety behavior improvement and minor incident reduction.
Management's Commitment: This study provides
compelling evidence regarding the impact that management support behaviors exert on employee safety behavior, with associated effects on injury rates. This supports findings11
that increasing the frequency of management –subordinate safety interactions positively influences safety performance. Nonetheless, the magnitude of impact on employee behavior for each separate level of management differed across time, ranging from small to large effects20
.
Different combinations of managerial levels exerted an increasingly cumulative effect on performance. This implies the influence of management commitment is dynamic. It appears it takes time for a particular level of managerial support to exert its influence, with the strength of influence also varying. In practical terms, this suggests all managerial levels must continuously demonstrate their commitment to an improvement initiative from the beginning, as it is unclear when this will actually exert its intended influence and to what degree.
Explanations for the varying degrees of influence may reside [a] in the design of the improvement process21
and [b] in the effects of competing goals2
improvement goal set. Each workgroup also obtained regular process and outcome feedback about their progress, with a substantial number of employees receiving immediate verbal feedback during an observation. In addition, many of the remedial actions reported were completed by the workgroups themselves (albeit that management provided the resources). Such design attributes may account for improvements in employee behavior independently of managements’ supportive behavior17
. As such, it is conceivable that when employee involvement is low, management commitment effects are even greater.
With regard to competing goals, although senior management support increased across the three interventions, middle and front-line management scores consistently remained within a 50-60% band. Middle and front-line management were responsible for simultaneously achieving multiple goals. These included productivity (i.e., quality, quantity and efficiency), safety, health and environment, employee welfare and completing administrative requirements, in addition to supporting the improvement initiative.
The pursuit of multiple goals often involves trade-offs so that one is attained at the expense of another2
, or the minimum amount of effort is expended so that all goals are ‘satisficed’ (i.e., met, but at lower levels of performance that might have been achieved if successfully prioritized). Of course, those goals’ leading to organizational rewards22
such as career progression are more likely to be vigorously pursued. In this study, it would appear that ‘satisficing’ or in many cases simply not providing support became the norm. This was further compounded during the study by a lack of accountability for non-supportive behavior. A post-study review addressed these issues by aligning managerial accountabilities for the improvement initiative with the system requirements of OSHAS 18001 (the site was accredited in 2004).
Relationships between Management Levels: The managerial
paths of influence on employee behavior, is a significant factor not yet fully explored23
. It has been hypothesized there is a linear relationship between hierarchical management levels, in that senior managers influence the behaviors of middle managers, who in turn influence the behaviors of front-line managers, who subsequently influence employee behavior23,11,12
. The results reported here indicate this is not always the case. The pattern and magnitude of regression coefficients revealed greater effects on employee behavior for senior management support during all three interventions. Thus, senior management’s commitment directly influenced employee behavior, independently of middle and front-line management.
These results tend to support Andriessen’s13
conclusion that higher level management have a greater degree of influence on workers’ behavior than supervisors. Conversely, the senior and middle management relationship obtained during Intervention 3 also support the position of Simard and Marchand14,15
. They concluded higher level management play a secondary role through their influence on lower management levels. In this study, it appears senior management commitment played both a primary and secondary role that directly influenced both employee and lower management behaviors. This potentially reconciles the two opposing positions although further research is required. However, organization structure may be a moderating factor17. For example, in this study, middle management had a very high degree of autonomy to meet operational targets. Similarly, although they were not self-directed work teams per se, the workgroups were also highly autonomous. Therefore, middle managers or employees were not dependent upon continual higher management oversight.
8. SUMMARY
Employee-led behavioral safety processes can help to significantly reduce organizational injury rates within a relatively short time frame. However, management need to visibly demonstrate their support on a continual basis, as it is unclear when and to what degree this will exert its intended influence on performance. Regular measurement of managerial commitment with a behavioral checklist offers several distinct advantages. First, employees can see that management is genuine in their desire to support safety efforts, which will increase their motivation to improve. Second, managers can set goals to increase the levels of commitment displayed and provide themselves with the feedback required to improve performance. Third, the commitment data could be used as part of an annual performance appraisal system to increase managerial accountability for safety.
Each management level exerted independent and cumulative effects on employee safety behavior. Senior management commitment played a primary role in shaping employee behaviors and a secondary role by shaping lower management behavior that in turn impacted on employee behavior.
REFERENCES
1. Gaertner, G., Newman, P., Perry, M., Fisher, G., & Whitehead, K. (1987). Determining the effects of management practices on coal miners' safety. Human engineering and human resource management in
mining proceedings, 82-94.
2. Locke, E.A., & Latham, G.P. (1990). A theory of
goal-setting and task performance. London: Prentice-Hall.
International review of industrial and organizational
psychology 1990. Vol 5,169-193. Chichester: John.
Wiley and Sons,
4. McAfee, R.B., & Winn, A.R. (1989). The use of incentives/feedback to enhance work place safety: A critique of the literature. Journal of Safety Research,
20, 7-19.
5. Cooper, M.D., Phillips, R.A., Sutherland, V.J & Makin, P.J. (1994). Reducing accidents with goal-setting and feedback: a field study'. Journal of Occupational and
Organizational Psychology, 67, 219-240
6. Fox, D.K., Hopkins, B. L., & Anger, W.K. (1987). The long-term effects of a token economy on safety performance in open-pit mining. Journal of Applied
Behavior Analyses, 20, 215-224.
7. Gaertner, G., Newman, P., Perry, M., Fisher, G., & Whitehead, K. (1987). Determining the effects of management practices on coal miners' safety. Human engineering and human resource management in
mining proceedings, 82-94.
8. Cooper, M.D. (2005). Exploratory analyses of managerial commitment and feedback consequences on behavioral safety maintenance. Journal of Organizational Behavior Management.
9. Hollenbeck, J.R., Klein, H.J., O'Leary, A.M., & Wright, P.M. (1989). Investigation of the construct validity of a self-report measure of goal commitment.
Journal of Applied Psychology, 74, 951-956.
10. Salancik, G.R. (1977). Commitment and the control of organizational behavior and belief. In:B.M. Staw, & G.R. Salancik (Eds.) Newdirections in organizational
behavior. Chicago: St Clair Press.
11. Zohar, D. (2000). A group-level model of safety climate: Testing the effect of group climate on micro-accidents in manufacturing jobs. Journal of Applied
Psychology, 85(4), 487-596.
12. Zohar, D., & Luria, G., (2003). The use of supervisory practices as leverage to improve safety behavior: a
Research, 34 (5), 567–577.
13. Andriessen, J. H. T. H. (1978). Safe behavior and safety motivation. Journal of Occupational Accidents, 1, 363-376.
14. Simard, M., & Marchand, A. (1995). A multilevel analysis of organizational factors related to the taking of safety initiatives by work groups. Safety Science, 21, 113-129.
15. Simard, M., & Marchand, A. (1997). Workgroups' propensity to comply with safety rules: The influence of micro-macro organizational factors. Ergonomics, 40(2), 127-188.
16. Cooper, M.D. (2000). Towards a model of safety culture.
Safety Science, 32 (6), 111-136.
17. Roy, M. (2003). Self-directed work teams and safety: A winning combination? Safety Science, 41, 359-376. 18. Von Eye, A., & Schuster, C. (1998). Regression
Analysis for Social Sciences. Academic Press. San Diego.
19. Grindle, A.C., Dickinson, A.M., & Boettcher, W. (2000). Behavioral safety research in manufacturing settings: A review of the literature. Journal of Organizational
Behavior Management,20(1), 29-68.
20. Rodgers, R., & Hunter, J.E. (1991). Impact of management by objectives on organizational productivity. Journal of Applied Psychology, 76, 322-336.
21. Cohen, H., & Cleveland, R. (1983). Safety program practices in record-holding plants. Professional Safety
(March), 26-33.
22. Deming W.E. (1986). Out of Crisis. Boston: Massachusetts Institute of Technology