8
thGrade Blueprint
REV 6.2.11
Page 1 of 44
MT= Math Thematics Book MT-TRB =Math Thematics Teacher’s Resource Book
8
thGrade Blueprint
Assessed Quarter 1
Strand
Concept
Performance Objectives
Process Integration
Strand 5
Explanation, Examples, and Resources
PO 1. Compare and order real numbers including very large and small integers, and decimals and fractions close to zero.
Connections M08-S1C3-02
Estimate the location of rational and common irrational numbers on a number line.
M08-S5C2-01. Analyze a problem situation to determine the
question(s) to be answered.
M08-S5C2-06. Communicate the answer(s) to the question(s) in a problem using appropriate representations, including symbols and informal and formal
mathematical language.
Students order real numbers in a variety of forms (fractions, decimals, simple radicals, etc.) on a number line. Students compare real numbers within and among different subsets of the real number system.
Strand 1: Concept 1: Number Sense
PO 2. Classify real numbers as rational or irrational.
8.NS.1. Know that numbers are not rational are called irrational. Understand informally that every number has a decimal expansion; for rational numbers show that the decimal expansion repeats eventually, and convert a decimal expansion, which repeats eventually into a rational number.
8.EE.2. Know that 2is irrational.
Connections M08-S1C1-03
Model the relationship between the subsets of the real number system.
M08-S1C3-02
Estimate the location of rational and common irrational numbers on a number line.
M08-S5C2-01. Analyze a problem situation to determine the
question(s) to be answered.
Students differentiate the definitions of rational and irrational numbers. They use the definitions to classify a list of real numbers.
Examples:
Convert 0.333… into a fraction. 10n = 3.333…
8
thGrade Blueprint
REV 6.2.11
Page 2 of 44
MT= Math Thematics Book MT-TRB =Math Thematics Teacher’s Resource Book
8
thGrade Blueprint
Assessed Quarter 1
Strand
Concept
Performance Objectives
Process Integration
Strand 5
Explanation, Examples, and Resources
PO 3. Model the relationship between the subsets of the real number system.
Connections M08-S1C1-02
Classify real numbers as rational or irrational.
M08-S5C2-04. Represent a problem situation using multiple representations, describe the process used to solve the problem, and verify the reasonableness of the solution.
Students can use graphic organizers to show the relationship between the subsets of the real number system.
Strand 1: Concept 1: Number Sense
PO 4. Model and solve problems involving absolute value.
Connections M08-S1C2-05
Simplify numerical expressions using the order of operations that include grouping symbols, square roots, cube roots, absolute values, and positive exponents.
M08-S5C2-04. Represent a problem situation using multiple representations, describe the process used to solve the problem, and verify the reasonableness of the solution.
8
thGrade Blueprint
REV 6.2.11
Page 3 of 44
MT= Math Thematics Book MT-TRB =Math Thematics Teacher’s Resource Book
8
thGrade Blueprint
Assessed Quarter 1
Strand
Concept
Performance Objectives
Process Integration
Strand 5
Explanation, Examples, and Resources
Strand 1: Concept 2: Numerical Operations
PO 1. Solve problems with factors, multiples, divisibility or remainders, prime numbers, and composite numbers.
Connections (none)
M08-S5C2-01. Analyze a problem situation to determine the
question(s) to be answered.
Examples:
Use the rules of divisibility to classify numbers. Explain why some numbers may be listed in more than one group.
Compare the price of each of the jars of spaghetti sauce to determine
the best deal.
36
oz
12
.
2
$
24
oz
34
.
1
$
12
oz
88
.
0
$
You are planning a barbeque for 40 people. You will serve hot dogs. Each of the packages of hot dogs contains 8 hot dogs and each of the packages of hot dog buns contains 6 buns. You want to buy the minimum number of packages so that each hot dog is matched with a bun and there are no leftovers. How many packages of each must you buy?
8
thGrade Blueprint
REV 6.2.11
Page 4 of 44
MT= Math Thematics Book MT-TRB =Math Thematics Teacher’s Resource Book
8
thGrade Blueprint
Assessed Quarter 1
Strand
Concept
Performance Objectives
Process Integration
Strand 5
Explanation, Examples, and Resources
PO 2. Describe the effect of multiplying and dividing a rational number by
a number less than zero,
a number between zero and
one,
one, and
a number greater than one.
Connections (none)
M08-S5C2-06. Communicate the answer(s) to the question(s) in a problem using appropriate representations, including symbols and informal and formal
mathematical language.
Example:
Explain what happens to the number 2 when it is multiplied and divided by each of the real numbers listed below:
o - 2
Operations PO 3. Solve problems involving percent increase, percent decrease,
and simple interest rates.
Connections M08-S1C3-01
Make estimates appropriate to a given situation.
M08-S1C2-05
Simplify numerical expressions using the order of operations that include grouping symbols, square roots, cube roots, absolute values, and positive exponents.
M08-S3C4-02
Solve problems involving simple rates.
M08-S5C2-01. Analyze a problem situation to determine the
question(s) to be answered.
M08-S5C2-08. Describe when to use proportional reasoning to solve a problem.
Examples:
Gas prices are projected to increase 124% by April. A gallon of gas costs $4.17. How much will a gallon of gas cost in April?
8
thGrade Blueprint
REV 6.2.11
Page 5 of 44
MT= Math Thematics Book MT-TRB =Math Thematics Teacher’s Resource Book
8
thGrade Blueprint
Assessed Quarter 1
Strand
Concept
Performance Objectives
Process Integration
Strand 5
Explanation, Examples, and Resources
PO 4. Convert standard notation to scientific notation and vice versa (include positive and negative exponents).
8.EE.3. Use numbers expressed in the form of a single digit times an integer power of 10 to estimate very large or very small quantities, and to express how many times as much one is than the other.
Connections (none)
In addition to converting between standard notation and scientific notation, also explore issues of magnitude, as it relates to real world contexts.
Examples:
Write the distance between the Earth and the Sun using scientific notation. The average distance between the Earth and the Sun is 150 million kilometers.
What is the average size of a red blood cell in meters written in standard notation? The average size of a red blood cell is 7.0 x 10⁻⁶ meters.
Estimate the population of the United States as 3 x 10⁸ and the population of the world as 7 x 10⁹, and determine that the world population is more than 20 times larger.
Strand 1: Concept 2: Numerical Operations
PO 5. Simplify numerical expressions using the order of operations that include grouping symbols, square roots, cube roots, absolute values, and positive exponents.
8.EE.2. Evaluate square roots of small perfect squares and cube roots of small perfect cubes.
Connections M08-S1C1-04
Model and solve problems involving absolute value.
Students are expected to simplify expressions containing exponents, including zero.
Examples:
(
5
7
)
13
0
3
(
2
7
)
84
35
8
thGrade Blueprint
REV 6.2.11
Page 6 of 44
MT= Math Thematics Book MT-TRB =Math Thematics Teacher’s Resource Book
8
thGrade Blueprint
Assessed Quarter 1
Strand
Concept
Performance Objectives
Process Integration
Strand 5
Explanation, Examples, and Resources
Strand 1: Concept 3: Estimation
PO 1. Make estimates appropriate to a given situation.
8.NS.2. Estimate the value of expressions (e.g. 2).
Connections M08-S1C2-03
Solve problems involving percent increase, percent decrease, and simple interest rates. M08-S1C3-02
Estimate the location of rational and common irrational numbers on a number line. M08-S2C1-02
Make inferences by comparing the same summary statistic for two or more data sets. M08-S2C3-02
Solve counting problems and represent counting principles algebraically including factorial notation.
M08-S3C3-02
Evaluate an expression containing one or two variables by substituting numbers for the variables.
M08- S3C4-02
Solve problems involving simple rates. M08-S4C1-02
Predict results of combining, subdividing, and changing shapes of plane figures and solids. M08-S4C3-01
Make and test a conjecture about how to find the midpoint between any two points in the coordinate plane.
M08-S4C4-01
Solve problems involving conversions within the same measurement system.
M08-S5C1-01
Create an algorithm to solve problems involving indirect measurement, using proportional reasoning, dimensional analysis, and the concepts of density and rate.
M08-S5C2-01. Analyze a problem situation to determine the
question(s) to be answered.
Students estimate using all four operations with whole numbers, fractions, and decimals. Estimation skills include identifying when estimation is appropriate, determining the level of accuracy needed, selecting the appropriate method of estimation, and verifying solutions or determining the reasonableness of situations using various estimation strategies.
Estimation strategies for calculations with fractions and decimals extend from students’ work with whole number operations. Estimation strategies include, but are not limited to:
front-end estimation with adjusting (using the highest place value and estimating from the front end making adjustments to the estimate by taking into account the remaining amounts),
clustering around an average (when the values are close together an average value is selected and multiplied by the number of values to determine an estimate),
rounding and adjusting (students round down or round up and then adjust their estimate depending on how much the rounding affected the original values),
using friendly or compatible numbers such as factors (students seek to fit numbers together - i.e., rounding to factors and grouping numbers together that have round sums like 100 or 1000), and
using benchmark numbers that are easy to compute (students select close whole numbers for fractions or decimals to determine an estimate).
Specific strategies also exist for estimating measures. Students should develop fluency in estimating using standard referents (meters, yard, etc) or created referents (the window would fit about 12 times across the wall).
8
thGrade Blueprint
REV 6.2.11
Page 7 of 44
MT= Math Thematics Book MT-TRB =Math Thematics Teacher’s Resource Book
8
thGrade Blueprint
Assessed Quarter 1
Strand
Concept
Performance Objectives
Process Integration
Strand 5
Explanation, Examples, and Resources
Strand 1: Concept 3: Estimation
PO 2. Estimate the location of rational and common irrational numbers on a number line.
8.NS.2. Use rational approximation of irrational numbers to compare the size of irrational numbers, locate them approximately on a number line diagram.
Connections M08-S1C1-01
Compare and order real numbers including very large and small integers, and decimals and fractions close to zero.
M08-S1C1-02
Classify real numbers as rational or irrational.
M08-S1C3-01
Make estimates appropriate to a given situation.
8
thGrade Blueprint
REV 6.2.11
Page 8 of 44
MT= Math Thematics Book MT-TRB =Math Thematics Teacher’s Resource Book
8
thGrade Blueprint
Assessed Quarter 1
Strand
Concept
Performance Objectives
Process Integration
Strand 5
Explanation, Examples, and Resources
Strand 2: Concept 1: Data Analysis
This concept was introduced in Grade 7, Quarter 4 and it will be mastered in Grade 8.
PO 1. Solve problems by selecting, constructing, interpreting, and calculating with displays of data, including box and whisker plots and scatter plots.
8.SP.2. Know that straight lines are widely used to model relationships between two quantitative variables. For scatter plots that suggest a linear association, informally fit a straight line, and informally assess the model fit by judging the closeness of the data points to the line.
Connections M08-S2C1-04
Determine whether information is represented effectively and appropriately given a graph or a set of data by identifying sources of bias and compare and contrast the effectiveness of different representations of data..
M08-S5C2-07. Isolate and organize mathematical information taken from symbols, diagrams, and graphs to make inferences, draw conclusions, and justify reasoning.
M08-S5C2-10
Solve logic problems involving
multiple variables, conditional
statements, conjectures, and
negation using words, charts,
and pictures.
8
thGrade Blueprint
REV 6.2.11
Page 9 of 44
MT= Math Thematics Book MT-TRB =Math Thematics Teacher’s Resource Book
8
thGrade Blueprint
Assessed Quarter 1
Strand
Concept
Performance Objectives
Process Integration
Strand 5
Explanation, Examples, and Resources
PO 2. Make inferences by comparing the same summary statistic for two or more data sets.
Connections M08-S1C3-01
Make estimates appropriate to a given situation.
M08-S2C1-03
Describe how summary statistics relate to the shape of the distribution.
M08-S5C2-07. Isolate and organize mathematical information taken from symbols, diagrams, and graphs to make inferences, draw conclusions, and justify reasoning.
M08-S5C2-09. Make and test conjectures based on information collected from explorations and experiments.
Summary statistics include: extreme values, mean, median, mode, range, quartiles, and interquartile ranges. Students will include scatter plots, box and whisker plots, and all other applicable representations taught in previous grade levels. They will compare two different populations or two subsets of the same population.
Strand 2: Concept 1: Data Analysis
This concept was introduced in Grade 7, Quarter 4 and it will be mastered in Grade 8.
PO 3. Describe how summary statistics relate to the shape of the distribution.
Connections M08-S2C1-02
Make inferences by comparing the same summary statistic for two or more data sets.
M08-S5C2-07. Isolate and organize mathematical information taken from symbols, diagrams, and graphs to make inferences, draw conclusions, and justify reasoning.
8
thGrade Blueprint
REV 6.2.11
Page 10 of 44
MT= Math Thematics Book MT-TRB =Math Thematics Teacher’s Resource Book
8
thGrade Blueprint
Assessed Quarter 1
Strand
Concept
Performance Objectives
Process Integration
Strand 5
Explanation, Examples, and Resources
Strand 2:
PO 4. Determine whether information is represented effectively and
appropriately given a graph or a set of data by identifying sources of bias and compare and contrast the
effectiveness of different representations of data.
Connections M08-S2C1-01
Solve problems by selecting, constructing, interpreting, and calculating with displays of data including box and whisker plots and scatterplots.
SC08-S1C3-04
Formulate a future investigation based on the data collected.
SC08-S1C3-05
Explain how evidence supports the validity and reliability of a conclusion.
SC08-S2C2-04
Explain why scientific claims may be questionable if based on very small samples of data, biased samples, or samples for which there was no control.
SS08-S1C1-02
Interpret historical data displayed in graphs, tables, and charts.
SS08-S1C1-06
Determine the credibility and bias of primary and secondary sources.
SS08-S2C1-02
Interpret historical data displayed in graphs, tables, and charts.
SS08-S2C1-06
Determine the credibility and bias of primary and secondary.
SS08-S4C1-03
Interpret maps, charts, and geographic databases using geographic information.
M08-S5C2-06. Communicate the answer(s) to the question(s) in a problem using appropriate representations, including symbols and informal and formal
mathematical language.
8
thGrade Blueprint
REV 6.2.11
Page 11 of 44
MT= Math Thematics Book MT-TRB =Math Thematics Teacher’s Resource Book
8
thGrade Blueprint
Assessed Quarter 1
Strand
Concept
Performance Objectives
Process Integration
Strand 5
Explanation, Examples, and Resources
Strand 2:
Design a controlled investigation to support or reject a hypothesis.
M08-S5C2-07. Isolate and organize mathematical information taken from symbols, diagrams, and graphs to make inferences, draw conclusions, and justify reasoning.
Students evaluate an experiment to determine if the design meets the intended purpose, is free of bias, and utilizes an appropriate sample.
Example:
Students design an experiment to determine if there is a correlation between shoe size and height. All designs are evaluated to test for the characteristics above (i.e., intended purpose, free of bias, and appropriate sample size).
PO 1. Use directed graphs to solve problems.
Connections (none)
M08-S5C2-01. Analyze a problem situation to determine the
question(s) to be answered.
M08-S5C2-04. Represent a problem situation using multiple representations, describe the process used to solve the problem, and verify the reasonableness of the solution.
Example:
Four players (Dom, Nathan, Ryan, & Zachary) are playing in a round-robin tennis tournament, where every player plays every other player.
Dom beats Nathan and Ryan, Nathan beats Zachary,
Ryan beats Nathan and Zachary, and Zachary beats Dom.
o Represent this round-robin tournament using a directed graph.
o How many matches are played in a round-robin tournament with four players? Systematically list all the matches. Explain your answer.
o Find all Hamilton paths in this graph.
o “A winner” can be defined as the first player in a Hamilton path. How many possible tournament “winners” are in this example? What conclusions can you draw from this example?
Solution:
8
thGrade Blueprint
REV 6.2.11
Page 12 of 44
MT= Math Thematics Book MT-TRB =Math Thematics Teacher’s Resource Book
8
thGrade Blueprint
Assessed Quarter 1
Strand
Concept
Performance Objectives
Process Integration
Strand 5
Explanation, Examples, and Resources
Strand 2: Concept 4: Vertex-Edge Graphs
This concept was introduced in Grade 7, Quarter 4 and it will be mastered in Grade 8.
(PO 1 continued)
o There are six matches played in a round-robin tournament with four players. These “matches” are represented by each edge in the graph above. One possible systematic list is below:
MATCH #1 – Dom plays Nathan MATCH #2 – Dom plays Ryan MATCH #3 – Dom plays Zachary MATCH #4 – Nathan plays Ryan MATCH #5 – Nathan plays Zachary MATCH #6 – Ryan plays Zachary
Nathan
Dom
8
thGrade Blueprint
REV 6.2.11
Page 13 of 44
MT= Math Thematics Book MT-TRB =Math Thematics Teacher’s Resource Book
8
thGrade Blueprint
Assessed Quarter 1
Strand
Concept
Performance Objectives
Process Integration
Strand 5
Explanation, Examples, and Resources
Strand 2: Concept 4: Vertex-Edge Graphs
This concept was introduced in Grade 7, Quarter 4 and it will be mastered in Grade 8.
(PO 1 continued) o Following the edges in the direction of the arrows, one can find a
Hamilton path that starts with Nathan to Zachary to Dom to Ryan. Thus we can say that “Nathan” is a winner!
Another Hamilton path can start with Ryan to Nathan to Zachary to Dom (or Ryan to Zachary to Dom to Nathan). In both such cases, we can call “Ryan” a winner!
A third type of Hamilton path can start with Dom to Ryan to Nathan to Zachary, so we can call “Dom” a winner!
And finally, the last type of Hamilton path can start with Zachary to Dom to Ryan to Nathan; we can call “Zachary” a winner! Therefore, in this tournament, we can have four different tournament winners!
8
thGrade Blueprint
REV 6.2.11
Page 14 of 44
MT= Math Thematics Book MT-TRB =Math Thematics Teacher’s Resource Book
8
thGrade Blueprint
Assessed Quarter 2
Strand
Concept
Performance Objectives
Process Integration
Strand 5
Explanation, Examples, and Resources
Strand 3: Concept 1: Patterns
PO 1. Recognize, describe, create, and analyze numerical and geometric sequences using tables, graphs, words, or symbols; make conjectures about these sequences.
Connections M08-S3C2-02
Determine if a relationship represented by a graph or table is a function.
M08-S3C2-03
Write the rule for a simple function using algebraic notation.
M08-S3C2-05
Demonstrate that proportional relationships are linear using equations, graphs, or tables.
M08-S5C2-07. Isolate and organize mathematical information taken from symbols, diagrams, and graphs to make inferences, draw conclusions, and justify reasoning.
Given an equation, students should create a table, graph the points on a coordinate grid, and describe the sequence.
Example:
Given a sequence such as 1, 4, 9, 16 … students need to create a table, graph the points on a coordinate grid, and describe algebraically the rule.Note the different representations of a sequence of blocks below:
o
Graphical:
o
Table:Step Number
Blocks
1 1
2 3
3 5
. . .
. . .
n 2n-1
o
Written description: Begin with a square, add 2 squares on each step.o
Physical Models:8
thGrade Blueprint
REV 6.2.11
Page 15 of 44
MT= Math Thematics Book MT-TRB =Math Thematics Teacher’s Resource Book
8
thGrade Blueprint
Assessed Quarter 2
Strand
Concept
Performance Objectives
Process Integration
Strand 5
Explanation, Examples, and Resources
Strand 3:
PO 1. Sketch and interpret a graph that models a given context; describe a context that is modeled by a given graph.
8.F.5. Describe qualitatively the functional relationship between two quantities by analyzing a graph (e.g. where the function is increasing or decreasing, linear or nonlinear). Sketch a graph that exhibits the qualitative features of a function that has been described verbally.
Connections M08-S3C2-04
Identify functions as linear or nonlinear and contrast distinguishing properties of functions using equations, graphs, or tables.
M08-S3C2-05
Demonstrate that proportional relationships are linear using equations, graphs, or tables.
M08-S3C3-01
Write or identify algebraic expressions, or inequalities that represent a situation.
M08-S3C3-04
Translate between different representations of linear equations using symbols, graphs, tables, or written descriptions.
M08-S5C2-07. Isolate and organize mathematical information taken from symbols, diagrams, and graphs to make inferences, draw conclusions, and justify reasoning.
M08-S5C2-05. Apply a previously used problem-solving strategy in a new context.
Use graphs of experiences common to students. Students are expected to both sketch and interpret graphs. They are also expected to explain the
relationship between two quantities and their impact on each other.
Key Vocabulary:
Increasing relationship
Decreasing relationship
Linear
Nonlinear
Example:
Sketch a graph of someone riding a bike to school that starts at home, travels two blocks at a constant speed, travels one block up a hill at a decreasing speed, then travels one block at a constant speed to reach school.
8
thGrade Blueprint
REV 6.2.11
Page 16 of 44
MT= Math Thematics Book MT-TRB =Math Thematics Teacher’s Resource Book
8
thGrade Blueprint
Assessed Quarter 2
Strand
Concept
Performance Objectives
Process Integration
Strand 5
Explanation, Examples, and Resources
Strand 3: Concept 2: Functions and Relation-ships
PO 2. Determine if a relationship represented by a graph or table is a function.
8.F.1. Understand that a function is a rule that assigns to each input exactly one output. The graph of a function is the set of ordered pairs consisting of an input and the corresponding output.
Connections M08-S3C1-01
Recognize, describe, create, and analyze numerical and geometric sequences using tables, graphs, words, or symbols; make conjectures about these sequences.
M08-S3C2 –05
Demonstrate that proportional relationships are linear using equations, graphs, or tables.
M08-S5C2-02. Analyze and compare mathematical strategies for efficient problem solving; select and use one or more strategies to solve a problem.
M08-S5C2-07. Isolate and organize mathematical information taken from symbols, diagrams, and graphs to make inferences, draw conclusions, and justify reasoning.
8
thGrade Blueprint
REV 6.2.11
Page 17 of 44
MT= Math Thematics Book MT-TRB =Math Thematics Teacher’s Resource Book
8
thGrade Blueprint
Assessed Quarter 2
Strand
Concept
Performance Objectives
Process Integration
Strand 5
Explanation, Examples, and Resources
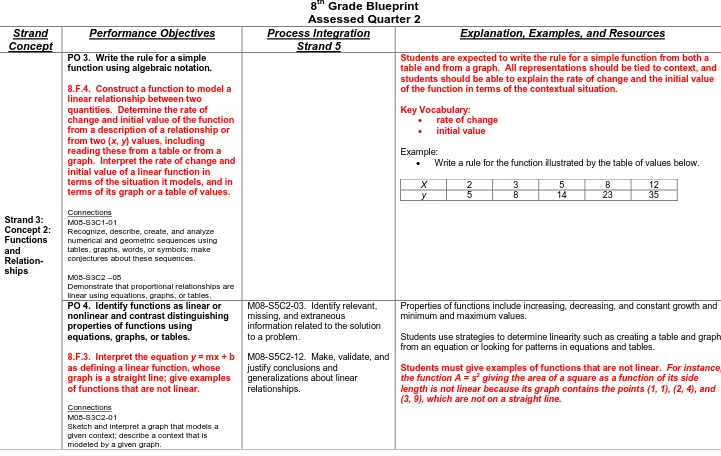
PO 3. Write the rule for a simple function using algebraic notation.
8.F.4. Construct a function to model a linear relationship between two quantities. Determine the rate of change and initial value of the function from a description of a relationship or from two (x, y) values, including reading these from a table or from a graph. Interpret the rate of change and initial value of a linear function in terms of the situation it models, and in terms of its graph or a table of values.
Connections M08-S3C1-01
Recognize, describe, create, and analyze numerical and geometric sequences using tables, graphs, words, or symbols; make conjectures about these sequences.
M08-S3C2 –05
Demonstrate that proportional relationships are linear using equations, graphs, or tables.
Students are expected to write the rule for a simple function from both a table and from a graph. All representations should be tied to context, and students should be able to explain the rate of change and the initial value of the function in terms of the contextual situation.
Key Vocabulary:
rate of change
initial value
Example:
Write a rule for the function illustrated by the table of values below.
X 2 3 5 8 12
PO 4. Identify functions as linear or nonlinear and contrast distinguishing properties of functions using
equations, graphs, or tables.
8.F.3. Interpret the equation y = mx + b as defining a linear function, whose graph is a straight line; give examples of functions that are not linear.
Connections M08-S3C2-01
Sketch and interpret a graph that models a given context; describe a context that is modeled by a given graph.
M08-S5C2-03. Identify relevant, missing, and extraneous
information related to the solution to a problem.
M08-S5C2-12. Make, validate, and justify conclusions and
generalizations about linear relationships.
Properties of functions include increasing, decreasing, and constant growth and minimum and maximum values.
Students use strategies to determine linearity such as creating a table and graph from an equation or looking for patterns in equations and tables.
8
thGrade Blueprint
REV 6.2.11
Page 18 of 44
MT= Math Thematics Book MT-TRB =Math Thematics Teacher’s Resource Book
8
thGrade Blueprint
Assessed Quarter 2
Strand
Concept
Performance Objectives
Process Integration
Strand 5
Explanation, Examples, and Resources
Strand 3:
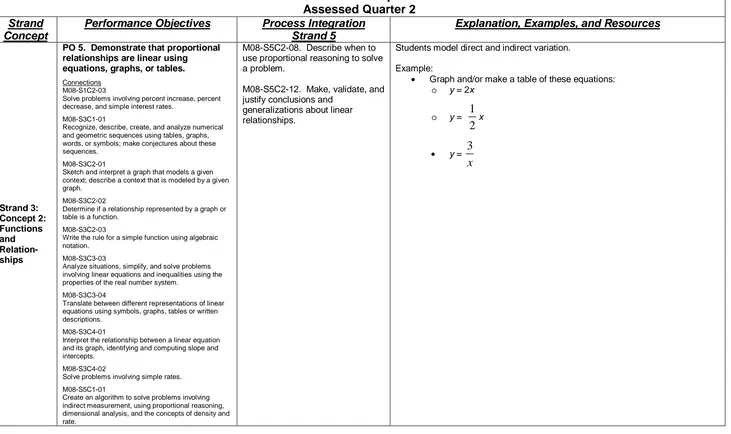
PO 5. Demonstrate that proportional relationships are linear using equations, graphs, or tables.
Connections M08-S1C2-03
Solve problems involving percent increase, percent decrease, and simple interest rates.
M08-S3C1-01
Recognize, describe, create, and analyze numerical and geometric sequences using tables, graphs, words, or symbols; make conjectures about these sequences.
M08-S3C2-01
Sketch and interpret a graph that models a given context; describe a context that is modeled by a given graph.
M08-S3C2-02
Determine if a relationship represented by a graph or table is a function.
M08-S3C2-03
Write the rule for a simple function using algebraic notation.
M08-S3C3-03
Analyze situations, simplify, and solve problems involving linear equations and inequalities using the properties of the real number system.
M08-S3C3-04
Translate between different representations of linear equations using symbols, graphs, tables or written descriptions.
M08-S3C4-01
Interpret the relationship between a linear equation and its graph, identifying and computing slope and intercepts.
M08-S3C4-02
Solve problems involving simple rates.
M08-S5C1-01
Create an algorithm to solve problems involving indirect measurement, using proportional reasoning, dimensional analysis, and the concepts of density and rate.
M08-S5C2-08. Describe when to use proportional reasoning to solve a problem.
M08-S5C2-12. Make, validate, and justify conclusions and
generalizations about linear relationships.
Students model direct and indirect variation.
Example:
Graph and/or make a table of these equations:
o y = 2x
o y =
1
2
x y =
3
8
thGrade Blueprint
REV 6.2.11
Page 19 of 44
MT= Math Thematics Book MT-TRB =Math Thematics Teacher’s Resource Book
8
thGrade Blueprint
Assessed Quarter 2
Strand
Concept
Performance Objectives
Process Integration
Strand 5
Explanation, Examples, and Resources
PO 1. Write or identify algebraic expressions, equations, or inequalities that represent a situation.
Connections M08-S3C2-01
Sketch and interpret a graph that models a given context; describe a context that is modeled by a given graph.
M08-S5C2-04. Represent a problem situation using multiple representations, describe the process used to solve the problem, and verify the reasonableness of the solution.
Example:
Florencia has at most $60 to spend on clothes. She wants to buy a pair of jeans for $22 dollars and spend the rest on t-shirts. Each t-shirt costs $8. Write an inequality for the number of t-shirts she can purchase.
Strand 3: Concept 3: Algebraic Represen-tations
PO 2. Evaluate an expression containing variables by substituting rational numbers for the variables.
Connections M08-S1C3-01
Make estimates appropriate to a given situation.
Any rational number (whole numbers, integers, fractions, and decimals) can be used as the value for a variable.
Example:
b2 – 4ac, where b = 2, a =
1
8
thGrade Blueprint
REV 6.2.11
Page 20 of 44
MT= Math Thematics Book MT-TRB =Math Thematics Teacher’s Resource Book
8
thGrade Blueprint
Assessed Quarter 2
Strand
Concept
Performance Objectives
Process Integration
Strand 5
Explanation, Examples, and Resources
Strand 3: Concept 3: Algebraic Represen-tations
PO 3. Analyze situations, simplify, and solve problems involving linear equations and inequalities using the properties of the real number system.
8.EE.7.b. Solve linear equations with rational number coefficients, including equations whose solutions require expanding expressions using the distributive property and collecting like terms.
Connections M08-S3C2 –05
Demonstrate that proportional relationships are linear using equations, graphs, or tables.
M08-S5C2-02. Analyze and compare mathematical strategies for efficient problem solving; select and use one or more strategies to solve a problem.
The properties of real numbers and properties of equality include but are not limited to the following: associative, commutative, distributive, identity, zero, reflexive, and transitive. The property of closure is not expected at this grade level.
Example:
Steven saved $25 dollars. He spent $10.81, including tax, to buy a new DVD. He needs to set aside $10.00 to pay for his lunch next week. If peanuts cost $0.38 per package including tax, what is the maximum number of packages that Steven can buy?
8
thGrade Blueprint
REV 6.2.11
Page 21 of 44
MT= Math Thematics Book MT-TRB =Math Thematics Teacher’s Resource Book
8
thGrade Blueprint
Assessed Quarter 2
Strand
Concept
Performance Objectives
Process Integration
Strand 5
Explanation, Examples, and Resources
Strand 3: Concept 3: Algebraic Represen-tations
PO 4. Translate between different representations of linear equations using symbols, graphs, tables, or written descriptions.
Connections M08-S3C2-01
Sketch and interpret a graph that models a given context; describe a context that is modeled by a given graph.
M08-S3C2 –05
Demonstrate that proportional relationships are linear using equations, graphs, or tables.
M08-S5C2-04. Represent a problem situation using multiple representations, describe the process used to solve the problem, and verify the reasonableness of the solution.
Example:
Given one representation, students create any of the other
representations that show the same relationship. Representations of linear equations include tables, graphs, equations, or written
descriptions.
o
Equation: y = 4x + 1o
Written description: Susan started with $1 in her savings. She plans to add $4 per week to her savings.o
Table:x y
-2 -7
-1 -3
0 1
1 5
2 9
8
thGrade Blueprint
REV 6.2.11
Page 22 of 44
MT= Math Thematics Book MT-TRB =Math Thematics Teacher’s Resource Book
8
thGrade Blueprint
Assessed Quarter 2
Strand
Concept
Performance Objectives
Process Integration
Strand 5
Explanation, Examples, and Resources
Strand 3:
PO 1. Interpret the relationship between a linear equation and its graph, identifying and computing slope and intercepts.
8.EE.5. Graph proportional
relationships, interpreting the unit rate as the slope of the graph.
8.EE.6. Uses similar triangles to explain why the slope m is the same between any two distinct points on a non-vertical line in the coordinate plane; derive the equation y = mx from a line through the original and the equation y = mx + b for a line intercepting the vertical axis at b.
8.SP.3. Use the equation of a linear model to solve problems in the context of bivariate measurement data,
interpreting the slope and intercept.
Connections M08-S3C2 –05
Demonstrate that proportional relationships are linear using equations, graphs, or tables.
M08-S5C2-07. Isolate and organize mathematical information taken from symbols, diagrams, and graphs to make inferences, draw conclusions, and justify reasoning.
M08-S5C2-12. Make, validate, and justify conclusions and
generalizations about linear relationships.
Students use their understanding from 3.2.2, 3.2.5, 3.3.1 and 3.3.4, to derive the formula for a linear equation. Emphasis should be placed on solving problems in context, such as scatter plots of bivariate data.
Students determine the slope, x- and y- intercepts given an equation in slope intercept form. Students graph an equation given in slope intercept form.
Students should understand the slope in terms of unit rate and its connections to triangle similarity.
Key Vocabulary:
Unit rate
Rate of change
Initial value
Bivariate data
Examples:
In a linear model for a biology experiment, interpret a slope of 15 cm/her as meaning that an additional hour of sunlight each day is associated with an additional 15 cm in mature plant height.
8
thGrade Blueprint
REV 6.2.11
Page 23 of 44
MT= Math Thematics Book MT-TRB =Math Thematics Teacher’s Resource Book
8
thGrade Blueprint
Assessed Quarter 2
Strand
Concept
Performance Objectives
Process Integration
Strand 5
Explanation, Examples, and Resources
Strand 3: Concept 4: Analysis of Change
PO 2. Solve problems involving simple rates.
8.EE.5. Graph proportional
relationships, interpreting the unit rate as the slope of the graph.
Connections M08-S1C2-03
Solve problems involving percent increase, percent decrease, and simple interest rates.
M08-S1C3-01
Make estimates appropriate to a given situation.
M08-S3C2 –05
Demonstrate that proportional relationships are linear using equations, graphs, or tables.
M08-S5C2-08. Describe when to use proportional reasoning to solve a problem.
Simple rates include interest, distance, and percent change.
Emphasize how the unit rate can help to make sense of problems.
Key Vocabulary:
Rate of change
Initial value
Examples:
Mark deposits $120 into a savings account that earns 4% interest annually. The interest does not compound. How much interest will Mark earn after 2 years?
Linda traveled 110 miles in 2 hours. If her speed remains constant, how many miles can she expect to travel in 4.5 hours?
At the end of the first quarter, Robin’s overall grade percentage was 74%. At the end of the second quarter her grade percentage was 88%.8
thGrade Blueprint
REV 6.2.11
Page 24 of 44
MT= Math Thematics Book MT-TRB =Math Thematics Teacher’s Resource Book
8
thGrade Blueprint
Assessed Quarter 3
Strand
Concept
Performance Objectives
Process Integration
Strand 5
Explanation, Examples, and Resources
PO 1. Determine theoretical and experimental conditional probabilities in compound probability experiments.
Connections (none)
Conditional probability is limited to situations with and without replacement.
PO 2. Interpret probabilities within a given context and compare the outcome of an experiment to
predictions made prior to performing the experiment.
Connections (none)
M08-S5C2-07. Isolate and organize mathematical information taken from symbols, diagrams, and graphs to make inferences, draw conclusions, and justify reasoning.
Students predict the outcomes of an experiment with and without replacement by calculating the theoretical probability. They compare the results of the
experiment to their predictions.
Example:
Tyrone takes two coins at random from his pocket, choosing one and setting it aside before choosing the other. Tyrone has 2 quarters, 6 dimes, and 3 nickels in his pocket. Make a prediction based upon the theoretical probability that he chooses a quarter followed by a dime. Try Tyrone’s experiment by performing 50 trials. What is the experimental probability of drawing a quarter followed by a dime? How does the experimental probability compare to your prediction (theoretical probability)?
Strand 2: Concept 2: Probability
PO 3. Use all possible outcomes (sample space) to determine the probability of dependent and independent events.
Connections M08-S2C3-01
Represent, analyze, and solve counting problems with or without ordering and repetitions.
Independent events are two events in which the outcome of the second event is not affected by the outcome of the first event (e.g., rolling two number cubes, tossing two coins, rolling a number cube and spinning a spinner). Dependent events are two events such that the likelihood of the outcome of the second event is affected by the outcome of the first event (e.g., bag pull without
replacement, drawing a card from a stack without replacement, two cars parking in a parking lot).
*
Strand 5, Concept 1 (Algorithms and Algorithmic Thinking) and Strand 5, Concept 2 (Logic, Reasoning, Problem
Solving, and Proof) will be assessed Third Quarter.
8
thGrade Blueprint
REV 6.2.11
Page 25 of 44
MT= Math Thematics Book MT-TRB =Math Thematics Teacher’s Resource Book
8
thGrade Blueprint
Assessed Quarter 3
Strand
Concept
Performance Objectives
Process Integration
Strand 5
Explanation, Examples, and Resources
Strand 2: Concept 3: Systematic Listing and Counting
PO 1. Represent, analyze, and solve counting problems with or without ordering and repetitions.
Connections M08-S2C2-03
Use all possible outcomes (sample space) to determine the probability of dependent and independent events.
M08-S5C2-04. Represent a problem situation using multiple representations, describe the process used to solve the problem, and verify the reasonableness of the solution.
By the end of Grade 8, students are able to solve a variety of counting problems using both visual and numerical representations. They should have had varied counting experiences that, over time, have helped to build these understandings. Initially, they begin by randomly generating all possibilities and then they begin to organize their thinking through visual representations such as charts, systematic listing, and tree diagrams. Finally, they are able to make connections from these visual representations to build numeric solutions.
Through this process of connecting numeric representations with visual
representations, even if they cannot be completely drawn but rather are mentally visualized, students are now able to solve a variety of counting problems numerically.
Example:
Passwords are often a sequence of letters and numbers. A 6-character password is composed of 4 digits and 2 letters.
o If no repetition of letters is allowed, how many passwords are there?
o If no repeating letters or digits are allowed, how many passwords are there?
8
thGrade Blueprint
REV 6.2.11
Page 26 of 44
MT= Math Thematics Book MT-TRB =Math Thematics Teacher’s Resource Book
8
thGrade Blueprint
Assessed Quarter 3
Strand
Concept
Performance Objectives
Process Integration
Strand 5
Explanation, Examples, and Resources
Strand 2: Concept 3: Systematic Listing and Counting
(PO 1 continued) Solution:
Students should be able to represent the general counting problem as: ---- ---- ---- ---- ---- ----
digit digit digit digit letter letter
and mentally visualize a tree diagram which, from some starting vertex, that spans either ten edges (if the initial position is a digit) or twenty-six edges (if the initial position contains a letter) and where each branch of the tree diagram has six levels that represent the next possible options for that position. Their visualization of this problem should convince students that the solution will involve many possibilities, that actually drawing the tree diagram will be hard work, and thus motivate them to find a numerical way to count all possibilities.
o If no repetition of letters is allowed, students should count the number of possible passwords as 10 x 10 x 10 x 10 x 26 x 25 (or some
equivalent arrangement of this multiplication problem, for example, 26 x 25 x 10 x 10 x 10 x 10).
o If no repeating letters or digits are allowed, students should count the number of possible passwords as 10 x 9 x 8 x 7 x 26 x 25.
o If repeating letters and digits are allowed, students should count the number of possible passwords as
8
thGrade Blueprint
REV 6.2.11
Page 27 of 44
MT= Math Thematics Book MT-TRB =Math Thematics Teacher’s Resource Book
8
thGrade Blueprint
Assessed Quarter 3
Strand
Concept
Performance Objectives
Process Integration
Strand 5
Explanation, Examples, and Resources
Strand 2: Concept 3: Systematic Listing and Counting
PO 2. Solve counting problems and represent counting principles algebraically including factorial notation.
Connections M08-S1C3-01
Make estimates appropriate to a given situation.
M08-S5C2-04. Represent a problem situation using multiple representations, describe the process used to solve the problem, and verify the reasonableness of the solution
Example:
Five athletes are entered in a race, and five places are awarded ribbons. In how many different possible ways might they finish?
8
thGrade Blueprint
REV 6.2.11
Page 28 of 44
MT= Math Thematics Book MT-TRB =Math Thematics Teacher’s Resource Book
8
thGrade Blueprint
Assessed Quarter 3
Strand
Concept
Performance Objectives
Process Integration
Strand 5
Explanation, Examples, and Resources
PO 1. Identify the attributes of circles: radius, diameter, chords, tangents, secants, inscribed angles, central angles, intercepted arcs,
circumference, and area.
Connections (none)
M08-S5C2-11. Identify simple valid arguments using if… then
statements.
Example:
Students will draw a circle and identify and label attributes or identify attributes from a diagram.
Strand 4: Concept 1: Geometric Properties
PO 2. Predict results of combining, subdividing, and changing shapes of plane figures and solids.
Connections M08-S1C3-01
Make estimates appropriate to a given situation.
M08-S4C2-02
Describe the transformations that create a given tessellation.
M08-S5C2-09. Make and test conjectures based on information collected from explorations and experiments.
8
thGrade Blueprint
REV 6.2.11
Page 29 of 44
MT= Math Thematics Book MT-TRB =Math Thematics Teacher’s Resource Book
8
thGrade Blueprint
Assessed Quarter 3
Strand
Concept
Performance Objectives
Process Integration
Strand 5
Explanation, Examples, and Resources
Strand 4: Concept 1: Geometric Properties
PO 3. Use proportional reasoning to determine congruence and similarity of triangles.
Connections M08-S4C4-02
Solve geometric problems using ratios and proportions.
M08-S5C2-08. Describe when to use proportional reasoning to solve a problem.
M08-S5C2-13. Verify the
Pythagorean Theorem using a valid argument.
Proportional reasoning includes consideration of conservation of angle and proportionality of side length.
Example:
The triangles shown in the figure are similar. Find the length of the sides labeled x and y.
Solution:
3
2
4
y
3
2
5
x
8
3
y
3
x
10
3
2
2
3
8
y
3
1
3
3
10
x
8
thGrade Blueprint
REV 6.2.11
Page 30 of 44
MT= Math Thematics Book MT-TRB =Math Thematics Teacher’s Resource Book
8
thGrade Blueprint
Assessed Quarter 3
Strand
Concept
Performance Objectives
Process Integration
Strand 5
Explanation, Examples, and Resources
Strand 4: Concept 1: Geometric Properties
PO 4. Use the Pythagorean Theorem to solve problems.
8.G.6. Explain a proof of the Pythagorean Theorem and its converse.
8.G.7. Apply the Pythagorean Theorem to determine unknown side lengths in right triangles in real-world and mathematical problems in two-dimensions.
Connections M08-S4C3-02
Use the Pythagorean Theorem to find the distance between two points in the coordinate plane.
M08-S5C2-13
Verify the Pythagorean Theorem using a valid argument.
M08-S5C2-02. Analyze and compare mathematical strategies for efficient problem solving; select and use one or more strategies to solve a problem.
M08-S5C2-06. Communicate the answer(s) to the question(s) in a problem using appropriate representations, including symbols and informal and formal
mathematical language.
Students should be familiar with the common Pythagorean triples.
Students should be able to explain a proof of the Pythagorean Theorem and its converse. Converse: If the sum of the square of two sides is equal to the square of the third side of a triangle, then the triangle is a right triangle.
Examples:
Is a triangle with side lengths 5 cm, 12 cm, and 13 cm a right triangle? Why or why not?
8
thGrade Blueprint
REV 6.2.11
Page 31 of 44
MT= Math Thematics Book MT-TRB =Math Thematics Teacher’s Resource Book
8
thGrade Blueprint
Assessed Quarter 3
Strand
Concept
Performance Objectives
Process Integration
Strand 5
Explanation, Examples, and Resources
Strand 4: Concept 2: Transforma tion of Shapes
PO 1. Model the result of rotations in multiples of 45 degrees of a 2-dimensional figure about the origin.
Connections (none)
M08-S5C2-02. Analyze and compare mathematical strategies for efficient problem solving; select and use one or more strategies to solve a problem.
M08-S5C2-05. Apply a previously used problem-solving strategy in a new context.
Figures may be rotated with the origin at the center or another point on the figure or using the origin as the point of rotation where the figure does not contain the origin.
8
thGrade Blueprint
REV 6.2.11
Page 32 of 44
MT= Math Thematics Book MT-TRB =Math Thematics Teacher’s Resource Book
8
thGrade Blueprint
Assessed Quarter 3
Strand
Concept
Performance Objectives
Process Integration
Strand 5
Explanation, Examples, and Resources
PO 2. Describe the transformations that create a given tessellation.
Connections M08-S4C1-P02
Predict results of combining, subdividing, and changing shapes of plane figures and solids.
Students will look at a tessellation or Frieze pattern. They will identify the original figure and the transformation(s) used to create the tessellation or Frieze pattern.
Example:
Look at the pattern below. What figure was used to create the pattern? What transformation(s) did the figure undergo?
Strand 4: Concept 2: Transforma tion of Shapes
PO 3. Identify lines of symmetry in plane figures or classify types of symmetries of 2-dimensional figures.
Connections (none)
8
thGrade Blueprint
REV 6.2.11
Page 33 of 44
MT= Math Thematics Book MT-TRB =Math Thematics Teacher’s Resource Book
8
thGrade Blueprint
Assessed Quarter 3
Strand
Concept
Performance Objectives
Process Integration
Strand 5
Explanation, Examples, and Resources
PO 1. Make and test a conjecture about how to find the midpoint between any two points in the coordinate plane.
Connections M08-S1C3-01
Make estimates appropriate to a given situation.
M08-S5C2-09. Make and test conjectures based on information collected from explorations and experiments.
Students are expected to find the midpoint between any two points including points that are not horizontal or vertical from each other as shown in the model below. Students should not be given the formula, but rather create a formula or process with which to find the midpoint. Students test their conjecture and the conjecture of others to determine their validity. Students can then compare their conjectures to the formula or to the graphical algorithm for finding the midpoint of a line segment.
Strand 4: Concept 3: Coordinate Geometry
PO 2. Use the Pythagorean Theorem to find the distance between two points in the coordinate plane.
8.G.8. Apply the Pythagorean Theorem to find the distance between two points in a coordinate system.
Connections M08-S4C1-04
Use the Pythagorean Theorem to solve problems.
M08-S5C2-06. Communicate the answer(s) to the question(s) in a problem using appropriate representations, including symbols and informal and formal
mathematical language.
M08-S5C2-13. Verify the
Pythagorean Theorem using a valid argument.
8
thGrade Blueprint
REV 6.2.11
Page 34 of 44
MT= Math Thematics Book MT-TRB =Math Thematics Teacher’s Resource Book
8
thGrade Blueprint
Assessed Quarter 3
Strand
Concept
Performance Objectives
Process Integration
Strand 5
Explanation, Examples, and Resources
PO 1. Solve problems involving conversions within the same measurement system.
Connections M08-S1C3-01
Make estimates appropriate to a given situation.
M08-S5C1-01
Create an algorithm to solve problems involving indirect measurement, using proportional reasoning, dimensional analysis, and the concepts of density and rate.
M08-S5C2-08. Describe when to use proportional reasoning to solve a problem.
M08-S5C1-01 Create an algorithm to solve problems involving indirect measurements, using proportional reasoning, dimensional analysis, and the concepts of density and rate.
Algorithms
and
Algorithmic Thinking
Examples:
U.S. Customary: A new carpet installer measured and found the tear in the carpet to be 75 square inches. When he went to order carpet for a patch, the carpet distributor wanted the measurement in square feet. What measurement should the installer give to the distributor?
Metric: The liquid in a beaker measures 250 milliliters. How many liters is this?
Dimensional analysis uses ratios to simplify the conversion among or
between units of measure. There is a strong connection between this
performance objective and converting within measurement systems
Strand 4:Concept 4: Measure-ment
PO 2. Solve geometric problems using ratios and proportions.
Connections M08-S4C1-03
Use proportional reasoning to determine congruence and similarity of triangles.
M08-S5C2-13
Verify the Pythagorean Theorem using a valid argument.
M08-S5C2-08. Describe when to use proportional reasoning to solve a problem.
Example:
8
thGrade Blueprint
REV 6.2.11
Page 35 of 44
MT= Math Thematics Book MT-TRB =Math Thematics Teacher’s Resource Book
8
thGrade Blueprint
Assessed Quarter 3
Strand
Concept
Performance Objectives
Process Integration
Strand 5
Explanation, Examples, and Resources
Strand 4: Concept 4: Measure-ment
PO 3. Calculate the surface area and volume of rectangular prisms, right triangular prisms, and cylinders.
8.G.9. Know the formulas fro the volumes of cones, cylinders, and spheres and use them to solve real-world and mathematical problems.
Connections (none)
Students understanding of volume can be supported by focusing on the area of base times the height to calculate volume. They should examine the formula relationships for cones, cylinders, and spheres. Students must know the formulas by 2013-2014.
Students understanding of surface area can be supported by focusing on the sum of the area of the faces. Nets can be used to evaluate surface area calculations.
Example:
8
thGrade Blueprint
REV 6.2.11
Page 36 of 44
MT= Math Thematics Book MT-TRB =Math Thematics Teacher’s Resource Book
8
thGrade Blueprint
Assessed Quarter 4
(Year 1 Standards)
Strand
Concept
Performance Objectives
Process Integration
Strand 5
Explanation, Examples, and Resources
PO 1. Draw inferences about data sets from lists, tables, matrices, and plots.
Connections SCHS-S1C4-02
Produce graphs that communicate data.
MHS-S5C2-06. Synthesize mathematical information from multiple sources to draw a
conclusion, make inferences based on mathematical information, evaluate the conclusions of others, analyze a mathematical argument, and recognize flaws or gaps in reasoning.
Example:
Garlic is sorted by size of cloves and by quality (consumer grade, restaurant grade, and manufacture grade). The matrix below represents the inventory of garlic harvested by Company A in one month. The volume of garlic purchased annually by the restaurant industry is 7,884 cloves. Does Company A need to change their planting practices to meet the demand of the restaurant industry?
Strand 2: Concept 1: Data Analysis
PO 2. Organize collected data into an appropriate graphical representation with or without technology.
Connections (none)
MHS-S5C2-01. Analyze a problem situation, determine the question(s) to be answered, organize given information, determine how to represent the problem, and identify implicit and explicit assumptions that have been made.