M – 20
ACCURACY COMPARISON OF SIMPLE, SYSTEMATIC, AND STRATIFIED
RANDOM SAMPLING FOR ESTIMATING POPULATION
(MINIMARKET CASE IN INDONESIA)
Abadi Wibowo1, Indahwati2, I Made Sumertajaya3 Bogor Agricultural University, Indonesia
Erni Tri Astuti4 Institut of Statistic, Indonesia
Email: [email protected]
Abstract
This paper aims to compare the accuracy of three methods of sampling, namely Simple Random Sampling (SRS), Systematic Random Sampling and Stratified Random Sampling. The data used as the simulation is data PODES 2011. So the data that is used as a parameter in this study are primary data in the form of data results PODES 2011 were rural / village with minimarket (RVM). The method of analysis is done in two stages. The first phase saw the condition of the minimarket population data as a basis for exploration. The second stage of the estimation simulate the total population and the variance by using simple random sampling, systematic random sampling, and stratified random sampling. The next stage of comparing the results of estimation of population parameters of the sampling methods to the total population of the minimarket PODES 2011. The results are reviewed based on the accuracy of each method. Stratified random sampling method (DKM as a base coating) with a sample size of 500 generate predicted values with the highest degree of accuracy compared with the SRS and systematic random sampling. Its bias value at 22 outlets, its standard error of 2606.2 outlets, and his MSE of 6.79254 million.
Keywords: accuracy, comparison, simple, systematic, stratified, random
INTRODUCTION
Sampling method is divided into two, namely sampling random and sampling is not random (Sugiyono, 2011). Some techniques sampling with probability sampling is serbagai follows simple random sampling, systematic random sampling, stratified random sampling, and cluster random sampling. Some sampling techniques with non-probability sampling is as the following convenience sampling, judgment sampling, quota sampling, and snowball sampling.
In probability sampling, frame is absolutely necessary sample. Sampling frame is a list containing all members/elements of the population that will be the basis for the selection of samples (Sudaryono, 2012). One of the advantages of sampling random is that it can be used to draw conclusions
Sampling method with simple random sampling done if an instance with n elements selected from a population with N elements such that every possible instance with n elements has the same chance of being selected (Cochran, 1991). Systematic random sampling method, the population consists of N units are numbered 1 to N in some arrangement. To select a sample size of n units, randomly taken a unit of k units first, then take every multiple of k (Cochran, 1991). Stratified random sampling method is done by dividing the population into smaller population (stratum). The formation of the stratum should be such that each sratum homogeneous by one or several specific criteria, then the sample is taken from each stratum randomly (Cochran, 1991).
error, bias, and the mean square error less say more accurate than the other methods.
This paper tries to compare the value of the standard error, bias, and the mean square error of the sample were selected by simple random sampling method (SRS), systematic random sampling and stratified random sampling using data Village Potential in 2011 and then will be evaluated which method is the most accurate.
This paper aims to compare the accuracy of three methods of sampling. This paper will only discuss about the sampling method was limited to simple random sampling (SRS), systematic random sampling and stratified random sampling and comparison of the accuracy of the three methods of sampling. Observed data is the data villages / village with minimarket across Indonesia.
One reason to use the mini as an observation of this study because of the more extensive range of minimarket up village. This was caused by rising incomes, increasing population, the growth of middle class society of rapid income, urbanization, a strong level of consumer optimism, and the growth of commercial property (AC Nielsen in the Retail Industry Update Vol 16 Mandiri 2014). The existence of minimarket which has reached the outlying villages have a positive impact as well as negative impacts. Some positive side, minimarket can supply food and beverage products easier at competitive prices, convenient shopping atmosphere, and management of modern management. While one downside, the existence of minimarket can threaten the existence of the traditional stalls.
This research can provide some information applying sampling methods, especially with regard to the selection of a random sample. Application information can be useful as a reference for the survey or government agencies in order to use the most appropriate sampling method to infer the population, especially the population of minimarket in Indonesia. Thus, accurate data can be obtained so as to approach or even equal to the actual results.
RESEARCH METHOD Data
The data will be used in this research is data from Village Potential Data Collection (PODES) 2011. PODES an entire village collection / villages throughout Indonesia. PODES data collection is done before the implementation of a census that is 3 times in ten years.
Materials Research
The data used as the simulation is data PODES 2011. So the data that is used as a parameter in this study are primary data in the form of data results PODES 2011 were rural / village with minimarket (RVM). The data obtained from the BPS. The data structure includes code provincial, district code / city, sub-district code, code villages / districts and the number minimarket. Definition minimarket is a modern store with a floor area of less than 400 square meters. Modern store is a store with a self-service system and sell various types of goods at retail.
Analysis Method
The first phase saw the condition of the minimarket population data as a basis for exploration. The second stage of the estimation simulate the total population and the manifold by using simple random sampling, systematic random sampling, stratified random sampling, and a two-stage cluster sampling. The next two-stage of comparing the results of estimation of population parameters of the various sampling techniques to the total population PODES minimarket, 2011.
Simple Random Sampling
As the survey frame is a list (number) RVM throughout Indonesia. Mechanism suspect population is randomly drawn sample of all the serial numbers RVM as 8591 in Indonesia. Samples were taken as 300, 400, and 500 are used to estimate the total population of the entire Indonesian minimarket and a wide penduganya, this estimation is done 100 times to obtain an average estimate of the total population and its variance.
Systematic Random Sampling
As in simple random sampling, survey frame is a list of minimarket in Indonesia as many as 8591 RVM. Then determine many samples taken (n1 = 300, n2 = 400, and n3 = 500), the next step determines the value of k is k = N / n, take the first random sample of 1 to k, the next second example is the first example plus k, and so on. Examples that have been taken are used to estimate the total population. Estimation is done 100 times to obtain an average estimate of the total population and its variance.
Stratified Random Sampling
In this analysis, there are two types of layers of the coating based on a number of minimarket and coatings based on urban-rural status. Type as the first layer is a layer of minimarket on RVM. Layer 1 is a minimarket with 1-4 outlets and layer 2 is the minimarket with over 4 outlets. So the survey framework is RVM with 1-4 outlets and minimarket with over 4 outlets. The second layer as the layer type is urban and rural status. Layer 1 is RVM with urban status and layer 2 is RVM with rural status. So the survey framework is RVM with urban status and RVM with rural status. Samples were taken at random from each layer proportionally. Examples that have been taken are used to estimate the total population. Estimation is done 100 times to obtain an average estimate of the total population and its variance.
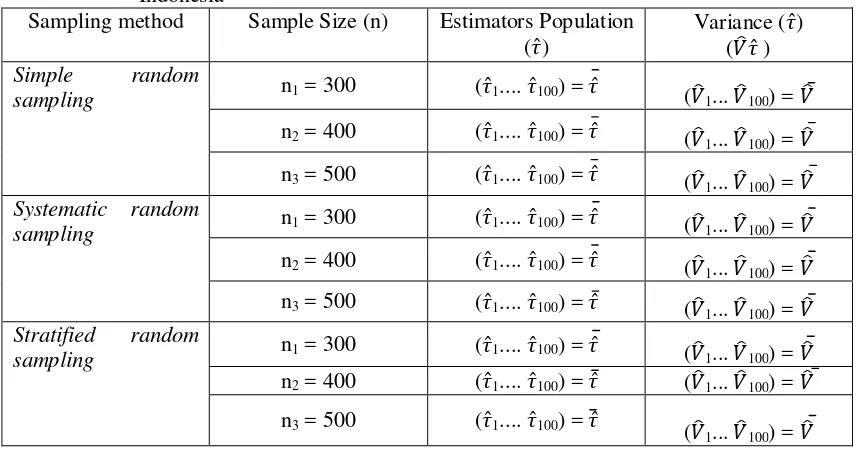
Table 1 below presents a summary of the simulation prediction minimarket population at various sampling techniques.
Table 1 Simulation several sampling techniques to estimate population minimarket in Indonesia
Sampling method Sample Size (n) Estimators Population ( ̂)
Variance ( ̂) ( ̂ )
Simple random
sampling n1 = 300 ( ̂1.... ̂100) = ̂ ( 1... 100) = n2 = 400 ( ̂1.... ̂100) = ̂ ( 1... 100) =
n3 = 500 ( ̂1.... ̂100) = ̂ ( 1... 100) =
Systematic random
sampling n1 = 300 ( ̂1.... ̂100) = ̂ ( 1... 100) =
n2 = 400 ( ̂1.... ̂100) = ̂ ( 1... 100) =
n3 = 500 ( ̂1.... ̂100) = ̂ ( 1... 100) =
Stratified random
sampling n1 = 300 ( ̂1.... ̂100) = ̂ ( 1... 100) =
n2 = 400 ( ̂1.... ̂100) = ̂ ( 1... 100) =
n3 = 500 ( ̂1.... ̂100) = ̂
( 1... 100) =
Sampling Selection Criteria
Reliability. Terandal characteristics of a population estimate relates to how the ability of a probe (through repetition) generates an estimated . If we assume that no measurement error in a survey, the reliability of an estimator can be expressed in the context of a variety of sampling, or equivalent to the standard error. The smaller the standard error of the estimate, the greater the reliability.
Validity. Invalid characteristics of a population estimators related to how the middle value of a probe (through repetition) produces a different allegations with the actual parameter values. If we assume that no measurement error, the validity can be evaluated by observing the value of the bias of penduganya. Bias, B( ̂) of estimated population ( ̂) of the population parameter (τ) is the difference between the expected value E ( ̂) with the actual value (τ), B( ̂) = E( ̂)−(τ). Estimates of the population is said to be biased if B( ̂) = 0. The smaller the bias, the greater validity.
Accuracy of an estimator is the extent to which the average an estimated value deviates from the value of the parameter being measured. Accuracy of an estimator is generally evaluated by MSEnya value, equivalent to the value of the square root of the MSE (symbolized by the RMSE or Root Mean Square Error). Mean Square Error, of estimators of the population (τ̂), written MSE (τ), defined as the average of the squared deviations estimate of the total population with true population parameter multiplied by the odds πi . MSE (τ) = ∑ (τ̂ −τ)2 πi . MSE different from the variance estimator. MSE is the average of the squared deviations of the actual parameters, and variety of estimators is the average squared deviation of the average distribution of sampling. Relationship MSE and variance estimators are as follows, MSE (τ) = Var (τ) + B2(τ). The smaller the MSE value of a probe, the greater the value of its accuracy. Accuracy of a probe cover both the previous characteristics of reliability and validity.
The best sampling selection criteria based on the criteria of reliability (based on the value of the standard error), validity (based on the value of deviation / bias), and accuracy (based MSE).
Related Research
Several studies on the comparison method of sampling has been carried out. In 2006, Roch Widaningsih conduct comparative research sampling method for estimating populations of beef cattle in Karangasem regency. Then Nurhayati sampling method comparison study between simple random sampling stratified random sampling using the data generation. Then, in 2011, Eka Kusmayadi conduct comparative research sampling method to estimate the results of the election in Jembrana.
RESULT AND DISCUSSION Description of Data
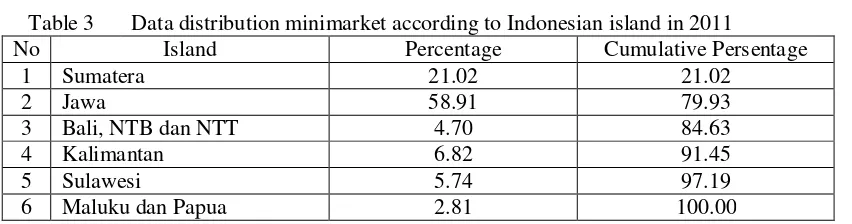
Table 2 shows the data description minimarket population in Indonesia in 2011. The number of 35 148 outlets minimarket. Based RVM, the average minimarket in each village / town at 4.09 74.3 manifold outlets and outlets. Village / town with a mini-high of 158 outlets.
Table 2 Data on DKM minimarket population in Indonesia in 2011
Parameter Value
The Amount Mean Variance
35148 4,09 74,305
Table 3 Data distribution minimarket according to Indonesian island in 2011
No Island Percentage Cumulative Persentage
1 Sumatera 21.02 21.02
Table 4 shows that the simulation results, simple random sampling method produces relatively small bias. Bias in the smallest sample size of 400. While the larger the sample size, showing the smaller variety. This resulted in the MSE is also getting smaller in line with the small range of the enlarged sample size. In addition, the smaller the RSE provide information in line with the increase in the size of the sample. Simple random sampling method with a sample size of 500 and the smallest MSE has the highest level of accuracy.
Table 4 shows that the simulation results, systematic random sampling method produces biased relatively small. The smallest bias in the size of the larger sample size of 500. While the larger the sample size, showing the smaller variety. This resulted in the MSE is also getting smaller in line with the small range of the enlarged sample size. In addition, the smaller the RSE provide information in line with the increase in the size of the sample. Systematic random sampling method with a sample size of 500 and the smallest MSE has the highest level of accuracy. Table 4 shows that the simulation results stratified random sampling method based on the amount of the mini and urban and rural status as a layer produces a relatively small bias. Bias smallest at 500. While the sample size the greater the sample size, showing the smaller variety. This resulted in the MSE is also getting smaller in line with the small range of the enlarged sample size. In addition, the smaller the RSE provide information in line with the increase in the size of the sample. Stratified random sampling method based on the amount of the mini as a layer with a sample size of 500 and the smallest MSE has the highest level of accuracy.
Comparison of the simulation results of several methods of sampling are shown in Table 4. Based on the MSE value and the standard error of each method, stratified random sampling method (number minimarket on RVM as a base coating) with a sample size of 500 generate predicted values with the level of reliability and highest accuracy . Value 2606.2 standard error of its outlets and MSE of 6792540. The simple random sampling method with a sample size of 300 generate predicted values with the level of reliability and the lowest accuracy. Its standard error values of 4173.8 outlets and its MSE of 17.73861 million.
Comparison between simple random sampling and systematic random sampling, systematic random sampling method shows the sample size of 500 is higher reliability and accuracy. This is indicated by the value of the standard error of 3080.9 outlets and MSE of 9,675,223.
Comparison between simple random sampling and stratified random sampling, showing stratified random sampling method with a sample size of 500 is higher reliability and accuracy. This is indicated by the value of the standard error of 2606.2 outlets and MSE of 6.79254 million.
Tabel 4
Comparison of the simulation results of the sampling method
Sampling sampling method has the highest level of accuracy than simple random sampling and systematic random sampling. The accuracy level based on the value of standard error, bias, and the smallest MSE.
SUGGESTION
The results of this study indicate that a similar study be done on other variables with different characteristics and national scale. Thus it can be obtained by standard sampling techniques in the suspect population.
BIBLIOGRAPHY
Cochran, W. G. (1991). Teknik Penarikan Sampel. Jakarta: UI Press. Sudaryono. (2012). Statistika Probabilitas. Yogyakarta: CV. Andi Offset. Sugiyono. (2011). Statistika Untuk Penelitian. Bandung: CV. Alfabeta.
Supranto, J. (2007). Teknik Sampling Untuk Survey dan Eksperimen. Jakarta: PT Rineka Cipta. Statistics. (2001). Metode Sampling. Jakarta: BPS
Statistics. (2011). Potential Village 2011, Guidelines for Enumerators. Jakarta: BPS
Scheaffer R, Mendenhall W, Ott L. (1990). Elementary Survey Sampling. Fourth Edition; Boston[US]: PWS-KENT Publishing Company.
Bank Mandiri. (2014). Industry Update Ritel Vol 16 Mandiri. [Internet]. [diakses pada tanggal 10 Maret 2015]. Tersedia pada:
http://www.bankmandiri.co.id/indonesia/eriview-pdf/OJHH51192704.pdf
Widaningsih, Roch. (2006). " Perbandingan Berbagai Teknik Penarikan Contoh Untuk Menduga Populasi Sapi Potong: Kasus Kabupaten Karangasem ". Thesis. Bogor [ID]: Bogor Agricultural University.
Kusmayadi, Eka. (2011). " Perbandingan Teknik Penarikan Contoh Untuk Menduga Hasil Pemilukada: Studi Kasus Pemilukada Kabupaten Jembrana, 2010". Thesis. Bogor [ID]: Bogor Agricultural University.