THE EFFECTS OF UTILITARIAN AND HEDONIC ONLINE SHOPPING VALUE ON CONSUMER PERCEIVED VALUE
A Research Paper Submitted in Partial Fulfilment of the Requirements to Obtain
Bachelor Degree of Management Double Degree
Written by: MOHAMMAD
B100122005
DEPARTMENT OF MANAGEMENT DOUBLE DEGREE PROGRAM ECONOMICS AND BUSINESS FACULTY MUHAMMADIYAH UNIVERSITY OF SURAKARTA
iii
PERNYATAAN
Dengan ini saya menyatakan bahwa dalam naskah publikasi ini tidak terdapat karya
yang pernah diajukan untuk memperoleh gelar kesarjanaan di suatu perguruan tinggi dan
sepanjang pengetahuan saya juga tidak terdapat karya atau pendapat yang pernah ditulis
atau diterbitkan orang lain, kecuali secara tertulis diacu dalam naskah dan disebutkan
dalam daftar pustaka.
Apabila kelak terbukti ada ketidakbenaran dalam pernyataan saya di atas, maka
akan saya pertanggungjawabkan sepenuhnya.
Surakarta, 28 Oktober 2016 Penulis
1
THE EFFECTS OF UTILITARIAN AND HEDONIC ONLINE SHOPPING VALUE ON CONSUMER PERCEIVED VALUE
Abstrak
Penelitian ini bertujuan untuk mengetahui seberapa besar pengaruh nilai belanja hedonis dan utilitarian terhadap perceived value dalam kegiatan belanja melalui e-commerce. dua pengaruh yang ingin diketahui adalah: (1) pengaruh Utilitarian terhadap perceived value konsumen e-commerce, (2) pengaruh hedonic value terhadap perceived value konsumen e-commerce. Penelitian ini dapat dikategorikan sebagai penelitian kuantitatif karena data diperoleh berupa angka yang berasal dari kuesioner. Non probability sampling dipakai untuk pengambilan sampel. Data dikumpulkan dari 220 responden yang dipilih menggunakan pertimbangan yaitu harus memiliki kriteria pernah melakukan pembelian produk melalui e-commerce. Analisis data dilakukan dengan menggunakan analisis regresi linier berganda. Hasil penelitian menunjukkan: (1) utilitarian value berpengaruh positif dan signifikan terhadap perceived value konsumen e-commerce, (2) hedonic value berpengaruh positif dan signifikan terhadap perceived value konsumen e-commerce
Kata kunci: nilai utilitarian, nilai hedonis, nilai persepsi
Abstract
This study aims to determine how hedonic and utilitarian value influences on perceived value in shopping activities through e-commerce. Two questions that this research seeks to answer are: (1) the effect of utilitarian on perceived value of e-commerce consumer, (2) the effect of hedonic value on perceived value of e-commerce consumer. This research is quantitative research because the data obtained is in numbers derived from questionnaire. Non-probability sampling is used in taking the sample. The data were collected from 220 respondents’ who have made a purchase through an e-commerce. The data were analyzed using multiple linear regression analysis. The result of the research shows: (1) utilitarian value has positive and significant effect on perceived value of e-commerce consumers. (2) hedonic value has positive and significant effect on perceived value of e-commerce consumers.
Keywords: utilitarian value, hedonic value, perceived value, e-commerce
1. INTRODUCTION
2
important with the continuous advances in telecommunication and computer networks (Purbo, 2001). The companies that use e-commerce will get benefits: (1) the opening of a new revenue stream that are more promising that cannot be found traditional transaction, (2) increasing market exposure, (3) lowering operational costs, (4) widening global reach, (5) increasing customer loyalty, (6) improving the management of suppliers, (7) shortening production time and (8) increasing the value chain (Purbo and Wahyudi, 2001).
E-commerce campaign can be run through online sites and other online social media, this has benefits and provide ease in transaction. The benefits include, cost efficiency, time efficiency in the distribution of information and wide range of products that can be chosen by consumers. The payment facility also can be done through online via bank transfer or offline via cost on delivery. The growth in e-commerce transactions in Indonesia is fairly rapid, internet users in Indonesia has reached 90 million in 2015 or equal to around 38 percent of the population, with accessing social media being the highest. E-commerce is expected to reach 140 million consumers by 2020. Only 60% of them have bank accounts and 85% possessing mobile phones, mobile payment and mobile banking have a forcefull growth as reported (Internet retail expo Indonesia, 2016). The growing number of buyers and sellers in e-commerce indicates that the society has accepted a new and modern way of shopping, this makes the actors of e-commerce need to identify the consumers in online shopping.
3
treating oneself, (4) Idea: keeping up with trends, seeing new products and innovations, (5) role: enjoyment derived from shopping for others and (6) value : seeking sales, discounts, bargains. To, Liao and Lin (2007), concluded argued that utilitarian shopping value and hedonic shopping value play a role in internet shopping. To evaluate consumer behavior perceived value is used as the depedent variabel, perceived value is based on thorough evaluation made by consumers for a product or a service (Zeithaml, 1988). Moreover, it can be expressed as the difference between the perceived benefits and the perceived costs (Jen and Hu, 2003). Monroe (1991) stated that buyers tend to be more sensitive to losses than profits. Thus, this study aims to investigate utilitarian and hedonic values in relation to perceived value of the students of University of Muhammadiyah Surakarta in online shopping or e-commerce.
2. LITERATURE REVIEW AND HYPHOTESIS
This section will describe theories and previous research that support this research, namely regarding to e-commerce and variables in this research. In general terms, Lignell (2014) stated that e-commerce refers to buying or ordering goods via the internet for a consumer’s personal or household’s consumption, regardless of whether the invoice for payment arrives later or the goods are paid immediately via electronic banking, credit card, electronic payment or similar. Chien et al, (2010) states that by doing online shopping customers can perform 24 hours transaction, boundless by time and place. Moreover, Miyazaki and Fernandez (2001) also states that by doing online shopping, customers can get satisfaction and save transportation cost, unlike when they are doing traditional transactions. Recently, Indonesians are more eager to spend their money online (Yulisman, 2012).
A survey conducted in March 2010 by Nielsen Indonesia found that 68% of Indonesia’s online population had shopped on the Internet at least once. Books are the most popular online purchase among Indonesians, with 38% saying they would buy a book online at some time during the next six months. An additional 33% said they intended to buy clothing, while 29% said airline tickets and 27% electronics.
4
be interpreted as the needs of consumers in saving time and money, while achievement can be defined as the achievement of acquiring the needed products.
Bridges and Florsheim (2008), Overby and Lee (2006), To et al. (2007) agree that consumers which have utilitarian shopping value feel satisfied after shopping. Kim, Xu, and Gupta (2012) on their research use the rapidity and convenience of online shopping as the indicator of the research. Thus, the function of utilitarian will grow if a customer obtains the goods/services required and even grow more if the customer can get one with less effort. Perception to utilitarian value depend on the outcome of the consumption. Consumers will be satisfied if they had a product or service that meet to their needs in a way that is efficient, especially in terms of time spent. It is characterized by deliberate purchase performed by consumers to meet their needs in a short time.
Hedonic value perharps one of the most important factor in customer perceived value. Hedonic consumers looking for websites that provide not only the safety of the transactions, privacy, interactive controls, and quick access to vast amounts of information, but also the intrinsic experience by sensual stimulation, emotional value, and aesthetics, which enhance the pleasure of shopping online. People of hedonic are always looking for ways to get pleasure in their shopping. Bridges and Florsheim (2008), Overby and Lee (2006), To et al., (2007) agree that consumers with hedonic value feel happy and excited from their shopping experience. Kim, Xu, and Gupta (2012) on their research used the comfort and pleasure as an indicator in the research.
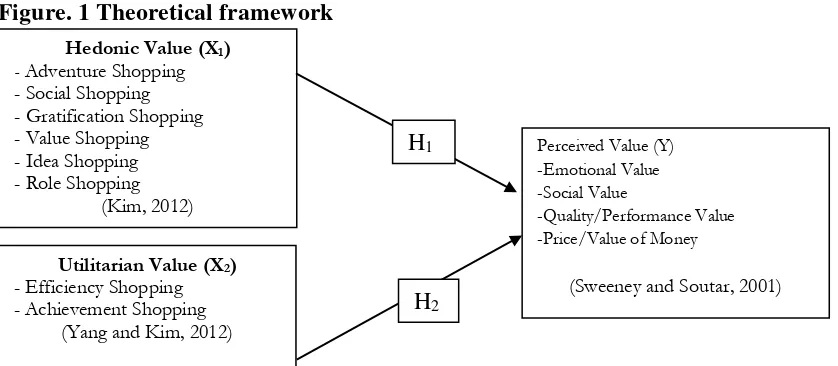
Perceived value is the difference between the prospective consumer’s evaluation of all the benefits and all the costs of an offering and the perceived alternatives (Kotler and Keller, 2009). Sweeney and Sountar (2001), made four dimensions to describe perceived value. According to the dimension of values consists of four main aspects: (1) Emotional Value, which is utility that comes from feeling or affection / positive emotions arising from consuming the product. (2) Social Value, the utility gained from the ability of products to enhance the social self-concept of consumer. (3) Quality / Performance Value, the utility gained from the perception of the quality and performance expected from the product. (4) Price / Value of Money, the utility gained from the product from the reduction of the cost short-term and long-term cost.
5 Figure. 1 Theoretical framework
Source: Sweeney and Soutar (2001), Yang and Kim (2012), and Kim et al (2012) which is developed by the researcher
2.1.Relationship of Utilitarian Value and Hedonic Value toward the Perceived Value
To, Liao, and Lin (2007) has also conducted a study with a title Shopping Motivation on the Internet: A Study Based on Utilitarian and Hedonic Value. The results of this study showed that consumers of internet shopping have both utilitarian and hedonic shopping, unlike real stores or offline consumers. Consumers of internet shopping not only get the value of the product, but also the perceived value that is fun and enjoyment from the internet shopping. This means that internet shopping motivation, utilitarian and hedonic shopping value, play a role in internet shopping. These motivations, can affect the value of consumer perceived value.
Kim et al., (2012) in their study, Factors Influencing Internet Shopping Value and Customer Repurchase Intention. found that the values of utilitarian and hedonic influence on customer satisfaction and significantly increase the intention of repurchasing the product. It has been suggested that the values of utilitarian and hedonic can be used to determine online consumers behavior as an independent variable that affect the perceived value.
Other studies have been conducted to determine whether hedonic factors influence the level of customer a traditional Japanese style restaurant in the Mall Kelapa Gading Jakarta, which was conducted by Andres, Faculty of Economics, Unika Atma Jaya University in Jakarta, in 2012. In that study, the researcher used two independent variable Utilitarian and Hedonic, and one dependent variable customer satisfaction. The results obtained from this study is that utilitarian and hedonic values affect satisfaction. Hedonic value and utilitarian value has a positive and significant impact on visitor satisfaction of restaurants X.
Nugraha Fitra Andani (2015) analyzes the influence of utilitarian shopping value and hedonic shopping value on the intent-to-online repurchasing with the role of perceived value as a
Hedonic Value (X1) - Adventure Shopping - Social Shopping - Gratification Shopping - Value Shopping - Idea Shopping - Role Shopping
(Kim, 2012)
Utilitarian Value (X2) - Efficiency Shopping - Achievement Shopping
(Yang and Kim, 2012)
Perceived Value (Y) -Emotional Value -Social Value
-Quality/Performance Value -Price/Value of Money
(Sweeney and Soutar, 2001) H1
6
mediator. The result shows that the utilitarian shopping value and hedonic shopping value has positive influence on perceived value but did not have positive influence on intent to repurchase online. Moreover, perceived value has positive influence on repurchase intent to online fashion product by the students of the Faculty of Economics and Business, Diponegoro University. In this study the differences with previous studies are, object of research, year which is used for research, the results obtained, the variables used. Based on logical thinking of the relationship
between variables in this study, the a hypotheses are as follows:
1. H1 : hedonic value has positive and significant impact on perceived value. 2. H2 : utilitarian value has positive and significant impact on perceived value.
3. RESEARCH METHODOLOGY
This research is a quantitative study using survey methods in the process of collection data. The population in this study is the overall university student of University Muhammadiyah Surakarta, while the method of taking the sample using purposive sampling method with the criteria that the students who were chosen as respondents’ in this study are students who have purchased in an online store. Of the 250 questionnaires distributed, 220 questionnaires were considered valid for analysis, while 30 other questionnaires were not. The analytical method used is multiple linear regression method.
3.1. Variable of Research and Operational Definitions of Variable
Variable used in this study are, Independent Variables: Hedonic Value (X1), Utilitarian Value
(X2). Depedent Variable: Perceived Value (Y). The followings are the operational definitions of
variables:
Independent Variables: Utilitarian value
Definition of utilitarian value in this research refers to the concept of Holbrook and Hirschman (1982), is the choice of products efficiently, based on a rational reason. Measuring the utilitarian value refers to the opinion of Kim (2006), namely efficiency and achievement:
a. Efficiency can be interpreted as the needs of consumers in a savings of time and money. b. Achievement can be defined as the achievement of shopping destinations such as the
discovery of products that have been planned previously. Independent Variables: Hedonic value
7
which states that to measure the level of hedonic a consumer can be done from: adventure, social, gratification, idea, role, and value.
Dependent Variable: Perceived value
Perceived value is the difference between the prospective consumer’s evaluation of all the benefits and all the costs of an offering and the perceived alternatives (Kotler and Keller. 2009). It can be said that the perceived value based on the difference between what is spent and the value obtained by customers.
3.2. Data Instrument
The questionnaires employed use the Likert Scale, which submitted a list of written questions in a list of questions to respondents’. The list of questions given to respondents’ to the data collected by giving a score of each are as following, strongly disagree is scored 1, disagree is scored 2, neutral is scored 3, agree is scored 4, strongly agree is scored 5. The questionnaires used a close ended questions, which is a form of questions with alternative answers and respondents’ choose one of the alternative answers. Data collected includes:
1. Identity of the respondent (name, age, gender, subject of faculty, and phone number). 2. Data regarding to the response of respondents’ to variables influence purchasing decisions. The parameters of instruments used to examine the questionnaire are:
Validity Test
Validity test is used to measure whether the questionnaires is valid or not. A questionnaire is considered valid if the questions in the questionnaire are able to reveal what is measured by the questionnaire (Ghozali, 2011). In this study, to measure the validity of a test, bivariate Pearson
test is employed. This analysis by correlating each item score with the total score. The total score is the sum of the whole item. Items of questions which significantly correlated with the total score indicate that the items are able to provide support in revealing what they want to reveal. Reliability Test
Reliability of an instrumentis to measure the questionnaire which is the indicators of variables or constructs. A questionnaire is said to be reliable or trusted if the answers or the statement are consistent or stable over time (Ghozali, 2011). The formula for measuring the reliability is the formula of Cronbach's Alpha (α). A construct or a variable value is said to be reliable if the Cronbach's Alpha > 0.60 (Ghozalli, 2011).
3.3. Hypothesis Testing
8 t Test
t test aims to provide information if there is influence of utilitarian value and hedonic value partially to perceived value. Criteria for acceptance and rejection of the hypothesis if,
a. The regression coefficient is positive, it means that the independent variable has positive effect on the dependent variable, and conversely.
b. The significance value < α (5%), meaning that the independent variables have a significant effect on the dependent variable, and conversely.
F Test
F test is used to examined whether the model studied is able significantly explain the dependent variable (Janssens et. al 2008). F test aims to provide information if there is the influence of utilitarian value and hedonic value simultaneously on the perceived value or not. Criteria for acceptance and rejection of the hypothesis if, a) F is positive, meaning that simultaneously the independent variable has positive effect on the dependent variable, and conversely. b) The significance value < α (5%), meaning that the independent variables have a significant effect on the dependent variable, and conversely.
The coefficient of determination (R2)
the coefficient of determination measures the proportion of dependent variables that able to be explained by the independent variables studied (Gupta, 1999). The coefficient of determination also known R Square is commonly used to evaluate fit model. R square is 1 minus the ratio of residual variability. When the variability of the residual value around the regression line relative to the overall variability is small, the prediction of the regression equation is good.
4. RESULT AND DISCUSSION
4.1 Characteristics Analysis of Respondents’
Characteristics of respondents’ were analyzed in this study, including age, gender, and semester of the respondents’ described as follows:
4.1.1 Age
9
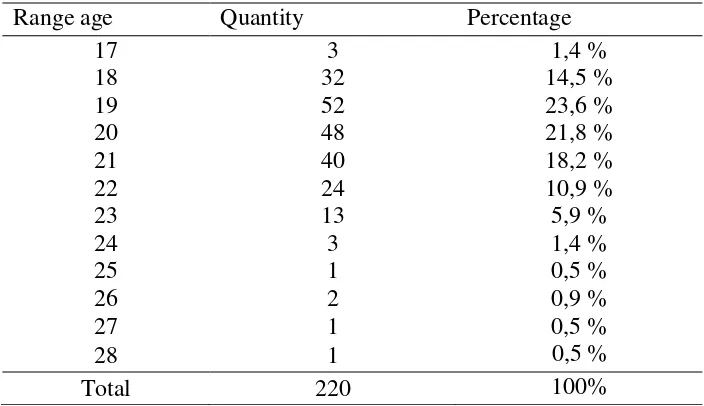
Table 2. Respondents’ Characteristic Based on Their Age
Range age Quantity Percentage
17 3 1,4 %
18 32 14,5 %
19 52 23,6 %
20 48 21,8 %
21 40 18,2 %
22 24 10,9 %
23 13 5,9 %
24 3 1,4 %
25 1 0,5 %
26 2 0,9 %
27 1 0,5 %
28 1 0,5 %
Total 220 100%
Based on the response of 220 respondents’ who shopped at online shop, 135 respondents’ (61.2%) aged between 17-20 years, 81 respondents’ (36.9%) aged between 21-25 years, four respondents’ (1.9%) aged > 26 years. It can be concluded that the vast majority of respondents’ in this study were respondents’ with ages between 17-20 years.
4.1.2. Gender
Characteristics of respondents’ by gender who have shopped in an online shop are shown in the following table:
Table 1. Respondent Characteristic Based on Gender
Gender Quantity Percentage (%)
Female 116 52,7 %
Male 104 47,3 %
Total 220 100 %
The table above shows that female respondents’ are more than male respondents’. Male respondents’ are 47.3 percent, while female respondents’ are 52.7 percent of the total sample. 4.1.3. Last Order
Table 4. Respondents’ Characteristic Based the time of Last Order By online shopping
Last order Quantity Percentage
< 1 month 99 45 %
< 3 month 54 24,5 %
< 6 month 35 15,9 %
< 1 year 32 14,5 %
10
From the table above, it can be seen that most respondents’ who purchase products through online shopping in the last 1 month amounted to 99 or 45% of the total of 220 respondents’. 4.1.4. Faculty
Table 3. Respondent Characteristic Based On Faculty
Faculty Quantity Percentage (%)
Teaching and Education 22 10 %
Economics and Business 52 23,6 %
Law 30 13,6 %
Engineering 36 16,4 %
Geography 23 10,5 %
Psychology 11 5 %
Religion of Islam 6 2,7 %
Health Sciences 26 11,8 %
Communication and Information 14 6,4 %
Total 220 100%
The table above describes the respondent's characteristic based on Faculty. From the table above we can see that the respondents’ were from 9 different Faculties. Teaching and Education (10%), Communication and Information (6.4%), Law (13.6%), Engineering (16.4%), Geography (10.5%), Psychology (5%), Religion of Islam (2.7%), Health Sciences (11.8%), and most respondents’ is from Economics and Business (23.6%).
4.2. Respondents’ Responses to The Questionnaire 4.2.1. Respondents’ responses to Hedonic Value
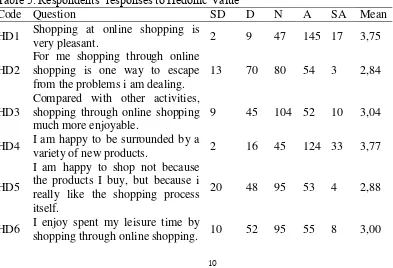
Based on respondents’ responses to Hedonic Value, there are 7 items discussed in to the questionnaire. The distribution of respondent’s response can be seen in table below.
Table 5. Respondents’ responses to Hedonic Value
Code Question SD D N A SA Mean
HD1 Shopping at online shopping is
very pleasant. 2 9 47 145 17 3,75
HD2
For me shopping through online shopping is one way to escape from the problems i am dealing.
13 70 80 54 3 2,84
HD3 Compared with other activities, shopping through online shopping much more enjoyable.
9 45 104 52 10 3,04
HD4 I am happy to be surrounded by a variety of new products. 2 16 45 124 33 3,77
HD5
I am happy to shop not because the products I buy, but because i really like the shopping process itself.
20 48 95 53 4 2,88
HD6 I enjoy spent my leisure time by
11 HD7 At the time of shopping through online shopping i feel as if i were
in an adventure.
11 40 94 66 9 3,10
The average of student/respondent responses of the overall hedonic variables is 3.2, which may mean that they are more likely tend to neutral or do not feel agree or disagree in the decision of the selection hedonic shopping behavior they do. From the indicators, the 4th indicator scored the highest average value of the all (3.77) , which means that students feel more inclined to new products.
4.2.2. Respondents’ Responses to Utilitarian Value
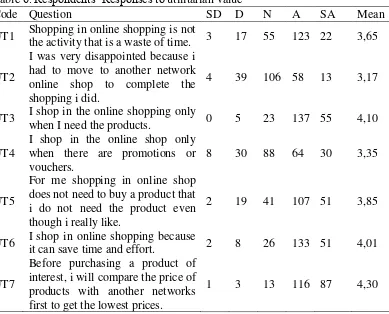
Based on respondents’ responses to utilitarian value, there are 7 items discussed in to the questionnaire. The distribution of respondents’ responses can be seen in table below.
Table 6. Respondents’ Responses to utilitarian value
Code Question SD D N A SA Mean
UT1 Shopping in online shopping is not the activity that is a waste of time. 3 17 55 123 22 3,65
UT2
I was very disappointed because i had to move to another network online shop to complete the shopping i did.
4 39 106 58 13 3,17
UT3 I shop in the online shopping only when I need the products. 0 5 23 137 55 4,10
UT4
I shop in the online shop only when there are promotions or
vouchers. 8 30 88 64 30 3,35
UT5
For me shopping in online shop does not need to buy a product that i do not need the product even though i really like.
2 19 41 107 51 3,85
UT6 I shop in online shopping because it can save time and effort. 2 8 26 133 51 4,01
UT7
Before purchasing a product of interest, i will compare the price of products with another networks first to get the lowest prices.
1 3 13 116 87 4,30
The average response utilitarian variable in this study was 3.77, which means that they agree on
the decisions to effective and efficient shopping behavior. Meanwhile, if viewed from the indicator represented by the statement given above, the seventh indicator scored the highest average value of all 4.30, on the other hand, it means that the students agree to buy products that are in demand through the online shopping, they chose to compare prices before making transactions.
4.2.3. Respondents’ Responses to Perceived Value
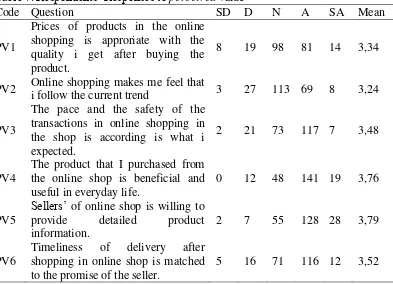
12 Table 7. Respondents’ Responses to perceived value
Code Question SD D N A SA Mean
PV1
Prices of products in the online shopping is approriate with the quality i get after buying the product.
8 19 98 81 14 3,34
PV2 Online shopping makes me feel that
i follow the current trend 3 27 113 69 8 3,24
PV3
The pace and the safety of the transactions in online shopping in the shop is according is what i expected.
2 21 73 117 7 3,48
PV4
The product that I purchased from the online shop is beneficial and useful in everyday life.
0 12 48 141 19 3,76
PV5 Sellers’
of online shop is willing to provide detailed product information.
2 7 55 128 28 3,79
PV6
Timeliness of delivery after shopping in online shop is matched to the promise of the seller.
5 16 71 116 12 3,52
The average responses to perceived value variable in this study was 3.5, which means that the respondents’ favour the benefits obtained. Meanwhile, if viewed from the indicator represented the statement given above, from 1 to 6 to a given indicator, the indicator perceived value to 5 received the highest average value of the indicator is the total score of 3,79. In other words, the respondents’think that the sellers’ online shop is willing to provide detailed product information for their product.
4.3. Results of Hypothesis Testing Table 8. Validity Test
No Statement Factor score
Hedonic Value 1 2 3
1. Shopping at online shopping is very pleasant. 0,572 2. For me shopping through online shopping is one way to escape from the problems I am dealing. 0,662
3. Compared with other activities, shopping through online shopping much more enjoyable. 0,727
4. I am happy to be surrounded by a variety of new
products. 0,551
5. I am happy to shop not because the products I buy, but because I really like the shopping process itself. 0,601
6. I enjoy spent my leisure time by shopping through
online shopping. 0,635
7. At the time of shopping through online shopping I feel as if i were in an adventure. 0,657 Utilitarian Value
13 a waste of time.
9.
I was very disappointed because I had to move to another network online shop to complete the
shopping I did. 0,545
10. I shop in the online shopping only when I need the
products. 0,561
11. I shop in the online shop only when there are promotions or vouchers. 0,522
12.
For me shopping in online shop does not need to buy a product that I do not need the product even though
I really like. 0,521
13. I shop in online shopping because it can save time
and effort. 0,587
14.
Before purchasing a product of interest, I will compare the price of products with another networks first to get the lowest prices.
0,562
Perceived value
15. Prices of products in the online shopping is approriate with the quality i get after buying the product.
0,741
16. Online shopping makes me feel that i follow the current trend 0,692
17. The pace and the safety of the transactions in online shopping in the shop is according is what i expected. 0,629
18. The product that I purchased from the online shop is beneficial and useful in everyday life. 0,659
19. Sellers’ of online shop is willing to provide detailed
product information. 0,630
20. Timeliness of delivery after shopping in online shop is matched to the promise of the seller. 0,636 Source: Data processed 2016
In this study to measure the validity is conducted by the bivariate Pearson test. This analysis by
means of correlating each item score with the total score. From the analysis is obtained the correlation value between scores of items with a total score. This value is then compare with the value of r table, r table sought at significance value of 0.05 with 2-sided test and the amount of data (n) = 220, then obtained r table of 0.138. Based on the analysis results is obtained the correlation values for whole items of instruments declared valid and can be used for research because of the value is above 0,138.
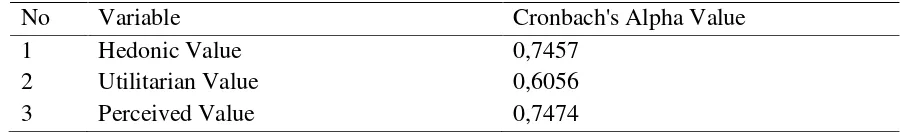
Table 9. Reliability Test
No Variable Cronbach's Alpha Value
1 Hedonic Value 0,7457
2 Utilitarian Value 0,6056
3 Perceived Value 0,7474
14
Reliability test is a test intended to measure a questionnaire, which is an indicator of variables or constructs. A questionnaire is said to be reliable or can be trusted if someone’s answers (responses) to the statement is consistent or stable over time (Ghozali, 2011). The formula for measuring the reliability is using the formula of Cronbach's Alpha (α). A construct or a variable value is said to be reliable if the Cronbach's Alpha > 0.60 (Ghazalli, 2006).
The result of questionnaire reliability test indicates the value of Cronbach's Alpha: Utilitarian value of 0.6056, Hedonic value of 0.7457 and Perceived value of 0.7474. Therefore, that means that each of variable is reliable or can be trusted since Cronbach's Alpha values is more than 0.60. Multiple linear regression analysis used in this study is aimed to determine whether there is influence of independent variables on the dependent variable or not. The statistical calculation in multiple linear regression analysis used in this research is conducted with SPSS for Windows version 22.0. Summary of the results of data processing using SPSS are as follows:
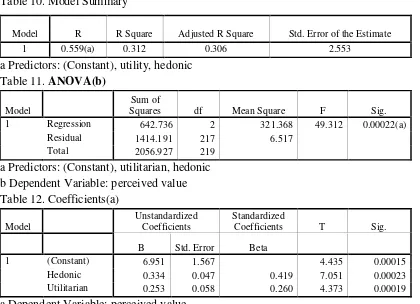
Table 10. Model Summary
Model R R Square Adjusted R Square Std. Error of the Estimate
1 0.559(a) 0.312 0.306 2.553
a Predictors: (Constant), utility, hedonic Table 11. ANOVA(b)
Model Squares Sum of df Mean Square F Sig.
1 Regression 642.736 2 321.368 49.312 0.00022(a)
Residual 1414.191 217 6.517
Total 2056.927 219
a Predictors: (Constant), utilitarian, hedonic b Dependent Variable: perceived value Table 12. Coefficients(a)
Model Unstandardized Coefficients Standardized Coefficients T Sig.
B Std. Error Beta
1 (Constant) 6.951 1.567 4.435 0.00015
Hedonic 0.334 0.047 0.419 7.051 0.00023
Utilitarian 0.253 0.058 0.260 4.373 0.00019
a Dependent Variable: perceived value
Multiple regression equation based on the results of regression analysis as follows: Y = 6,951+ 0,334X1 + 0,253X2 + e
15
The result of t test, (see table 12): hedonic value has a significance level of 0.00023. From the results of the t test of variable hedonic value, it is stated that the value of the t test of significance is smaller than 0.05 and the regression coefficient has a positive value of 0.334. Based on these results, the first hypothesis (H1), hedonic value has positive and significant effect on Perceived Value, can be accepted. While Utilitarian value has a significance level of 0.00019. From the results of the t test at variable utilitarian value, it is stated that the value of the t test of significance is smaller than 0.05 and the regression coefficient has a positive value of 0253. Based on the results, the second hypothesis (H2), utilitarian value has positive and significant impact on the perceived value, can be accepted.
From the results of F test (see table 11) F value of 49.312 is obtained and higher than F table 3,04 with a significance value of 0.00022. Because the value of F is positive and the significant value less than 0.05, utilitarian value, and hedonic value simultaneously has positive and significant impact on the perceived value.
The results of R-square test in this study is R2 = 0.312 (see table 10) which means that perceived value is partly (31.2%) influenced by utilitarian value and hedonic value, while the remaining 68.8% is influenced by other factors which were not included in this study.
4.4. DISCUSSION
Various factors that underlie a person in shopping for products online at the website include hedonic value and utilitarian value. this study seeked to determine the effect of the perceived value both partially and simultaneously.
1. Effect of Hedonic Value on Perceived Value
Hagel and Armstrong (1997) on stated that the development of a virtual community on the internet provides the greatest potential area in generating profits. This is due to the virtual community in facilitating the consumers to be able to build relationships, exchange information on a topic, as well as buying and selling products. Dimension of hedonic measure the affective experience (experimental affect) of an object. This is associated with the sensor or the senses, and experience with the product attributes (Batra, 1991). This dimension is the result or sensation obtained from the use of the product experience (Voss, 2003). The dimension of hedonic in online costumer experience is defined as the intrinsic value that customers get as a result of interaction within the community online. The value of hedonic product is subjective and personal, hedonic value can be obtained through the activity of shopping and bargaining (Babin, 1994).
16
and a regression coefficient has a positive value of 0.334. Based on these results the first hypothesis (H1) hedonic value has positive and significant impact on the perceived value, is accepted. the observed average value of overall respondents’ in hedonic variables is 3.2, or it can be interpreted that the students of University Muhammadiyah Surakarta opted neutral with respect to perceived value received if it is based on indicators hedonic value that corresponds to the student spending behavior when conducting online transactions shop.
Hedonic value is an important factor in Perceived Value in online shopping. Hedonic consumers look for website that provide not only the safety of transactions, privacy, interactive controls, and quick access to vast amounts of information, but also the intrinsic experience made by sensual stimulation, emotional value, and aesthetics, enhancing the pleasure of shopping online. Bridges and Florsheim (2008), Overby and Lee (2006), To et al., (2007) agreed that consumers with hedonic value feel delighted and excited from their shopping experience. Kim, Xu, and Gupta (2012), who on their research using the comfort and pleasure as indicator of research. Futhermore, Nugraha Fitra Andani (2015) concluded that hedonic value has positive and significant impact on perceived value.
2. Utilitarian Value has positive and significant impact toward the perceived value
According to Forsythe et al. (2006) convenience, ease of shopping, and product selection (which are utilitarian benefits) account for larger total variance explained in perceived benefits in online shopping, compared to the perceived hedonic benefit while shopping online. Hence, it can be inferred that an individual with higher shopping utilitarian motive is likely to perceive greater benefits in online shopping compared to another individual who has lower utilitarian shopping motives.
17 5. CLOSING AND IMPLICATION
In line with the purpose of this study, which is to determine the influence of hedonic value and utilitarian value on perceived value, with a case study of the students of the university of Muhammadiyah Surakarta, the researcher attempted to provide conclusions based on the results of data analysis has been conducted results and discussed previously. It can be concluded that there is influence between hedonic value and utilitarian value on the perceived value
Based on the results of data processing using SPSS 22 for Windows, hedonic value has positive and significant impact on perceived value. This is proven by the significant value of the t test which is less than 0.05 and the regression coefficient has a positive value of 0.334. Utilitarian value has positive and significant impact on perceived value. This is proven by the significant value of the t test which is less than 0.05 and the regression coefficient has a positive value of 0,253.
Utilitarian value and hedonic value simultaneously have positive and significant impact on perceived value. This is proven by the value of F of 49.312 with a significance value of 0.00022. Therefore, it can be said that hedonic value, as well as utilitarian has influence on perceived value. However, the large effects is not much different from the effects of hedonic value perceived by the students of the University of Muhammadiyah Surakarta at the time of shopping in the online shop. This finding implies that the variables discussed in this research have significant contribution in shaping perceived value. This can be even more significant in case of fashion products, as implied by previous studies (Childers, Carr, Peck, and Carson, 2001). Despite this, there are a number of factors that influence the decision making of e-commerce customers, as noted by andani (2015), who conducted that range of products offered, price, and detailed product information are also influential.
Voss et al (2003), that products or brands which value on a hedonic dimension is higher than utilitarian dimension has more influence on pricing or promotional sales. Furthermore, measurement of both dimensions can be taken into consideration on pricing and promotion decisions relating to the purchase. This is related due to the fact that hedonic dimension is able to make a product or a brand is remembered longer or long lasting and is often associated with segmentation criteria. Dimensional measurement of attitude is the basis for determining the market segment (Voss et al, 2003).
5.1. Implication
18
customer shopping behavior, seller can improve or create the effective marketing program for their customer (Lim and Dubinsky, 2004). For the management of online shop referring to the results of studies that has proven utilitarian value and hedonic value both partially and simultaneously have a positive and significant impact on the perceived value, hence the recommendation to be more sensitive to the values that exist in the consumer both utilitarian value and hedonic value which is expected by fulfilling these values. then the perceived value consumers who have purchased through online shop will be higher.
Given the R2 value of 0.312, which means that the influence of utilitarian value and hedonic value is partly on the perceived value is only of 31.2%, hence the recommendation for further research can reveal any factors, that may affect the level of perceived value which is still high at 68.8%.
ACKNOWLEDGEMENTS
My great gratitude to my supervisor Soepatini, Ph.D who gave me new knowledge and perspective to finish this project. Many thanks to my friend who supporting my final project, Huda K. Maulana, SE., without him it might be not accomplished.
REFERENCES
Andani, Fitra. (2015). “Analisis Pengaruh Utilitarian Shopping Value dan Hedonic Shopping Value terhadap Intent to Online Repurchase dengan Peran Perceived Value sebagai Mediator”. Diponegoro Journal of Management. Vol. 4 No. 2.
Andreas. (2012). “Kontribusi Faktor Hedonis terhadap Kepuasaan Konsumen untuk Mengembangkan Usaha yang Berkelanjutan”, Surabaya: E-Journal STIESIA.
Arnold, Mark J. and Kristy, E. Reynolds. (2003). “Hedonic Shopping Motivations." Journal of Retailing, Vol. 79, pp.77-95.
Babin, B. J., Darden, W. R., & Griffin, M. (1994). “Work and/or Fun: Measuring Hedonic and Utilitarian Shopping Value”. The Journal of Consumer Research, Vol. 20, No. 4, pp.
644-656.
Batra, R., & Ahtola, O. (1991). “Measuring the Hedonic and Utilitarian Sources of Consumer Attitudes”. Marketing Letters, pp.159-170.
Bridges, E. & Florsheim, R. (2008). “Hedonic and Utilitarian Shopping Goals: e Online Experience”. Journal of Business Research, Vol. 61, pp. 309–314.
Childers, T.L., Carr, C.L., Peck, J. and Carson, S. (2001). “Hedonic and Utilitarian Motivations for Online Retail Shopping Behavior,” Journal of Retailing, Vol. 77, No. 4, pp.511-535.
Chien-Lung Hsu, et.al. (2010). “Effect of Commitment and Trust Toward Micro-Blog on Consumer Behavioral Intention: A Relationship Marketing Perspective”. International Journal of Electronic Business Management. Vol. 18 No. 4. pp. 292-303.
19
Ferrand, A. & Vecchiatini, D. (2002). “The Effect of Service Performance and Ski Resort Image on Skiers Satisfaction”. European Journal of Sport Science.
Ghozali, Imam. 2011. Aplikasi Analisis Multivariate dengan Program SPSS. Semarang: BP
Universitas Diponegoro.
Gupta, Vijay. 1999. SPSS for Beginners. Tualatin: VJ Books.
Hagel, J. and Armstrong, A. 1997. Net Gain: Expanding Markets through Virtual Communities,
Harvard Business School Press, Cambridge.
Hellier, P.K., Geursen, G.M., Carr, R.A. and Rickard, J.A. (2003). “Customer Repurchase Intention: A General Structural Equation Model”. European Journal of Marketing,
37(11/12): 1762-800.
Hirschman, E. C., & Holbrook, M. B. (1982). “The Experiential Aspects of Consumption: Consumer Fantasies, Feelings, and Fun”. Journal of Consumer Research, pp. 132-140.
Janssens, Wim, et.al. 2008. Marketing Research: With SPSS. Essex: Pearson Education.
Jen, W. Hu, K. C. (2003). “Application of Perceived Value Model to Identify Factors Affecting Passengers’ Repurchase Intentions on City Bus: A Case of The Taipei Metropolitan Area”, Transportation, Vol. 30, pp. 307-327.
Kim, H.S.(2006). “Using Hedonic and Utilitarian Shopping Motivations to Profile Inner City Consumers”. Journal of Shopping Center Research, Vol. 13, No. 1, pp. 57-79.
Kim, H. W., Xu, Y., & Gupta, S. (2012). “Which is More Important in Internet Shopping, Perceived Price or Trust?”,Electronic Commerce Research & Applications, Vol. 11, No.
3, pp. 241-252.
Kim, S. (2006). “Using Hedonic and Utilitarian Shopping Motivations to Profile Inner City Consumers”. Journal of Shopping Centre Research, Vol. 13, No. 1, pp. 57-79.
Kotler, P., & Keller, K. L. 2009. Marketing Management. Upper Saddle River, N.J: Pearson
Prentice Hall.
Lignell, A. (2014), “Older Consumers’ Adoption of Online Shopping”. Master’s Thesis, Lappeenranta University of Technology, School of Business, International Marketing Management, Lappeenranta.
Lim, H. and Dubinsky, A.J. (2004). “Consumers’ Perceptions of E-Shopping Characteristics: An Expectancy-Value Approach”, The Journal of Services Marketing, Vol. 18, No. 6, pp.
500-513.
Liu, C. and Guo, Y. (2008). “Validating the End-User Computing Satisfaction Instrument for Online Shopping Systems”, Journal of Organizational and End User Computing, Vol.
20, No. 4, pp.74-96.
Ma’ruf, Hendri. 2006. Pemasaran Ritel. Jakarta: Gramedia Pustaka Utama.
Miyazaki, A.D. and Fernadez, A. (2001). “Consumer Perceptions of Privacy and Security Risks for Online Shopping.”The Journal of Consumer Affairs, Vol. 35, pp. 27-44.
Monroe, K.B. 1991. Pricing – Making Profitable Decisions, New York: McGraw-Hill.
Nielsen. (2010). “Global Trends in Online Shopping—A Nielsen Report. Retrieved from http://www.nielsen.com/us/en/insights/reports/2010/Global-Trends-in-Online-Shopping-Nielsen-Consumer-Report.html
Overby, J. W., & Lee, E. (2006). The Effects of Utilitarian and Hedonic Online Shopping Value on Consumer Preference and Intentions. Journal of Business Research, Vol. 59, No. 10,
20
Purbo, O. W dan Wahyudi, A. A., 2001. Mengenal e-Commerce, Jakarta: PT. Elex Media
Komputindo.
Sweeney, J. C. & Soutar, G.N. (2001). Consumer Perceived Value: The Development of a Multi-Ítem Scale. Journal of Retailing, Vol.57, No.3, pp. 49-67.
To, P.-L., Liao, C. & Lin, T.-H. (2007). “Shopping Motivations on Internet: A Study Based on Utilitarian and Hedonic Value”. Technovation, Vol. 27, pp. 774–787.
Voss, Kevin E., Eric R. Spangenberg, and Bianca Grohmann, (2003) “Measuring the Hedonic and Utilitarian Dimensions of Consumer Attitude,” Journal of Marketing Research, Vol.
40, pp. 310-320.
Why Indonesia,: http://www.internetretailingexpo-asia.com/why-indonesia (15 October 2016) Yulisman, L. (2012, May 11). “Indonesia Can Benefit from Taiwan’s Economy”, The Jakarta Post.
Zeithaml, A., A. Parasuraman, dan Leonard L. Berry,. (1988). SERVQUAL: A Multiple-Item Scale for Measuring Customer Perceptions of Service Quality, Journal of Retailing, Vol.