A Novel Method of Selecting Reusable Aged Glass Insulator
M. Abu Bakar Sidik, Hussein Ahmad, S. Shahnawaz Ahmed, Zulkurnain Abd. Malek, M. Irfan Jambak Faculty of Electrical Engineering
Universiti Teknologi Malaysia, 81310 UTM Skudai, Johor Bahru, Malaysia [email protected], [email protected]
Abstract – Since the electricity demand in Malaysia
tends to increase, improvements have to be made to strengthen the power system network. Generally in every new construction of power system new string of insulators especially for transmission line have to be installed. For the time being, the technology or method to recycle the used or aged glass insulators seems not to be interesting for many researchers. However, in fact not all the aged glass insulators are able to be reused. This work introduces a method to select aged glass insulators, available from dismantled lines, by segregating them based on their electrical defects.
Keywords: insulators, aged, glass, segregation
1. INTRODUCTION
Nowadays the rapidly growing population of Malaysia has increased the demand for electrical energy. The transmission of electricity from remote power stations to the centers of industrial activity, business, and the residential sites is accomplished by overhead lines. Therefore, to transmit greater amount of power over long distance, transmission lines with higher voltages have been built. Generally for upgrading a system a new tower design and insulators have to be used [1]. Electricity utilities in Malaysia are considering increase of the maximum trans-mission voltage from 275 kV to 500 kV. Not only that the 66 kV lines has been replaced by 132 kV lines. In Sabah SESB is planning to construct a new national grid running across Sabah and Sarawak in order to strengthen the power system networks there. These entire scenarios require new string of insulators to be installed in those systems. Due to the cost for insulators being significant enough, L.Jermendy et.al. [2] conducted a study to identify usable insulators by detecting aging at 50% impulse voltage flashover level.
In this paper a novel method to segregate and select reusable aged insulators for new application on the transmission line is introduced. The classification is conducted based on magnitudes of the ac and dc
leakage current, and the tangent δ. Along with the
leakage current measurement, a primary study on the corona inception was also conducted.
2. METHODOLOGY
Transmission line insulators aging is influenced by several factors i.e., mechanical defects and electrical defects [1]. The leakage current magnitude
on the surface of the insulator, and tangent δ are
associated with the electrical defects. The leakage current magnitude on the clean insulator relates to the degradation of the insulator surface. Also the tangent
δ relates to the dielectric loss/ power loss [3]. The
relationship can be represented by the following equation.
Λ = f( i, I, tan δ) (1) where,
Λ : grade point average (per unit)
i : ac leakage current
I : dc leakage current
tan ä : dielectric loss
2.1 Experimental set-up
The insulators were cleaned to remove all traces of dirt and grease [4]. After that the insulators were
dried out, and coveredin order to make it keep clean.
2.1.1 Leakage Current
For leakage current measurement the insulators were placed by turn in the Artificial Contamination and Climatic Chamber (A3C). In this chamber the ambient temperature and humidity could be observed and collected. For the leakage current measurement the voltage was injected from 0 up to 10 kV. A Data Acquisition System (DAS) has been developed to observe and collect all leakage current data including the flashover incident. Detailed discussion on A3C and DAS are presented in paper [5]. In parallel LeCroy LT344L Digital Storage Osciloscope (DSO) was used for comparison purpose. All verification shown very closed (> 97%) results between the corresponding two systems. Fig. 1 illustrates the general experimental setup used for the leakage current measurement and Fig. 2 shows the A3C at the Institut Voltan dan Arus Tinggi (IVAT i.e., Institute of High Voltage and Current) at UTM.
2.1.2 Corona Inception
A primary observation on the corona inception [6] was made. As receiver a simple balanced multi elements UHF antenna was connected through coaxial cable to the LeCroy LT334L DSO. The antenna was Second International Conference on Electrical and Computer Engineering
ICECE 2002, 26-28 December 2002, Dhaka, Bangladesh
mounted on the particular support and securely at safe distance from the object under test. The leakage current and the corona inception measurement were conducted simultaneously.
CHAMBER Protector
ADC
Digital Multimeter Instrument (DMI) Shunt
Resistor
Capacitive Divider H V INSULATOR UNDER TEST Antenna
Figure 1. General setup for the experiment
Figure 2. View of A3C at IVAT
2.1.3 Tangent δδ
In order to measure power loss in the dielectric a Capacitance and Dissipation/ Power Factor Test Set 2816/5284U BR YB together with the High Voltage Supply and Control 2816/5284U CU YB by Tettex Instrument was used. Fig. 3 shows the circuit.
U Test : High Voltage supply (e.g. high voltage transformer)
CN : Standard Capacitor
CX : Test object
E : Earth conncetion
G : Null detector
µP : Microcomputer
Figure 3: Basic test circuit for C and tangent δ measurement.
3. RESULTS AND DICUSSIONS
This study was conducted to the nine anti fog cap-pin glass insulators type M92. Its creepage distance is 330mm. The leakage current measurement
used resistor drop voltage (RDV) method. The
measurement results of leakage current, and tan ä
were regressed using linear regression method. Afterward eq. (2), (3), and (4) were obtained.
j k j k
j
m
V
b
i
( , )=
+
(2)j k j k
j
m
V
b
I
( , )=
+
(3)j k j k
j, )
=
m
V
+
b
(tan
δ
(4)where,
j : 1,2, …, 9 (insulator code)
k : 1,2, …, 10 (injection voltage)
Table 1 illustrates the results of the linear regression and its magnitude for the ac and dc leakage current, and the tangent ä for 10 kV injection voltage.
Table 1. The leakage current and tan ä magnitude
j i
(mA)
I
(ì A) tan ä
1 1.2909 0.1720 0.0797
2 5.8878 0.1746 0.0699
3 2.0834 0.1660 0.0508
4 1.6493 0.1685 0.0560
5 1.3573 0.1376 0.0564
6 0.9370 0.1447 0.0482
7 0.2637 0.1438 0.0420
8 0.5030 0.1726 0.0536
9 0.2456 0.1728 0.0641
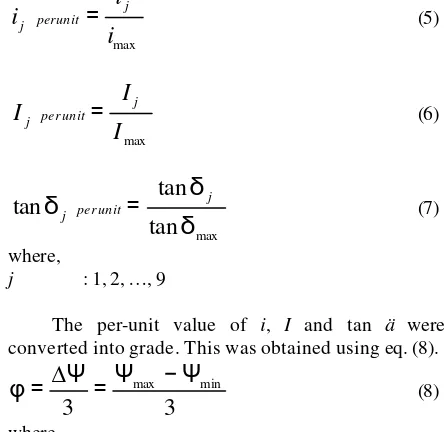
In order to simplify the classification, the actual value of i, I and tan ä were converted to per-unit using eq. (5), (6), and (7).
max
i
i
i
j perunit=
j (5)max
I
I
I
j perunit=
j (6)max
tan
tan
tan
δ
δ
δ
junit per
j
=
(7)where,
j : 1, 2, …, 9
The per-unit value of i, I and tan ä were
converted into grade. This was obtained using eq. (8).
3
3
min
max
−
Ψ
Ψ
=
∆Ψ
=
φ
(8)where,
φ
: the range of grademax
Ψ
:
the maximum value of i, I or tan ämin
Ψ
:
the minimum value of i, I or tan äIn this study the range of the grade was made as follows,
x < A < y y < B < z z < C < 1 where,
x = Ømin (9)
y = Ømin +
φ
(10)z = Ømin + 2
φ
(11)The grade value are A=3, B=2, and C=1.
It should be noted that higher the numerical values in Table 1, less will be the grade assigned in the order C, B, A.
Finally eq. (12) was applied to obtain the per-unit grade point average.
3 tanδ
+ + =
Λ i I (12)
Table 2. Grade of Tested Insulator Grade
j i I tan δ Λ
1 A C C 1.666
2 C C C 1.000
3 A C A 2.333
4 A C B 2.000
5 A A B 2.666
6 A A A 3.000
7 A A A 3.000
8 A C A 2.333
9 A C B 2.000
This result shows the insulator #6, and #7 have the highest magnitude, whereas the insulator #2 shows a contrary result. The segregation was made using three performance classifications, i.e.,
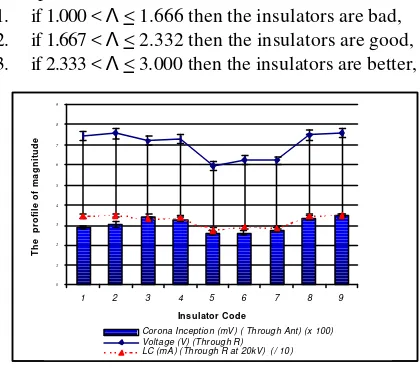
1. if 1.000 < Λ < 1.666 then the insulators are bad, 2. if 1.667 < Λ < 2.332 then the insulators are good, 3. if 2.333 < Λ < 3.000 then the insulators are better,
Figure 4. Graph of measurement results by using RDV method, antenna receiver and ac leakage
current.
For the preliminary study of corona inception, the measurement was only conducted on the injection of AC voltage. The comparison between two measurement results (by RDV method and by antenna receiver) are illustrated the Fig. 4. It is obvious that the profile of the measurement using RDV method is close to theprofile of thevoltage at antenna receiver.
4. CONCLUSIONS
A technique to segregate aged insulators was introduced in terms of electrical defects. The segregation is made based on the ac and dc leakage
current, and tan δ. This technique is effective for
determining quality of the aged glass insulators. Also the corona inception measurement has presented a satisfactory result. However improvements will be still considered. Based on this observation next study will be made to determine the correlation factor between the leakage current on the surface of insulator and the corona inception. This means developing a compact mock-up system measurement based on the electric radiation phenomena due to high voltage insulators.
5. ACKNOWLEDGEMENTS
The authors wish to thank the Director and staffs of Institut Voltan dan Arus Tinggi (IVAT) - UTM Skudai, for their help and assistance and providing facilities to carry out this work. Also the authors wish to thank the MOSTE (Ministry of Science Technology and The Environment) of Malaysia for providing the financial support for this project.
REFERENCES
[1] M. Abu Bakar Sidik, et.al., “On the Study of
Reusable Aged Glass Insulator,” MSTC2002,
September,19-21,2002, Johor Bahru, Malaysia. [2] L. Jermendy., I. Fogarasi., “Detection of
Insulator Ageing,” Power Tech Budapest 99,
1999, page(s): 128.
[3] T.J. Gallagher., A.J. Permain.,”High Voltage
Measurement, Testing and Design,” Jonh Wiley & Sons, Great Britain, 1983.
[4] IEC 507., “Artificial Contamination Tests on
High-Voltage Insulators to be Use on A.C. System,” 1991.
[5] M. Abu Bakar Sidik., et.al., “Development of an Artificial Contamination Chamber for Insulator
Performance Test,” MSTC2002, September,
19-21,2002, Johor Bahru, Malaysia.
[6] Stewart B.G., Hepburn D.M., Kemp I.J., Nesbit A, Watson J., “Detection and Characterisation of Partial Discharge Activity on Outdoor High Voltage Insulating Structures by RF Antenna Measurement Techniques,” High Voltage Engineering Symposium, Conference Publication No.467, IEE, 1999.
0 1 2 3 4 5 6 7 8 9
1 2 3 4 5 6 7 8 9
Insulator Code
The profile of magnitude
Corona Inception (mV) ( Through Ant) (x 100) Voltage (V) (Through R)
LC (mA) (Through R at 20kV) (/ 10)