Mg/Al HYDROTALCITE-LIKE SYNTHESIZED FROM BRINE WATER
FOR EOSIN YELLOW REMOVAL
Eddy Heraldy
1.*, Triyono
2, Karna Wijaya
2, and Sri Juari Santosa
2 1Department of Chemistry, Faculty of Mathematics and Natural Sciences, Sebelas Maret University Jl. Ir. A. Sutami 36A, Kentingan, Surakarta 57126, Indonesia
2
Department of Chemistry, Faculty of Mathematics and Natural Sciences, Universitas Gadjah Mada Sekip Utara, Yogyakarta 55281, Indonesia
Received February 4, 2011; Accepted May 31, 2011
ABSTRACT
Attempts to synthesis of Mg/Al HTlc using magnesium from several raw material resources are widely investigated. One of raw material would purpose as source of magnesium to synthesis of Mg/Al HTlc is brine water which is well known as the desalination process wastewater. Mg/Al HTlc are widely investigated for their potential applications in research and industrial processes as adsorbents, anionic exchange, catalysts and /or catalyst precursors for the preparation of inorganic materials and pharmaceutical industry excipients. As adsorbents, Mg/Al HTlc are receiving greater interests in the environmental community due to their high adsorption capacity. However, there is no literature available on the synthesis of Mg/Al HTlc from brine water except from artificial seawater. The objective of this research is to synthesis of Mg/Al HTlc from brine water and its ability tested for eosin yellow (EY) removal. Characterization of the Mg/Al HTlc synthesized was confirmed through X-ray Diffraction and FT-IR Spectroscopy. The effect of various experimental parameters was investigated using a batch adsorption technique. In this manner, the adsorption isotherms, adsorption kinetics, and pH effects upon EY adsorption on Mg/Al HTlc were examined. The result showed that EY data fit well with the pseudo-second order kinetic model. The isothermal data could be well described by the Freundlich equation. The adsorption capacity was 2.41 × 10⁻¹ mol g-1, and adsorption energy of EY was 24.89 kJ mol-1.
Keywords:Mg/Al hydrotalcite-like, brine water, adsorption, eosin yellow, adsorption capacity
INTRODUCTION
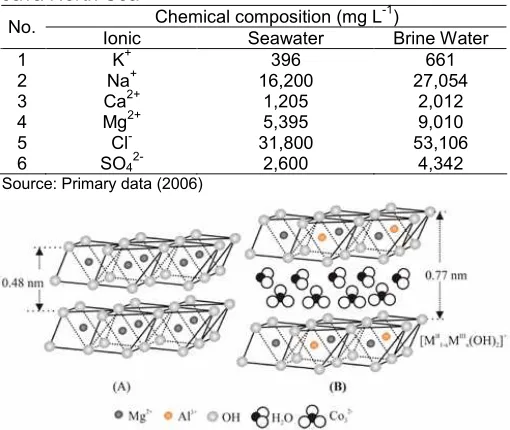
Brine water, also referred in the literature as concentrate or wastewater, is a by product of the desalination processes. In desalination processes generate huge amounts of brine water. However, brine water is not often utilized but is discharge to the sea. Brine water discharged is more concentrated than seawater. The chemical composition of brine water (Table 1) reflect feed seawater composition, desalination technology used, the chemicals used for pre and post treatment, and percent recovery [1]. In addition, layered double hydroxides (LDH), which are referred to as hydrotalcite-like compound (HTlc) or as anionic clays are an important class of lamellar compounds. The structure of HTlc consists of positively charged brucite-like host layers that are charge balanced by anions in the interlayer regions (Fig. 1). The brucite-like layers are charged due to isomorphous substitution of divalent cations with trivalent ones. The chemical composition of HTlc are expressed by the general formula [MII 1-xMIIIx(OH)2](An-)x/n.mH2O, where MIIis divalent cation like Mg2+, Zn2+, Cu2+, etc., MIIItrivalent cations like Al3+, Cr3+, Fe3+, etc., and An-is anion. Due to partial substitutions of
MIII for MII, the hydroxide sheets are positively charged and require intercalation of anions such as CO32-, Cl-or NO3- to remain overall charge neutrality. HTlc’s are widely investigated for their potential applications in research and industrial processes as an adsorbents, catalysts, catalyst precursors, anion exchangers and medicines [2-6]. HTlc are rare in nature, however, they can be easily synthesized by the co-precipitation method under laboratory conditions [7-10].
Table 1.Analysis result of seawater and brine water in Java North Sea
Chemical composition (mg L-1) No.
Fig 1. Schematic representative between crystal structure of brucite (A) and hydrotalcite (B) [28]
and electrochemical oxidations, coagulation and reverse osmosis are generally not feasible on a large scale due to economic consideration. Adsorption, however, is an effective method for dye removal. In recent years, numerous studies have been made by different researchers by using many low-cost natural materials such as zeolite, natural clay, materials produced from agricultural by-products and industrial solid wastes such as fly ash and coal, as dye adsorbents have attracted interests of environmental scientists [15-17]. Nevertheless, adsorption capacity is very low for these materials. Activated carbon is perhaps the most widely used adsorbent because of its high specific surface area, high adsorption capacity and low-selectively for both inorganic and organic pollutants. Although activated carbons have been most widely used as adsorbents in wastewater treatment processes [18-19], activated carbon adsorption is an expensive method due to its high price and the difficulties involved in its regeneration for reuse.
Until now, the adsorption behaviors of hydrotalcite have been studied by many researchers. As adsorbents, HTlc are receiving greater interests in the environmental community [20-23] due to their high anion retention capacity. However, a very few literature is available on the adsorption behavior of eosin yellow (an anionic dye) on HTlc’s in aqueous system. In the present study, HTlc synthesized from brine water has been used as an adsorbent for eosin yellow (EY) removal. The effects of various parameters on the removal of EY such as equilibrium time and pH of solution were studied in
detail. In addition, the adsorption isotherms and kinetics models have also been investigated.
EXPERIMENTAL SECTION
Materials
Natural brine water sample was taken from Tanjung Jati B, Jepara, Central Java, Indonesia Coal Fired Power Plant (CFPP). Magnesium chloride hexahydrate (MgCl2.6H2O); sodium chloride (NaCl); calcium chloride dihydrate (CaCl2.2H2O); potassium chloride (KCl); sodium carbonate (Na2CO3); sodium bicarbonate (NaHCO3), sodium hydroxide (NaOH); chloride acid (HCl) and aluminum chloride hexahydrate (AlCl3.6H2O) were used for synthesis of hydrotalcite in p.a. grade from Merck, Germany. The commercial HTlc was obtained from WAKO, Japan.
Instrumentation
Shimadzu Diffractometer XRD-6000 was used to hydrotalcite structure identification, Shimadzu FT-IR-820 IPC was used to functional group characterization in hydrotalcite, UV-vis spectrophotometer Hitachi 150-20 and Shimadzu AA 630-12 was used to analyze the brine water composition.
Procedure
Preparation, Synthesis and Characterization of Mg/Al HTlc
Preparation of Starting solution. To 100 mL brine water solution was added 138 mL a mixed of 0.001 M Na2CO3-0.002 M NaHCO3 solution, stirring for 1 h at 95 °C and then the solution was filtrated.
Synthesis of Mg/Al HTlc. A co-precipitation method following Kameda [8] with some modifications was used to synthesis Mg/Al HTlc. Briefly, amount of 0.1 M Na2CO3 solution was added slowly to starting solution containing AlCl3.6H2O, with an initial Mg/Al molar ratio of 2.0 until pH 10.5 and then the solution was stirred for 1 h at 70 °C. The product was centrifuged to recover the white solid at a speed of 2000 rpm for 20 min. The wet cake was washed with aquabidest until free of ion Chloride (AgNO3test) and dried overnight with oven.
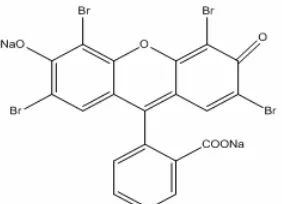
Fig 2.Chemical structure of eosin yellow dye [29]
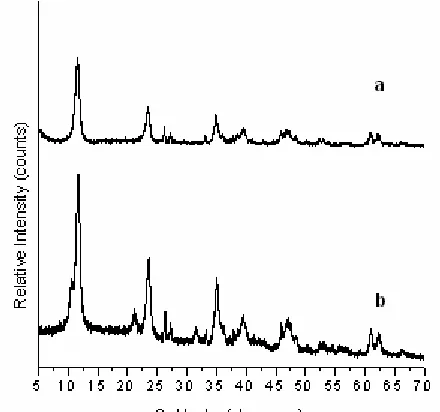
Fig 3.XRD patterns of Mg/Al HTlc (a) synthesis and (b) commercial
Stability test of Mg/Al HTlc
Fifty milligrams of Mg/Al HTlc was added to a series of 50 mL of aquabidest and the acidity was then adjusted to pH 3, 5, 7, 9, 11 and 13 by using either HCl or NaOH solution. The mixture was stirred for 2 h. After separating supernatant from the solid, the remaining Mg/Al HTlc was dried by mean of heating in oven at 105 °C. The stability of Mg/Al HTlc was calculated based on the weight ratio of the remaining Mg/Al HTlc relative to its initial weight.
Adsorption of EY
Effect of medium acidity.As conducted on the stability test of Mg/Al HTlc, a series of 50 mL of 5 mg L-1 EY solutions was prepared and their acidity was adjusted to pH 3, 4, 6, 8, 10, 12 and 13 by using either HCl or NaOH solution. Into every EY solution, 50 mg of Mg/Al HTlc was poured and then stirred for 2 h. After filtering through 0.45 m membrane filter, the concentration of EY in the supernatants was analyzed by using UV-vis spectrophotometer at wavelength 512 nm. Sample and blank solutions were analyzed under the same condition. The amount of EY sorbed was determined from the difference between the initial and remaining amounts of EY in the reacting solution each time the sample was analyzed.
Preparation of EY solution. Eosin yellow used as received without further purification. The chemical
structure of EY is shown in Fig. 2. EY solutions were prepared by dissolving EY in aquabidest.
Adsorption rate.Experiments for the determination of adsorption rate were carried out using a batch-type reactor of a 50 mL Erlenmeyer in a water bath at 25 °C. The initial volume and EY concentration were 50 mL and 5 mg L-1, respectively. To each solution, 50 mg of Mg/Al HTlc was added; the medium acidity was adjusted to pH 4.0, and stirred continuously. At selected time periods, a sample is immediately filtered through 0.45 m membrane filter. In every selected time period, the concentration of the remaining EY in the supernatant was analyzed by using UV-vis spectrometer at wavelength 512 nm. Sample and blank solutions were analyzed under the same conditions. The amount of EY sorbed was calculated by the difference between the initial and remaining of EY in the reacting solution.
Capacity and energy of adsorption. Experiments for the determination of capacity and energy of adsorption were also carried out using a batch-type reactor of a 50 mL Erlenmeyer in a water bath at 25 °C. The initial volumes of the EY solutions were 50 mL, and the concentration of EY in the solutions were varied from 0 to 30 mg L-1. Into each EY solution, 50 mg of Mg/Al HTlc was added and followed by continuous stirring for 2 h. After stirring, the solutions were immediately filtered through 0.45 m membrane filter. The concentration of EY remaining in the supernatant was analyzed by using UV-vis spectrometer at wavelength 512 nm. Sample and blank solutions were analyzed under the same conditions. The amount of EY absorbed was calculated by the difference between the initial and the remaining of EY in the reacting solution.
Confirmation of adsorption.The adsorption of EY on Mg/Al HTlc can be qualitatively confirmed by comparing the FT-IR spectra of Mg/Al HTlc after adsorbing EY as well as by measuring the basal spacing of the Mg/Al HTlc before and after the adsorption using XRD.
RESULT AND DISCUSSION
Synthesis and Characterization of Mg/Al HTlc
Fig 4.FT-IR spectra of Mg/Al HTlc (a) synthesis and (b) commercial
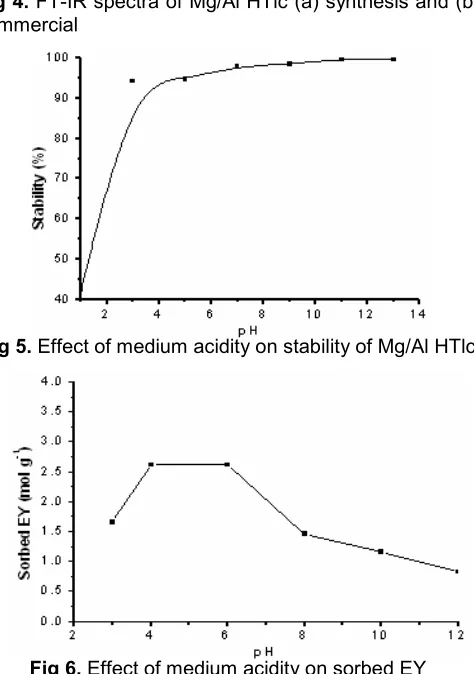
Fig 5.Effect of medium acidity on stability of Mg/Al HTlc
Fig 6.Effect of medium acidity on sorbed EY
It was thought that CO32- was intercalated into the precipitated HTlc since (003), (006) reflection of HTlc intercalated CO3
2-are around 7.583 and 3.802 Å, respectively. According to Xu and Lu, the value of 7.583 and 3.802 Å are very close to that of carbonate-bearing hydrotalcite [25].
FT-IR spectra of the HTlc samples are shown in Fig. 4. The broad peak around 3448 cm-1 can be ascribed to the stretching of OH groups attached to Al and Mg in the layers. The bending vibration of interlayer water is found at 1496 cm-1. The antisymmetric vibration
of CO32- appears at 1350 cm-1. The peak below 1000 cm-1is attributed to lattice vibration of Mg-O, Al-O and Mg-O-Al.
Stability test of Mg/Al HTlc
Stability of Mg/Al HTlc toward dissolution increases sharply from pH 1 to pH 3 (Fig. 5). At pH 1, the remaining Mg/Al HTlc in the solution was only 42.32% and this remaining Mg/Al HTlc in the solution increased to 94.21% at pH 3. At lower medium acidities (3 < pH ≤13), the remaining Mg/Al HTlc was relatively constant at value 98.00%.
At high medium acidity (low pH), the hydroxide groups in the Mg/Al HTlc are protonated, their bonds to Mg and /or Al are broken and therefore the dissolution of metal cations is occurred. The portion of protonated hydroxide group decreases significantly at pH 3 and becomes insignificant at pH > 3.
Adsorption of EY
Effect of medium acidity
The Adsorption of EY on Mg/Al HTlc tends to increase with increasing medium acidity from pH 3 to 4; plateu at pH 4-6 and then falls rapidly from pH 6 to 13 (Fig. 6). Since the EY have pKa1 = 3.7 and pKa2 = 3.4 [26], with the increasing pH from 3 to 4, more EY species are suspected negatively charged and hence the adsorption of EY on the positively charged Mg/Al HTlc is enhanced. At pH > 6, however, the negatively charged EY must compete with the excess of hydroxide ion in the solution in occupying the active sites of the Mg/Al HTlc. This is why that the adsorption falls at pH higher than 6.
Rate of adsorption
Adsorption kinetics, indicating the adsorption rate, is an important characteristic of sorbents. The adsorption profile of 5 mg L-1 EY concentration as a function of interaction time is presented in Fig. 7A. The adsorption is initially rapid and then goes slower. The initial rapid adsorption was observed for the first 3 min and the adsorption still increased even at the adsorption time more than 100 min.
Two models mentioned in the literature to describe the adsorption kinetics curves were considered [27]. The adsorption data matches well with the kinetic model of pseudo-second order as mathematically expressed in the following equation:
2 2
1 1
t e e
t
t
q k q q
Fig 7. Adsorption profile of EY on Mg/Al HTlc as a function of interaction time (A) and plot oft/qtagainsttin the kinetic model of pseudo-second order adsorption (B)
Fig 8. Adsorption profile of EY on Mg/Al HTlc as a function of the remaining EY concentration at equilibrium (C) (A) and the relationship betweenCand C/min the Langmuir isotherm model (B)
Table 2.Adsorption capacity (b), energy (E), and affinity (K) were obtained fromLangmuir isothermand adsorption capacity (B) was obtained fromFreundlich isothermin EY adsorption on Mg/Al HTlc
Adsorption parameters
Langmuir Freundlich
Sorbent
b (10-5mol g-1)
K (mol L-1)-1
E* (kJ mol-1)
R2 B
(10-1mol g-1)
n R2
Mg/Al HTlc 1.06 19561 24.89 0.912 2.41 1.2 0.994
*E = RT ln K
Plot of t/qt against t resulted in linear relationship with linearity (R2) as high as 0.975 (Fig.7B). Based on the slope of the plot, the obtained adsorption rate constant (k2) was 3.37 × 10⁵g mol-1min-1.
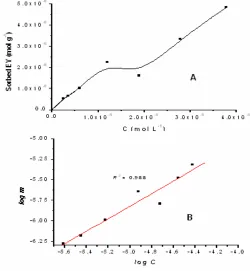
Adsorption isotherm studies
EY adsorption isotherm data at 5 mg L-1 were investigated to fit the models of Langmuir and Freundlich. These data were obtained by EY concentration measurement after adsorbent/adsorbate contact periods equal to the equilibrium times.
The well-known expression of the Langmuir model is:
. .
1 .
b K C m
K C
or
1 .
C C
m bK b (1)
where C is the EY concentration in the solution after adsorption reaches equilibrium,mis mol of EY absorbed on 1 g Mg/Al HTlc,K the equilibrium constant, and b is
the maximum amount of EY absorbed on Mg/Al HTlc (adsorption capacity). By plotting C/m against C, the values ofbcan be obtained from the 1/slope.
On the other hand, the Freundlich equation is:
logm= logB+ 1/nlogC (2)
where C is the EY concentration in the solution after adsorption reaches equilibrium,m is mol of EY sorbed on 1 g Mg/Al HTlc, n is Freundlich constant, and B is Freundlich adsorption capacity (mol g-1). By plotting log m against log C, the values of n and B can be obtained.
Fig 9.XRD patterns of Mg/Al HTlc a) before adsorption and b) after adsorption
Fig 10. FT-IR Spectra of Mg/Al HTlc a) before adsorption and b) after adsorption
is indicative of the heterogeneity of the adsorption sites on Mg/Al HTlc particles.
From plot of log C against log m, the obtained value of B for the adsorption of EY on Mg/Al HTlc was 2.41 × 10⁻¹ mol g-1. The linearity (R2) of the plot was 0.994 (Fig. 8B). Meanwhile, after obtaining b from Langmuir isotherm, the value of K is then able to be determined from the intercept of plot of C/m against C. The calculation yieldsKvalue was 1.95 × 10⁴(mol L-1)-1. According to the equation Es = -ΔGs = RT ln K, the
adsorption energy (Es) is then obtained as high as 24.89 kJ mol-1.
Confirmation of adsorption
X-ray diffraction pattern of Mg/Al HTlc showed the presence of two main peaks at 2θof 11.59 and 23.45° with a basal spacing of 7.583 and 3.802 Å (Fig. 9 a). After adsorbing EY, all those two peaks were varied higher than those before the adsorption. Moreover, the 2θ of the main peaks after adsorption of EY slightly shifted to 11.78 and 23.58°, respectively (Fig. 9 b), and therefore the basal spacing slightly expanded to 7.586 Å. The presence of small expansion after the adsorption may indicate that simple adsorption process is occurred.
Meanwhile, EY adsorption on Mg/Al HTlc is confirmed in the IR spectra showed in Fig. 10. From Fig. 10 shows that the pattern of the FT-IR spectra before and after absorption showed a fairly clear distinction. Change in IR absorption bands mainly occur at wave numbers around 1650–1500 cm-1which is a bridge-water carbonate bond (CO3-H2O), 1400–1350 cm-1and 880–800 cm-1are associated with carbonate. In addition, changes in IR absorption bands at lower wave numbers 1000 cm-1is attributed to lattice vibration of Mg-O, Al-O and Mg-O-Al, which is similar on the surface of brucite (Mg-OH or Al-OH).
CONCLUSION
It was confirmed that Mg/Al HTlc synthesized from brine water was able to be use as sorbent for EY in solution. As prepared the other HT or HTlc, this sample exhibit the (003), (006) reflection around
7.58Ǻ, 3.80Å, respectively. The adsorption of EY was
predicted to occur mainly on the outer surface through pseudo-second order adsorption reaching equilibrium with relatively high adsorption rate constant, i.e. 3.37 × 10⁵ (mol L-1)-1. Adsorption isotherm was well described by the Freundlich model.
ACKNOWLEDGEMENT
We thank to the Higher Education Directorate for Research Grants and Universitas Gadjah Mada, Yogyakarta for providing the research facilities, and to Novi Bayu Alnavis, Rustina and Esti Sri Hardianti were contributed to support this research.
REFERENCES
1. Mohamed, A.M.O., Maraqa, M., and Al Handhaly, J., 2005,Desalination, 182, 1-3, 411–433.
3. de Roy, A., Forano, C., El Malki, K. and Besse, J.P., 1992,In Synthesis of Microporous Materials, Occelli, L., Robson, H., Eds., Vol. 2, Van Nostrand Reinhold, New York.
4. Newman, S.P., and Jones, W., 1998,New J. Chem., 22, 105–115.
5. Vaccari, A., 1998,Catal. Today,41, 53–71. 6. Vaccari, A., 1999,Appl. Clay Sci., 14, 161–198. 7. Reichle, W.T., 1986, Solid State Ionics, 22, 135–
141.
8. Kameda, T., Yoshioka, T., Uchida, M., and Okuwaki, A., 2000,Mol. Cryst. Liq. Cryst., 341, 407–412. 9. Heraldy, E., Triyono, Santosa, S.J., Wijaya, K.,
Prasasti, D., Savitri, G., Hermawan, D., Iwa, R., and Suryo, E.H., 2009, Hydrotalcite-like Synthesis using Magnesium from Brine Water, Proceeding of 2009 International Conference on Chemical, Biological and Environmental Engineering (CBEE), ISBN 13 978-981-4293-46-4 dan ISBN 10 981-4293-46-6, World Scientific Publishing Co. Pte. Ltd., Singapore. 10. Heraldy, E., Triyono, Santosa, S.J., Wijaya, K.,
Alnavis, N.B., Rustina, and Hardianti, E.S., 2010, Preliminary studies on hydrotalcite-like synthesis using magnesium from desalination waste, Proceeding of Pure and Applied Chemistry International Conference (PACCON 2010), ISBN 978-974-523-230-3, Ubon Ratchathani, Thailand. 11. Ni, Z.M., Xia, S.J., Wang, L.G., Xing, F.F., and Pan,
G.X., 2007,J. Colloid Interface Sci., 316, 284–291. 12. Tsai, W.T., Chang, C.Y., Lin, M.C., Chien, S.F., Sun,
H.F., and Hsieh, M.F., 2001,Chemosphere, 45, 51– 58.
13. O’Neill, C., Hawkes, F.R., Hawkes, D.L., Lourenco, N.D., Pinheiro, H.M., and Delee, W., 1999,J. Chem. Technol. Biotechnol., 74, 1009–1018.
14. Zhu, M.X., Li, Y.P., Xie, M., and Xin, H.Z., 2005,J. Hazard. Mater. B, 120, 163–171.
15. Meshko, V., Markovska, L., Mincheva, M., and Rodrigues, A.E., 2001,Water Res., 35, 3357–3366.
16. Janos, P., Buchtova, H., and Ryznarova, M., 2003, Water Res., 37, 4938–4944.
17. Wang, C.C., Juang, L.C., Hsu, T.C., Lee, C.K., Lee, J.F., and Huang, F.C., 2004, J. Colloid Interface Sci., 273, 80–86.
18. Faria, P.C.C., Orfao, J.J.M., and Pereira, M.F.R., 2004,Water Res., 38, 2043–2052.
19. Nakagawa, K., Namba, A., Mukai, S.R., Tamon, H., Ariyadejwanich, P., and Tanthapanichakoon, W., 2004,Water Res., 38, 1791–1798.
20. Goswamee, R.L., Sengupta, P., Bhattacharyya, K.G., and Dutta, D.K., 1998, Appl. Clay Sci., 13, 21–34.
21. Crepaldi, E.L., Tronto, J., Cardoso, L.P., and Valim, J.B., 2002,Colloids Surf., A, 211, 103–114.
22. Tezuka, S., Chitrakar, R., Sonoda, A., Ooi, K., and Tomida, T., 2004,Green Chem., 6, 104–109. 23. Hu, Q., Xu, Z., Qiao, S., Haghseresht, F., Wilson,
M., and Lu, G.Q., 2007, J. Colloid Interface Sci., 308, 191–199.
24. Ulibarri, M.A., Pavlovic, I., Barriga, C., Hermosin, M.C., and Cornejo, J., 2001, Appl. Clay Sci., 18, 17–27.
25. Xu, Z.P., and Lu, G.Q., 2005,Chem. Mater., 17, 5, 1055–1062.
26. Sabnis, R.W., 2010, Handbook of Biological Dyes and Stains: Synthesis and Industrial Applications, A John Wiley & Sons, Inc., Hoboken, New Jersey. 27. Ho, Y.S., and McKay, G., 1998,Chem. Eng. J., 70,
115–124.
28. Costa, F.R., Leuteritz, A., Wagenknecht, U., Jehnichen, D., Haubler, L. and Heinrich, G., 2007, Appl. Clay Sci., 38, 153–164.