9
SYNTHESIS OF Mg/Al HYDROTALCITE-LIKE FROM BRINE WATER
AND ITS APPLICATION FOR METHYL ORANGE REMOVAL:
A PRELIMINARY STUDY
Eddy Heraldy
1*), Triyono
2, Sri Juari Santosa
2, and Karna Wijaya
21. Department of Chemistry, Faculty of Mathematics and Natural Sciences, Sebelas Maret University, Kentingan, Surakarta 57126, Indonesia
2. Department of Chemistry, Faculty of Mathematics and Natural Sciences, Gadjah Mada University, Sekip Utara, Yogyakarta 55281, Indonesia
*)
E-mail: [email protected]
Abstract
The objective of this research is to synthesis of Mg/Al hydrotalcite-like (Mg/Al HTlc) from brine water and its application as a methyl orange (MO) removal. The research initiated with the synthesis of Mg/Al HTlc from brine water, which is well known as the desalination process wastewater. Characterization of the Mg/Al HTlc synthesized was confirmed through X-ray Diffraction and FT-IR Spectroscopy. The determination of optimum acidity, adsorption rate, and energy and capacity adsorption were studied. The result showed that pH 4 was the optimum acidity for the adsorption of MO on Mg/Al HTlc. MO was adsorbed at pseudo-second order adsorption rate of 1.03 × 10⁵ g mol-1 min-1 on the Mg/Al HTlc. The adsorption data fitted well into the linearly transformed Freundlich equation.
Keywords: adsorption, brine water, methyl orange, Mg/Al hydrotalcite-like
1. Introduction
Hydrotalcite-like compound (HTlc) also called layered double hydroxides (LDHs) or anionic clays, consist of brucite-like hydroxide sheets. The chemical composition of an HTlc can be described by the general formula [MII1-xMIIIx(OH)2](An-)x/n.mH2O, where MII is divalent
cationic like Mg2+, Zn2+, Cu2+, etc., MIII is trivalent cationic like Al3+, Cr3+, Fe3+, etc., and An- is anion [1-3]. Hydrotalcite have a great variety of uses in many applications as an adsorbent, anionic exchange, catalyst, photocatalyst, precursor for preparation of inorganic materials and medicines [4-8]. There have been numerous studies on synthesis and adsorption capacity of Mg/Al HTlc and several studies on their use for the preservation of water environment [9-12]. Previous research has shown that HTlc can remove some organic anionic pollutants [13-14]. Color removal from dye effluents is one of several major environmental concerns. Traditionally, biological, physical and chemical methods have been applied for dye removal [15]. However, many dyes are poorly biodegradable or recalcitrant to environmental conditions due to their complex structure and xenobiotic properties. Furthermore, many dyes are toxic to some microorganism and may cause direct destruction or inhibition of their catalytic capabilities
[16]. Chemical and electrochemical oxidations, coagulation and reverse osmosis are generally not feasible on a large scale due to economic consideration. Adsorption, however, is an effective method for dye removal. Activated carbon is perhaps the most widely used adsorbent because of its high specific surface area, high adsorption capacity and low-selectively for both inorganic and organic pollutants [17]. However, activated carbon is an expensive method due to its high price and the difficulties involved in its regeneration for re-use. In recent years, many low-cost natural materials such as natural clay, materials produced from agricultural by-products and industrial solid wastes such as fly ash and coal, as dye adsorbents have attracted interests of environmental scientists [18-21]. However, these materials generally have low adsorption capacities and hence, large adsorbent dosage is required to achieve a low dye concentration of the effluents.
In the present study, the removal of MO on Mg/Al HTlc synthesized from brine water was investigated. The performance of the Mg/Al HTlc was evaluated in term of its capacity and rate of adsorption for dissolved MO. Adsorption capacity is determined using the Langmuir isotherm model, while adsorption rate is calculated using a kinetics model.
2. Methods
Materials. Materials consists of sodium carbonate
(Na2CO3); sodium bicarbonate (NaHCO3), sodium
hydroxide (NaOH); chloride acid (HCl) and aluminum
chloride hexahydrate (AlCl3.6H2O) were used for
preparation of starting solution as well as the synthesis of Mg/Al HTlc without further purified. The natural brine water sample was taken from Tanjung Jati B, Jepara, Central Java, Indonesia Coal Fired Power Plant (CFPP). The commercial HTlc was obtained from WAKO, Japan. The redistilled water was used during the synthesis. MO provided by the Merck and used as received without further purification. MO solutions were prepared by dissolving MO in aquabidest.
Instrumentations. Instrumentations used include Shimadzu Diffractometer XRD-6000, Shimadzu FT-IR-820 IPC, UV-vis spectrophotometer Hitachi 150-20 and Shimadzu AA 630-12.
Preparation of starting solution procedure. To 100 mL brine water solution was added 138 mL of a mixed of 0.001 M Na2CO3-0.002 M NaHCO3 solution, stirring
for 1 h at 95⁰C and then the solution was filtrated.
Synthesis and characterization of Mg/Al HTlc procedure. A co-precipitation method following Kameda [9] with some modifications was used to synthesis Mg/Al HTlc. Briefly, amount of as prepared 0.1 M Na2CO3 solution was added slowly to starting
solution containing AlCl3.6H2O, with an initial Mg/Al
molar ratio of 2.0 until pH 10.5 and then the solution was stirred for 1 h at 70⁰C. The product was centrifuged to recover the white solid at a speed of 2000 rpm for 20 min. The wet cake was washed with aquabidest until free of ion Chloride (AgNO3 test) and dried overnight
with oven.
Powder X-ray diffraction (PXRD) patterns of the sample were acquired with a Shimadzu Diffractometer XRD-6000. Fourier transform Infrared Spectroscopy (FT-IR) spectra were recorded using a Shimadzu FT-IR-820 IPC. The Mg/Al ratio was determined using a Perkin Elmer 3110 AAS. In addition, commercial hydrotalcite characterized used as comparison.
Stability test of Mg/Al HTlc procedure. Fifty milligrams of Mg/Al HTlc was added to a series of 50 mL of aquabidest and the acidity was then adjusted to
pH 3, 5, 7, 9, 11, and 13 by using either HCl or NaOH solution. The mixture was stirred for 2 h. After separating supernatant from the solid, the remaining Mg/Al HTlc was dried by mean of heating in oven at
105 ⁰C. The stability of Mg/Al HTlc was calculated
based on the weight ratio of the remaining Mg/Al HTlc relative to its initial weight.
Effect of medium acidity on MO adsorption procedure. As conducted on the stability test of Mg/Al HTlc, a series of 50 mL of 5 mg L-1 MO solutions was prepared and their acidity was adjusted to pH 3, 4, 6, 8, 10, 12, and 13 by using either HCl or NaOH solution. Into every MO solution, 50 mg of Mg/Al HTlc was poured and then stirred for 2 h. After filtering through 0.45-μm membrane filter, the concentration of MO in the supernatants were analyzed by using UV-vis spectrophotometer. Sample and blank solutions were analyzed under the same condition. The amount of MO sorbed was determined from the difference between the initial and remaining amounts of MO in the reacting solution each time the sample was analyzed.
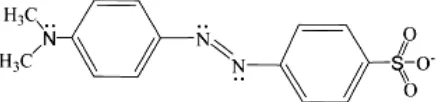
Preparation of MO solution. Methyl orange used as received without further purification. The chemical structure of MO is shown in Fig. 1. MO solutions was prepared by dissolving MO in aquabidest.
Adsorption rate procedure. Experiments for the determination of adsorption rate were carried out using a batch-type reactor of a 50 mL Erlenmeyer in a water bath at 25 ⁰C. The initial volume and MO concentration
were 50 mL and 5 mg L-1, respectively. To each
solution, 50 mg of Mg/Al HTlc was added, the medium acidity was adjusted to pH 4.0, and stirred continuously. At selected time periods, a sample is immediately filtered through 0.45-μm membrane filter.
In every selected time period, the concentration of the remaining MO in the supernatant was analyzed by using UV-vis spectrometer. Sample and blank solutions were analyzed under the same conditions. The amount of MO sorbed was calculated by the difference between the initial and remaining of MO in the reacting solution.
Capacity and energy of MO adsorption procedure. Experiments for the determination of capacity and energy of adsorption were also carried out using a
Figure 1. The Basic Form of the MO Molecule in
batch-type reactor of a 50 mL Erlenmeyer in a water bath at 25 ⁰C. The initial volumes of the MO solutions were 50 mL, and the concentration of MO in the solutions were varied from 0 to 30 mg L-1. Into each MO solution, 50 mg of Mg/Al HTlc was added and followed by continuous stirring for 2 h. After stirring, the solutions were immediately filtered through 0.45-μm membrane filter.
The concentration of MO remaining in the supernatant was analyzed by using UV-vis spectrometer. Sample and blank solutions were analyzed under the same conditions. The amount of MO adsorbed was calculated by the difference between the initial and the remaining of MO in the reacting solution.
3. Results and Discussion
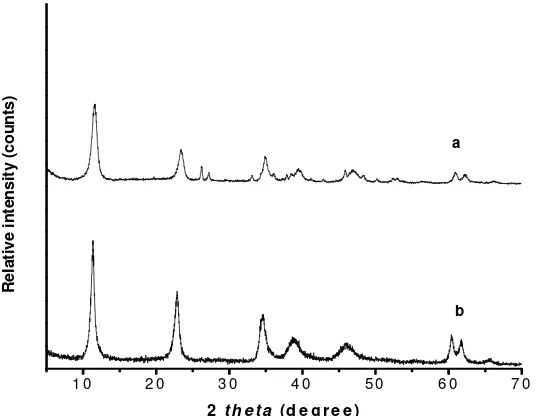
Synthesis and Characterization of Mg/Al HTlc. Fig. 2 shows the XRD pattern of product precipitated from starting solution containing AlCl3 with an initial Mg/Al
molar ratio of 2.0 at 70 ⁰C for 1 h. The XRD pattern of the Mg/Al HTlc consists of both sharp and symmetrical peaks with some asymmetrical peaks at high angle, indicating good cristallinity [27]. The three strong peaks at 2θ values of about 11.59⁰, 23.45⁰ and 34.57⁰ are characteristic of a layered structure and correspond to the (00l) reflections and the diffraction peak near 61.0⁰ corresponds to the (110) crystal plane. The presence of CO32- anions in the interlayer gallery of hydrotalcite is
confirmed by the characteristic basal spacing d003= 7.58 Å.
1 0 2 0 3 0 4 0 5 0 6 0 7 0
b
2 th e ta (d e g r e e )
Relati
ve i
n
tensi
ty (
c
o
unts)
a
Figure 2. XRD Patterns of Mg/Al HTlc (a) Synthesis and (b) Commercial
4000 3600 3200 2800 2 400 200 0 1600 1200 800 400
b
Rel
a
ti
v
e
Tr
ansmi
tt
a
nc
e
(%
)
W ave num ber (cm-1)
a
According to Xu and Lu [5], the value of 7.54 Å is characteristic for the (003) reflection of carbonate-bearing hydrotalcite while Johnson and Glasser [28] and Kloprogge et al. [29] showed that the (003) reflection are 7.56 Å and 7.83 Å respectively.
FT-IR spectra of the HTlc samples are shown in Fig. 3. The broad peak around 3448 cm-1 can be ascribed to the stretching of OH groups attached to Al and Mg in the layers. The bending vibration of interlayer water is
found at 1496 cm-1. The antisymmetric vibration of
CO32- appears at 1350 cm-1. The peak below 1000 cm-1
is attributed to lattice vibration of O, Al-O and Mg-O-Al.
Stability test of Mg/Al HTlc. Stability of Mg/Al HTlc toward dissolution increases sharply from pH 1 to pH 3 (Fig. 4). At pH 1, the remaining Mg/Al HTlc in the solution was only 42.32% and this remaining Mg/Al
HTlc in the solution increased to 94.21% at pH 3. At lower medium acidities (3 < pH ≤ 13), the remaining Mg/Al HTlc was relatively constant at value 98.00%.
At high medium acidity (low pH), the hydroxyl groups in the Mg/Al HTlc are protonated, their bonds to Mg and /or Al are broken and therefore the dissolution of metal cations is occurred. The portion of protonated hydroxide group decreases significantly at pH 3 and becomes insignificant at pH > 3.
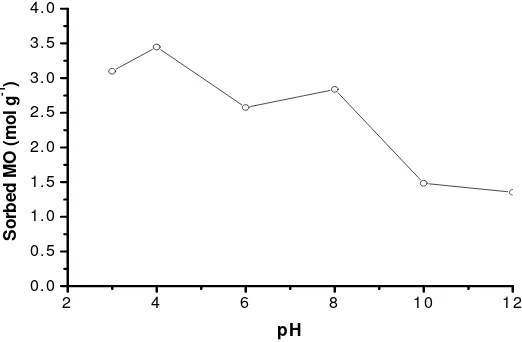
Effect of medium acidity on MO adsorption. The adsorption of MO on Mg/Al HTlc tends to increase with increasing medium acidity from pH 3 to 4; and then falls from pH 4 to 12 (Fig. 5). Since the MO have pKa1= 3.7 and pKa2 = 3.4 [30], with the increasing pH
from 3 to 4, more MO species are suspected negatively charged and hence the adsorption of MO on the positively charged Mg/Al HTlc is enhanced. However,
2 4 6 8 1 0 1 2 1 4
4 0 5 0 6 0 7 0 8 0 9 0 1 0 0
Stabili
ty
(%
)
p H
Figure 4. Effect of Medium Acidity on Stability of Mg/Al HTlc
2 4 6 8 1 0 1 2
0 .0 0 .5 1 .0 1 .5 2 .0 2 .5 3 .0 3 .5 4 .0
S
o
rb
ed
M
O
(m
o
l g
-1 )
p H
MO adsorbed decreased at pH 6, while at pH 8 MO adsorbed increased again. This is due to at pH value
below pHpzc, Mg/Al HTlc still positively charged.
According to Das et al. [31], pHpzc for Zn/Al
Hydrotalcite is 8.78, while for Mg/Al hydrotalcite is 12.0 [32]. Although Mg/Al HTlc still positively charged, the negatively charged MO must compete with the excess of hydroxide ion in the solution in occupying the active sites of the Mg/Al HTlc. This is why that the adsorption falls at pH higher than 8.
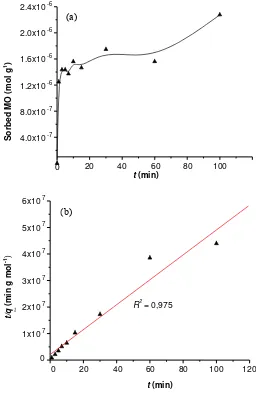
Rate of adsorption. Adsorption kinetics, indicating the adsorption rate, is an important characteristic of
sorbents. The adsorption profile of 5 mg L-1 MO
concentration as a function of interaction time is presented in Fig. 6 (above). The adsorption is initially rapid and then goes slower. The initial rapid adsorption was observed for the first 3 min and the adsorption still increased even at at the adsorption time more than 100 min.
Two models mentioned in the literature to describe the adsorption kinetics curves were considered [33]. The adsorption data matches well with the kinetic model of pseudo-second order as mathematically expressed in the following equation:
(1) 1
2 2
1
t e q e q k t q
t = +
where qt and qe are the amount sorbed at time t and at
equilibrium, k2 is the rate constant of adsorption and t
the interaction time.
Plot of t/qt against t resulted in linear relationship with
linearity (R2) as high as 0.975 (Fig.6 below). Based on the slope of the plot, the obtained adsorption rate constant (k2) was 1.03 × 10⁵ g mol-1 min-1.
Figure 6. Adsorption Profile of MO on Mg/Al HTlc as a Function of Interaction Time (a) and Plot of t/qt Against t in the
Kinetic Model of Pseudo-second Order Adsorption (b)
0 20 40 60 80 100 120
0
1x10 7
2x10 7
3x10 7
4x10 7
5x10 7
6x10 7
R2 = 0,975
t
t/q
(min g mol
-1 )
t(min)
(b)
0 20 40 60 80 100
4.0x10 -7
8.0x10 -7
1.2x10 -6
1.6x10 -6
2.0x10 -6
2.4x10 -6
Sorbed MO (mol g
1 )
t (min)
Adsorption isotherm studies. MO adsorption isotherm data at 5 mg L-1 were investigated to fit the models of Langmuir and Freundlich. These data were obtained by MO concentration measurement after adsorbent or adsorbate contact periods equal to the equilibrium times.
The well-known expression of the Langmuir model is
(2)
where C is the MO concentration in the solution after adsorption reaches equilibrium, m is mol of MO sorbed on 1 g Mg/Al HTlc, K the equilibrium constant, and b is the maximum amount of MO sorbed on Mg/Al HTlc (adsorption capacity). By plotting C/m against C, the values of b can be obtained from the 1/slope.
On the other hand, the Freundlich equation is
(3)
where C is the MO concentration in the solution after adsorption reaches equilibrium, m is mol of MO sorbed on 1 g Mg/Al HTlc, n is Freundlich constant, and B is Freundlich adsorption capacity (mol g-1). By plotting log m against log C, the values of n and B can be
obtained. The values of b, E and K was obtained from isotherm Langmuir, whereas B and n was obtained from isotherm Freundlich and correlation coefficients (R2) are given in Table 1 and Table 2. It can be seen from Table 1 and Table 2 that the values of the correlation coefficients demonstrate almost perfect agreement of the experimental data with Freundlich model. This, however, is indicative of the heterogeneity of the adsorption sites on Mg/Al HTlc particles.
Table 1. Adsorption Capacity (b), Energy (E), and
Affinity (K) were Obtained from Langmuir
Isotherm in MO Adsorption on Mg/Al HTlc
Adsorption parameters
Table 2. Adsorption Capacity (B) was Obtained from
Freundlich Isotherm in MO Adsorption on Mg/Al HTlc
B
(10-1 mol g-1) n R
2
4.93 1.87 0.929
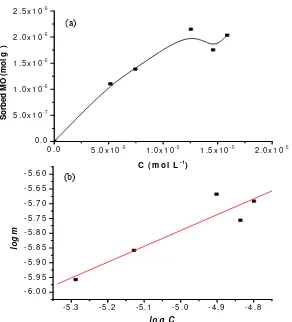
Figure 7. Adsorption Profile of MO on Mg/Al HTlc as a Function of the Remaining MO Concentration at Equilibrium (C)
(a) and the Relationship between C and C/m in the Langmuir Isotherm Model (b)
From plot of log C against log m, the obtained values of
B for the adsorption of MO on Mg/Al HTlc was 4.93 ×
10-1 mol g-1. The linearity (R2) of the plot was 0.929
(Fig. 7, below). Meanwhile, after obtaining b from
Langmuir isotherm, the value of K is then able to be determined from the intercept of plot of C/m against C. The calculation yields K value was 1.05 × 10⁵ (mol L-1)-1. According to the equation Es = -ΔGs = RT ln K, the
adsorption energy (Es) is then obtained as high as 29.13
kJ mol-1.
4. Conclusion
It was confirmed that Mg/Al HTlc synthesized from brine water was able to be used as sorbent for MO in solution. As-prepared the other HT or HTlc, this sample exhibit the (003) reflection of 7.58 Ǻ. The adsorption of MO was predicted to occur mainly on the outer surface through pseudo-second order adsorption reaching equilibrium. Adsorption isotherm was well described by the Freundlich model.
Acknowledgement
We would like to thank to Directorate General of Higher Education Ministry of National Education for research grants and Gadjah Mada University, Yogyakarta for providing research facilities and to Novi Bayu Alnavis, Rustina and Esti Sri Hardianti who contributed this research.
References
[1] F. Cavani, F. Trifiro, A. Vaccari, Catal. Today 11 (1991) 173.
[2] J. He, M. Wei, B. Li, Y. Kang, D.G. Evans, X. Duan, Struct. Bond. 119 (2006) 89.
[3] L. Lv, J. He, M. Wei, D.G. Evans, Z. Zhou, Water Res. 41 (2007) 1534.
[4] J. Choy, J. Jung, J. Oh, M. Park, J. Jeong, Y. Kang, O. Han, Biomaterials 25 (2004) 3059.
[5] Z.P. Xu, G.Q. Lu, Chem. Mater. 17/5 (2005) 1055. [6] F. Kovanda, D. Kolousek, Z. Cılova, Z. Hulınsky,
Appl. Clay Sci. 28 (2005) 101.
[7] O. Saber, J. Colloid Interface Sci. 297 (2006) 182. [8] S.P. Li, Z.P. Zhou, J. Disper Sci. Technol. 27
(2006) 1079.
[9] T. Kameda, T. Yoshioka, M. Uchida, A. Okuwaki, Mol. Cryst. Liq. Cryst. 341 (2000) 407.
[10] E. Heraldy, Pranoto, D.M. Wijanarko, K.D.
Nugrohoningtyas, B.B. Dinala, I. Sujarwo, Alchemy. 5/1 (2006) 54.
[11] E. Heraldy, Pranoto, D.M. Wijanarko, I.C.
Riasdianti, Alchemy. 6/2 (2007) 23.
[12] S.J. Santosa, E.S. Kunarti, Karmanto, Appl. Surf. Sci. 254 (2008) 7612.
[13] J. Orthman, H.Y. Zhu, G.Q. Lu, Sep. Purif.
Technol. 31 (2003) 53.
[14] N.K. Lazaridis, Water Air Soil Poll. 146 (2003)
127.
[15] C. O’Neill, F.R. Hawkes, D.L Hawkes, N.D Lourenco, H.M. Pinheiro, W. Delee, J. Chem. Technol. Biotechnol. 74 (1999) 1009.
[16] M.X. Zhu, Y.P. Li, M. Xie, H.Z. Xin, J. Hazard. Mater. B. 120 (2005) 163.
[17] P.C.C. Faria, J.J.M Orfao, M.F.R. Pereira, Water Res. 38 (2004) 2043.
[18] W.T. Tsai, C.Y. Chang, M.C. Lin, S.F. Chien, H.F. Sun, M.F. Hsieh, Chemosphere 45 (2001) 51. [19] C.C. Wang, L.C. Juang, T.C. Hsu, C.K. Lee, J.F.
Lee, F.C. Huang, J. Colloid Interface Sci. 273 (2004) 80.
[20] V. Meshko, L. Markovska, M. Mincheva, A.E. Rodrigues, Water Res. 35 (2001) 3357.
[21] P. Janos, H. Buchtova, M. Ryznarova, Water Res. 37 (2003) 4938.
[22] M.A. Ulibarri, I. Pavlovic, M.C. Hermosin, J. Cornejo, Appl. Clay Sci. 10 (1995) 131.
[23] Y. You, G.F. Vance, H. Zhao, Appl. Clay Sci. 20 (2001) 13.
[24] E.L. Crepaldi, J. Tronto, L.P. Cardoso, J.B. Valim, Colloid Surf. A. 211 (2002) 103.
[25] A. Bhaumik, S. Samanta, N.K. Mal , J. Appl. Sci. 4/3 (2004) 467.
[26] Z.M. Ni, S.J. Xia, L.G. Wang, F.F. Xing, G.X. Pan, J. Colloid Interf. Sci. 316 (2007) 284.
[27] M.A. Ulibarri, I. Pavlovic, C. Barriga, M.C. Hermosin, J. Cornejo, Appl. Clay Sci. 18 (2001) 17.
[28] C.A. Johnson, F.P. Glasser, Clay. Clay Miner. 51/1 (2003) 1.
[29] J.T. Kloprogge, D. Wharton, L. Hickey, R.L. Frost, Am. Mineral. 87 (2002) 623.
[30] R.W. Sabnis, Handbook of Biological Dyes and Stains: Synthesis and Industrial Applications, A John Wiley & Sons, Inc., Hoboken, New Jersey, 2010, p.302.
[31] D.P. Das, J.P. Das, K. Parida, J. Colloid Interf. Sci. 261 (2003) 213.
[32] M.J.S. Martin, M.V. Villa, M.S. Camazano, Clays Clay Miner. 47 (1999) 777.