This research was quantitative based on the experimental research. An
experimental design is the general plan for carrying out a study with an active
independent variable. The design is important because it determines the study’s
internal validity, which is the ability to reach valid conclusions about the effect of
the experimental treatment on the dependent variable.1 It means that experimental
design is a general plan of research design that is used to reach valid conclusion
about the influence of the variable in this research.
This research used quasi experimental research design. Quasi experimental
design is a research design that includes assignment, but not random assignment of
participants to groups. This is because the experimenter can not artificially create
groups for the experiment.2 It means that in quasi experimental research design the
researcher cannot take only few groups as samples because it can interfere learning
process.
1 Donald Ary, Lucy Cheser Jacobs, and Chris sorensen, Introduction to Research in
Education, (8th Edition), (Belmont: Wadsworth Cengage Learning, 2002), p.301 2
In this research, two classes selected, the first class as a control class and
the second class as an experimental class. The researcher will use pre-test and
post-test group design.3 It is design of this research as follow:
Table 2
Pre and Posttest Design
Select Control Group Pretest No Treatment Posttest Select Experimental Group Pretest Experimental Treatment Posttest
Control class was a class that was not given treatment by using group
investigation and experimental class was a class that was given treatment by using
group investigation. In this research, the students were given pre-test to know their
reading comprehension of recount text before treatment by using group
investigation and posttest after the treatment by using Group Investigation in
experimental class and by Reading Aloud in control class. The pretest and posttest
were administered control and experimental class.
B. Variable of the Research
A variable is a characteristic or attribute of an individual or an
organization that a researcher can measure or observe and varies among
individuals or organizations studied.4 There were two variables in this research
namely: independent variable and dependent variable. An independent variable is
presumed to effect (at least partly cause) or somehow influence at least one other
3Ibid. p. 310 4
variable. The dependent variable “depends on” what the independent variable
does to it, how it affect it.5 The variables were investigated in this research, those
are:
1. The independent of this research was group investigation (X), and
2. The dependent variable was students’ reading comprehension on recount
text (Y).
C. Operational Definition of Variable The operational of variables are as follows:
1. Independent Variable (X)
Group investigation is a strategy for teaching reading that asking the
student to make a group and investigate reading material especially in reading
comprehension of recount text.
2. Dependent Variable (Y)
Students’ ability in reading comprehension on recount text on personal
recount is the ability to comprehend the reading material and retelling the event
in the past. The aspect reading comprehension that taught to the students are
main idea, expression/idiom, inference, grammatical features, detail, excluding
facts not written, supporting idea and vocabulary in context.
5Jack R, Fraenkel and Norman E. Wallen, How to Design and Evaluate Research in
D. Population, Sample and Sampling Technique of the Research 1. Population
According to Creswell, the term population, as used in research, refers
to all the members of a particular group. It is the group of interest to the
researcher, the group to whom the researcher would like to generalize the
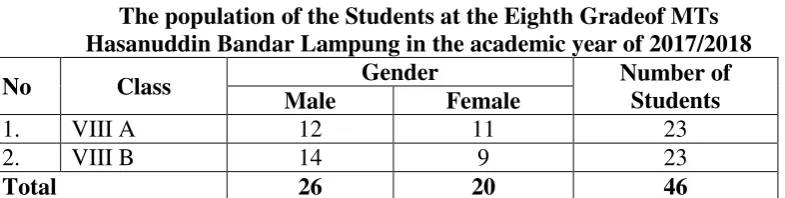
results of a study.6 The population of this research were all the students at the
eighth grade of MTs Hasanuddin Bandar Lampung 2017/2018 which consist
of 46 that are divided into two classes. Based on those statements, all the
classes are the population in this research. The population of the students at
the Eighth of MTs Hasanuddin Bandar Lampung in the academic year of
2017/2018 can be seen in Table 3.
Table 3
The population of the Students at the Eighth Gradeof MTs Hasanuddin Bandar Lampung in the academic year of 2017/2018
No Class Gender Number of
Students
Male Female
1. VIII A 12 11 23
2. VIII B 14 9 23
Total 26 20 46
Source: Document of MTs Hasanuddin Bandar Lampung in the Academic Year of 2017/2018
2. Sampling Technique
In this research, the sample took from the population of research by
using cluster random sampling technique. The selection of groups, or clusters,
6
of subjects rather then individuals is known as cluster random sampling.7 The
research was conducted at the eighth grade that was consists two classes. The
steps in determining the experimental class and control class as follows:
a. The first, the researcher made a kind of lottery.
b. Second, the researcher provided 2 pieces of small paper which each
piece was the name of each class then the researcher rolled them up and
put them into a glass.
c. Third, the researcher shook the glass and took one of the pieces of the
paper. For the first paper as the experimental class.
d. Next, the researcher shook the glass again and take one small of piece of
rolled paper. The name of class must be different with the name in the
first shake so for the second paper as the control class.
3. Sample of the Research
Sample is part of population. According to Fraenkel, a sample is any part of a population of individuals on whom information is obtained.8 Based
on the definition above, sample is part of population that used in this research.
The eight grade consist two classes that were VIII A and VIII B. By using
cluster random sampling technique the researcher choose VIII A as
experimental class and VIII B as control class.
E. Data Collecting Technique
In collecting the data, the researcher used some techniques, they were:
1. Pretest
The pretest was given before the treatment by using group investigation.
The pretest was administered to measure the student’ reading comprehension
ability on recount text. The test was in form of multiple choice questions about
recount text based on the provided topics that consist of 25 items with four
alternative options and 60 minutes time allocation.
2. Posttest
The posttest was conducted after the students in experimental and control
class given the treatment. It used to know student’ reading comprehension
recount text after being given treatment by using group investigation. It was
administered after treatment given to measure the influence of using group
investigation towards student’ reading comprehension on recount text, the test
was in form of multiple choice questions about recount text based on the
provided topics that consist of 25 items with four alternative options and 60
minutes for time allocation.
F. Instrument of Research
This research used multiple choice question (MCQ) as a tool for testing in
oder to know students’ reading comprehension on recount text. At the test content
comprehension on recount text. The specifications were used in measuring reading
comprehension are: main idea (topic), expression / idiom/ phrases in content,
inference (implied detail), grammatical feature, detail (scanning for a specifically
stated detail), excluding fact not written, supporting idea, vocabulary in content.
The researcher prepares the instrument in the form of multiple choice questions.
The specification pretest and posttest can be seen in Table 4 and 5.
Table 4
The Test Specifications for Pretest and Posttest After Validity
No Aspect
Item Number Pre-Test T otal Post Test T ot al
Even Odd Even Odd
1 Main idea ( Topic) - 1, 9, 11 3 24 1, 13 3
2 Expression/Idiom/ Phrase
In context 14 21 2 4 9 2
3 Inference (Implied detail) 12, 24 - 2 2 23 2
4 Grammatical features
( reference) 4, 16 3, 15 4 10, 16 5, 15 4
5 Detail (scanning for a
specifically stated detail) 8, 20 23 3
8, 18,
20 - 3
6 Excluding facts not
written 18 5, 19, 25 4 6, 12 7, 21 4
7 Supporting idea(s)
2, 22 7, 13 4 14 3, 19,
17 4
8 Vocabulary in context. 6, 10 17 3 22 11, 25 3
G. Research Procedure
In this research, this research was conducted three steps; they were as
follows:
1. Planning
Before the researcher applied the research procedure, the researcher made
some planning to run the application well. There were some steps that were
planned by the researcher. The procedure of making planning of the research can
be seen as follows:
a. Determined the subject of the research
The subjects of the research were the students at the first semester of the
Eighth grade of MTs Hasanuddin Bandar Lampung.
b. Preparing try-out
The researcher prepared a kind of test (called try-out test) that was given to
the students. The researcher prepared try-out test for pre-test and post-test. Then
the researcher evaluated the test items.
c. Preparing pre-test
The researcher prepared pre-test that was given to the students. The pre-test
d. Determining the material to be taught
The researcher determined the material to be taught to the students, that
was reading comprehension of recount text. The researcher gave treatment using
Group Investigation for Experimental class and Reading Aloud for Control class.
e. Preparing post-test
The researcher prepared a kind of test (called post-test) that was given to
the students. By giving post-test,the researcher know the students’ improvement in
their reading ability in comprehending English text or not.
2. Application
After making the planning, the researcher tried to apply the research
procedure that already planned. There were some steps in doing this research, they
were
a. In the first meeting before given the treatment, the researcher gave pre-test.
This test in the form of recount text that consist of 25 items.
b. In the second until fourth meeting, after given the pre-test to the students, the
researcher conducted the treatment by using Group Investigation in the
experimental class and using Reading Aloud in control class.
c. In the fifth meeting, the researcher gave post-test. The test was multiple
choice with 4 options a, b, c and d. The total number of the test items were
determined by the validity and reliability analysis of the try out. After being
3. Reporting
The last point that should be done in the research procedure is reporting.
There are as follows:
1. Analyzing the data received from try-out
2. Analyzing the data received from pre-test and post-test
3. Making a report based on the findings.
H. Scoring Procedure
Before getting the score, the researcher determined the procedure used in
scoring the students’ work. In order to do that, the researcher used Arikunto’s
formula.9. The scores of post test and pretest was calculated by using the following
formula :
S = 𝑟
𝑛𝑥 100
Notes :
S = Score of test
r = Total of right answer
n = Total items
I. Tryout
Try-out test was given in try-out class to evaluate the test items to know
the test valid or not before used to pre-test and post-test items. The try-out test
was held on 4th November 2017 that given to VIII MTs Al-Furqon Rawi in South
Lampung, because in MTs Hasanuddin only have two classes. The researcher
chose MTs Al-Furqon to be a try out place because it has the same level with
MTs Hasanuddin, it has same curriculum, and same conditions of the learner.
1. Validity of the Test
To know whether the test is good or not, some criteria should be
considered. The criteria of a good test are validity (content validity, construct
validity and items validity), and reliability. Validity is defined as the extent to
which scores on a test enable one to make meaningful and appropriate
interpretations.10 It means that Validity is a criterion in a test that makes the
text good and suitable for students. To measure whether the test has good
validity or not, the researcher used the content validity and construct validity.
a. Construct Validity
To measure construct validity refers to the source. Showing the
measurement used contains correct operational definition, which is
based on the theoretical concept. Construct validity is the degree to
which scores on a test can be accounted for by explanatory
construct of sound theory.11 It means that construct validity is a
measurement of values on a score based on theoretical concept.
This research administered the test whose the scoring covered eight
aspect of reading they are: main idea, Expression/idiom/phrase in
context, inference, supporting idea, grammar, vocabulary, detail,
excluding fact not written. To make sure, the researcher consulted
the instrument of the test (pre-test and pos-test) to the English
lecturer of UIN Raden Intan Lampung (Mr Satria Adi
Pradana,M.Pd) as a validator, for determining whether the test has
obtained construct validity or not. After the researcher consulted the
test with the validator, the items test was suitable to the eight
aspects of reading. (see appendix 3)
b. Item Validity
The test was given to the students are 50 multiple questions to
know valid or not the questions that gave to the student at eight
grade of MTs Al-Furqon Rawi Lampung Selatan. The item validity
used to measure the validity of the test items. The researcher was
given the tryout of the test to students from the different sample.
The researcher used ANATES to calculate the data obtained from
the try out to find the item validity of each them. After the
researcher calculated the data by using ANATES, The result of the
items try out for pre-test there were 23 items considered invalid.
The invalid items number were 1, 5, 7, 8, 11, 12, 13, 14, 15, 16, 17,
items were 27 items. They were the items number 2, 3, 4, 6, 9, 10,
19, 20, 22, 23, 24, 25, 26, 28, 29, 30, 32, 33, 34, 35, 36, 37, 38, 42,
43, 48, and 49. It can be seen in appendix 4. After the researcher
calculated the try out test by using ANATES, the researcher
consulted again to the validator (Mr Satria Adi Pradana, M.Pd.) he
said to remove two items test number 24 and 32 that is very
difficult and very easy, hence the test items became 25 item to use
in pretest and posttest.
2. Reliability of the Test
The way to know a good test is by reliability. Reliability refers to the
consistency of test scores. People who use such measuring instruments must
identify and use techniques that will help them determine to what extent their
measuring instruments are consistent and reliable.12 Reliability is the
consistency of the measurement and dependable of the measurement. Besides
a good test should have high validity, a good test should have high reliability,
scores need to be consistent. The researcher used ANATES to know reliability
of test.
The criteria of reliability test are :
0.91 – 1.00 = Very high reliability
0.71 – 0.90 = High reliability
0.41 – 0.70 = Medium reliability
0.21 – 0.40 = Low reliability
0.0 –≤ 0.20 = Very Low reliability.
From the criteria of reliability above, it can be drawn a conclusion that
the result obtained in the ANATES of reliability that reliability test in reading
comprehension has high reliability because the result of the reliability was
0.81 and the result of posttest was 0.74. The researcher concluded that the
degree of the level of reliability of the instruments was high reliability. (see
appendix 4)
J. Data Analysis
After collecting the data, the researcher analyzed the data by using
independent sample t-test. There were two tests that must be done before
analyzing the data by using independent sample t-test. They were normality test
and homogeneity test.
1. Fulfillment of the assumptions a. Normality Test
In this research, normality test used to know whether the data in the
experimental class and control classes are normally distributed or not. In this
research, the researcher used statistical computation by using SPSS (Statistical
Package for Social Science) for normality. The tests of normality employed were
Ho : The data are normally distributed.
Ha : The data are not normally distributed.
While the criteria of acceptance or rejection of hypotheses for normality
test are as follows:
Ho is accepted if Sig. > α = 0.05
Ha is accepted if Sig. < α = 0.05
b. Homogeneity Test
In this research, homogeneity test used to determine whether the data in
experimental class and control class are homogeneous or not. In this case, the
researcher used statistical computation by using SPSS (Statistical Package for
the Social Science) for homogeneity of test. The test of homogeneity employing
Levene statistic test.
The hypotheses for the homogeneity tests are formulated as follows:
Ho = the variances of the data are homogenous
Ha = the variances of the data are not homogenous.
While the criteria of acceptance or rejection of homogenity test are as follow:
Ho is accepted if Sig. > α = 0.05
3. Hypothetical Test
The researcher wused independent sample t-test. In this case, the researcher
used statistical computation by using SPSS (Statistical Package for Social Science)
for hypothetical of test. The purpose of using SPSS in this case is to practicality
and efficiency in the study.
The hypotheses are :
Ha : There is a significant influence of using Group Investigation towards
students’ reading comprehension on recount text at the first semester of
the eighth grade of MTs Hasanuddin Bandar Lampung, in the academic
year of 2017/2018.
Ho : There is no significant influence of using Group Investigation towards
students’ reading comprehension on recount text at the first semester of the
eighth grade of MTs Hasanuddin Bandar Lampung, in the academic year
of 2017/2018.
While the criteria of acceptance or rejection of hypothesis are:
Ha is accepted if Sig. < α = 0.05