CHAPTER III
RESEARCH METHOD
A. Method of the Research
This research was an experimental research because the aim of this research was to find out the effectiveness of CSW (Catch, Speak, and Write) game for teaching descriptive writing. There are two groups in this research, they are experimental group and control group. Experimental group is the group which is given treatment by using CSW (Catch, Speak, and Write) game in teaching and learning process of writing descriptive text at junior high school. The control group is the group which is given a conventional technique that has been implemented in teaching and learning process.
conditions. Many factors contribute in the result of this research. This fact makes the writer minimize every single bias.
Based on the fact above, this research belongs to quasi-experiment. The subject of this research is the students who have different background, family, and basic knowledge. These differences made this research compromise with any bias that can affect in this research. Knowing this fact, this research gives control of the bias as tight as possible.
The design of this research is as follow:
X: Q1...X…….Q2
C: Q1…………...Q2
Where:
E: Experimental group C: Control group Q1: Pre-test Q2: Post test X: Treatment
to make a simple of descriptive text. By using this test, it could be found
some information about students’ basic knowledge.
After getting some data from those classes, the writer would give the treatment for experimental class. Treatment in this research was the implemented of CSW (Catch, Speak, and Write) game in teaching and learning process. The writer gave three times meeting for experimental class and contrast with the control class that it taught in usual ways. There was no special treatment or implementing any strategy or method in control class.
The material that had been learned by students is writing, especially writing descriptive text. This research had strong reason why this research chooses the material. The control class also got some material, but the way of teaching different with the experimental class. After giving the treatment for the experimental class, the writer gave post-test as the last step. Post-post-test itself containing as same as pre-post-test grade difficulty, but in different type but still had similarity.
B. Place and Time of the Research
1. Place of the Research
2. Time of the Research
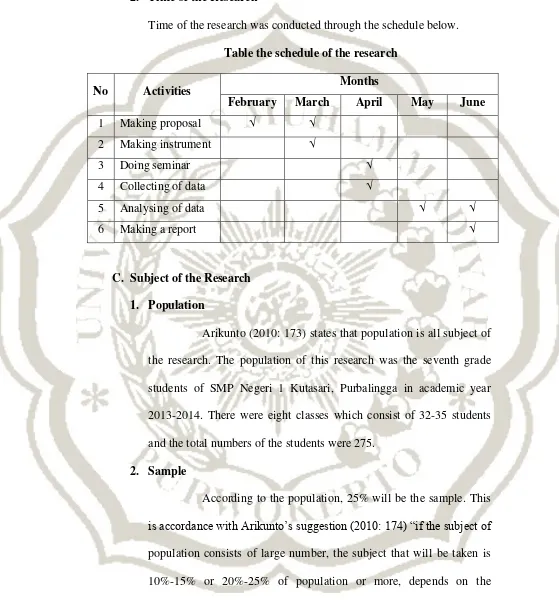
Time of the research was conducted through the schedule below.
Table the schedule of the research
No Activities Months
February March April May June
1 Making proposal √ √
2 Making instrument √
3 Doing seminar √
4 Collecting of data √
5 Analysing of data √ √
6 Making a report √
C. Subject of the Research
1. Population
Arikunto (2010: 173) states that population is all subject of the research. The population of this research was the seventh grade students of SMP Negeri 1 Kutasari, Purbalingga in academic year 2013-2014. There were eight classes which consist of 32-35 students and the total numbers of the students were 275.
2. Sample
According to the population, 25% will be the sample. This
is accordance with Arikunto’s suggestion (2010: 174) “if the subject of
population consists of large number, the subject that will be taken is 10%-15% or 20%-25% of population or more, depends on the
were two classes as the sample of the research.
In the experimental class, the lesson was taught or presented by using CSW (Catch, Speak, and Write) game and in the control class without using CSW (Catch, Speak, and Write) game. This research took class VII G (control class) and class VII H (experimental class).
3. Sampling Technique
Arikunto (2010: 176) says that sampling is the process of selecting of the number of individuals for a study in such way that the individuals represent the larger group from which they were selected. This research took class VII G as the control class and class VII H as the experimental class because it was clarified before that this research belong to Quasi Experimental research, and the design of this research was non-equivalent group design. This condition made this research took those classes. In non-equivalent group design, this research could take classes or groups even though both of them have different basic knowledge and characteristic. It gives a freedom for this research to choose those classes. Moreover in the school, the class is naturally formed by the school regulation.
D. Method of Collecting Data
questionnaire, interview, and observation. To collect data, this experiment uses test. Test is the question that is used to measure skill, knowledge, intelligence or talent owned by individual or groups. (Arikunto 2010:193). The test would find out the writing mastery in the research. This research used two kinds of test, as follows:
1. Pre-test
Pre-test was conducted to both of class, experimental class and control class. By giving pre-test, the basic score of two classes could be calculated. The type of instrument in this test was subjective test. This test provided a question or a direction to the students to make a simple descriptive text.
2. Post-test
Post-test was used to measure the effect of certain treatment in this case of CSW (Catch, Speak, and Write) game. The type of instrument in this test was still subjective test. This test provided a direction to the students to make a simple of descriptive text.
E. Method of Analysis Data
After all of data were collected, it would be analysed. There were some steps in this stage, the steps were:
1. Determining the individual students’ ability
organization, vocabulary, language, and mechanic. Here is the analytical scoring profile suggested by Nurgiyantoro (2001: 307-308).
No Aspects Score Indicators Criteria
1 Content
27- 30 Complete information, substantive, complete in developing writing, relevant with the problem
Very good- Perfect 22- 26 Enough information, less substantive, not
enough in developing writing problem. Fair- Good 17- 21 Limited information, there is not substantial, not
enough in developing writing problem Bad- Fair 13- 16 There is not content and problem Very bad- Bad
2 Organization
18-20 Fluent in expressing, clear in expressing the idea, complete, well organization, logic, and cohesive
Very good- Perfect
14-17
Less in fluency, disorganized but clear in the main idea, limited in supporting material, logic but incomplete.
Fair- Good
10-13 Not fluent, irregular idea, illogical in developing
idea. Bad- Fair
7-9 Not communicative, disorganized, invaluable. Very bad- Bad
3 Vocabulary
18- 20 Correct in word choice, mastery in word form. Very good- Perfect 14-17 Sometimes incorrect in choosing the word but it
does not disturb the meaning Fair- Good
10-13 Limited in using word, often make mistake in
vocabulary and it can make change the meaning. Bad- Fair 7-9 Bad in choosing the word, less in vocabulary and
invaluable. Very bad- Bad
4 Language
22-25 Effective in complex construction, only few in language mistake.
Very good- Perfect 18-21 Simple construction but effective, few mistake in
does not change the meaning.
11-17 Serious mistake in the sentence construction and
unclear meaning. Bad- Fair
5-10 Not mastering in syntactical construction, many
mistakes, not communicative and invaluable. Very bad- Bad
5 Mechanic
5 Mastery writing rule, only some spelling error. Very good- perfect 4 Sometimes there is spelling error, but it does not
change the meaning. Fair- Good
3 Sometimes there is spelling error, uncertain
meaning Bad- Fair
2 Not mastering in writing, many spelling error,
unreadable writing, invaluable Very bad- Bad
2. Determining classical students’ ability
To measure the students’ ability in writing both control and experiment group, the writer used the following formula:
̅ ∑
Where:
̅ = mean score of control class
∑x2
= the sum score of control class N = the total number of respondents
̅ ∑
Where:
∑y2
= the sum score of experimental class N = the total number of respondents
3. Hypothesis Testing
To know the effect of CSW (Catch, Speak, and Write) game in teaching writing, the writer used t-test formula. Before the writer used it, the writer did some steps, they were:
a. Making a table
(See the appendix of table students’ score of Experiment class and
Control class)
b. Calculating means of deviation of experiment class(Mx) and
control class (My)
To get the calculation of deviation of control and experimental class, the writer used some steps:
1. Finding mean of deviation of experimental class (Mx)
a. The post-test score of each student was reduced by the pre-test score.
b. Then, calculating the total of deviation (residual) ∑X.
c. Finally, calculating the total of deviation of the experimental class and divided into the numbers of students in that class.
Where:
= mean of deviation of experimental class
∑X = total deviation
N = the total number of respondents 2. Finding the mean of deviation of control class
a. The post-test score of each student was reduced by the pre-test score.
b. Then, calculating the total of deviation ∑x
c. Finally, calculating the total of deviation of the experiment class and divided by the number of the students in that class.
∑
Where:
mean of deviation of the control class
∑Y = total deviation
N = the total number of respondents
c. Measuring the square deviation
1. The square of deviation of experimental class
∑ ∑ (∑ )
Where:
= the sum of respondents
2. The square deviation of control class
∑ ∑ (∑ )
Where:
∑ = the total square of control group N= the sum of respondents
d. Inter Rater Reliability
In calculating the research of the students’ score in writing, the writer asks someone as an inter-rater. Inter-rater is someone who gives the score how much homogeneity or consensus. In this case,
the rater is one of the English teachers who don’t have acquaintance
with the students, she/he has no relation to the students because
she/he doesn’t teach the sample. Furthermore, the mean between the
first and the second markers will be calculated by joint agreement formula:
Where:
X = the students’ writing score
I = the first rater’s writing score
II = the second rater’s writing score
e. Calculating t-test Formula
T-test formula is used to know whether there is any effect of CSW (Catch, Speak, and Write) game in teaching descriptive writing or not
√[ ∑ ∑ ] [ ]
Where:
= mean score of experimental class = mean score of control class
∑ = the total square of experimental class ∑ = the total square of control class
= the total number of experimental class = the total number of control class