THE FACTORS AFFECTING BALANCE SHEET TO CAPITAL STRUCTURE
DURING FINANCIAL CRISIS 2008-2011 (THE CASE ON COMPANIES IN
ASEAN COUNTRIES)
Hendro Lukman
Faculty of Economics, University of Tarumanagara. Jakarta, Indonesia [email protected]
Abstract
The global economic crisis that happened in USA and Europe had influenced othercountriesincluding ASEAN countries. Economic or financial crisis that occurred in 2008 and 2011 did not carry the same impact on ASEAN countries. There werea few countries that were still showing growth. The crisis had also affacted to micro-economic sectors, such as companies. One of the effects of the crisis for the companies was the balance sheet effect, an impact on their capital structure. This study was conducted to see how the economic and financial crisis influenced the capital structure of large-capitalizedpublic companies in 2008-2011 in all members of ASEAN. The companies' capital structure was influenced by internal factors and external factors. This study used Simultaneous Regression. The results were: firm size factor was dominant in all ASEAN countries; inflation rate was dominant in five countries; company growth was dominant in four countries; asset structure was dominant in three countries;non-debt tax shield; interest rates and economy growth (GDP) were dominant in two countries; menwhile the exchange rate was dominant in one country.
Keywords: Balance Sheet Effect, Capital Structure, ASEAN
Introduction
The economic crisises in 2008 in The United States of America and in 2011 in Europe had caused a domino effect. The crisises had resulted in an increase in inflation rate and a decline in economic growth. These effects had notonly occured in America and Europe but also in ASEAN countries. However, phenomenons of the effects were not the same for each member of the ASEAN countries. In 2008, many ASEAN countries experienced economic growth such as Singapore (4.0%), Malaysia (4.5%), Thailand (5.8%), Philippines (1.8%) and Indonesia (5.4%). Capital markets in 2011 in many ASEAN countries showed positive growth such as Indonesia (0.31%) and Philippines (0.24%) although ASEAN capital market hada minus growth of 7.15%.
The domino effect of financial and economic crisis can be explained through common macroeconomic conditions. The macroeconomic factors are: GDP, Inflation and Interest rate. GDP shows the prosperity and development rate in a country. Inflation shows the consumption rate, liquidity and distribution channel (Barro, 2008). Interest Rate is determined by supply and demand of money (Budiono, 1995) and higher interest rate will leadto a reduction in investment (Sugeng, 2012).
How does the economy of a country affect a corporate? Modigliani-Miller Model says there is irrelevant financial relationship between financial corporate with economic fluctuation. The crisis in 1970’s was caused by mismanagement of macroeconomic policy by the government. In 1980’s, the crisis appeared because of the panic level of liquidity holders. The year 1999 showed the relationship among corporate sector and banking with macroeconomics. The phenomenon is called balance sheet effect in which a crisis may cause effects of bad corporate’s balance sheet condition.
The financial structure in developing countries has become the source of weakness and crisis (allen et.al). Factors in financial structure comprise of composition of assets and liabilities, currency mismatch, capital structure problems and solvency problems. On the other side, uncontrolable factors like macro-economic policy, social, culture, demography and environment, politics, government and law can influence the degree of crisis.
The reason of this study was to see whether the global financial crisis will effect the capital structure of public companies with large-capitalizedbecause they will be driving the rise and fall of stock price index. With the continued presence of economic growth in ASEAN countries, but the share price index has declined and it is difficult to
Rise
420 420 Literature Review
Capital Structure
The capital structure is a combination of a venture capital contained in the company's balance sheet. There are two sources of capital which form the structure of capital, namely equity and long-term debt. The composition of these two elements will form the leverage position of a company and leverge position will cause the cost of capital. Therefore, this combination should be evaluated to get a low capital cost or or identical financial gearing ratios as they attempt to maximize the tax savings. (Julius, 2012). Shahar (2015) cited from Chen (2011) that stated among the theories are Static Trade off theory which derived by Modigliani and Miller (1963) was the earliest and most recognized which explains the formulation of capital structure, then Trade Off Theory which assumed that there are optimal capital structures by trading off the benefits and cost of debt and equity. The decision on the capital structure can theoretically be evaluated from an economic standpoint and behavior by using Trade-Off Theory and Pecking Order Theory. The trade-off models have dominated the capital structure literature. The tax benefit-bankruptcy cost trade-off models (DeAngelo and Masulis (1980) predict that firms will seek to maintain an optimal capital structure by balancing the benefits and the costs of debt. The benefits include the tax shield whereas the costs include expected financial distress costs. (Carment & Farhat, 2009). On the other side, The pecking order theory of capital structure a little more weight on tax considerations, and predicts the company will make a choice in accordance with available cash and external financing constraints level either endogenous or exogenous in raising capital for company expansion (Julius, 2012). Although there are corporate capital structure theories explaining firms financing decisions, little is know about how macroeconomic conditions affect firms leverage (Cook and Tang, 2006) (Mhutama 2013). According to Korajaczyk and Levy (2002), studied capital structure choice macro economic conditions and financial macroeconomic conditions and financial constraints (Muthama, 2013).
Trade-off theory of capital structure
Effective financial management and characters affect the capital structure is an important thing for a company to obtain a better operating performance. A wrong decision on capital structure can lead to financial difficulties and even bankruptcy. There are many theories developed to analyze alternative capital structure. One theory is the trade off theory gained Modigliani and Miller (1963). Trade-Off theory is the oldest theories of capital structure that emphasizes the optimal capital structure. The trade-off theory MM suggested that emphasis on the modification of the tax shield benefits combined with the company's costs on the financial difficulties and agency fee (Shahar 2015). Therefore, the optimal capital structure that maximizes the value of the company in balancing costs and benefits of an additional unit of debt. (Ghazouani, 2013) and companies increase leverage to achieve the target debt ratio (Jibran, 2012)
Pecking Order Theory
This theory explains the cost of financing with asymmetric information. Financing in a company comes from three sources: internal funds, debt and equity. Company will choose the sources according to preference of priority which bear the lowest risk, among retained earnings or internal fund, debt issue and stock issue (Myers, 1984). This theory states that the company complies with the hierarchy of sources of financing with prefference used internal financing when available, debt and equity(Jibran, 2012).Helwege and Liang (1996) in Tjusi, (2011) investigated the pecking order model of capital structure by examining the financing of public companies in the United States in 1983 showed that the probability of external funds not associated with a lack of internal funds, even though the company with surplus cash to avoid external funding , In conclusion companies in the United States which able to access the capital markets did not follow the pecking order theory when choosing the type of security offered. Furthermore, Fama and French (2002) reported that, of the empirical analysis, they concluded that many of the predictions together on the trade-off theory and the pecking order theory tends to do well, however, when the prediction together confirmed, attributes this theory becomes unclear ,
Research Methodology
Variables used in this study consist of internal factors and external factors that influence large-capitalizedcompanies in six member countries of ASEAN, including Indonesia, Malaysia, Philipine, Singapore, Thailand and Vietnam. Internal factors were firm size, company growth, financial ratio, assets structure, and non-debt tax shield. External factors were interest rate, exchange rate, inflation rate, and economy growth (GDP). The samples were 50 large-capitalized companies which are listed in capital market during 2008-2011.
The operational variables are : Firm Size
H1: Firm size will possitivly affect to capital structure.
Company Growth
Companies that grow tend to require a funding increase. Capacity in demand depends on internal financial funds. If the company as a whole rely on internal finance, is likely to interfere with growth. Companies that have the potential to grow with little capital structure will undergo risk. The high growth requires high external funds to enable the compatibility with growth.
H2: Company growth will positively affect to capital structure
Financial risk
Financial risk is the risk for companies is the increased variability in net income or an additional risk caused by the use of financial leverage (debt).
H3: Financial risk will positively affect to capital structure
Assets structure
Asset structure is an important determinant of capital decision. Assets which consists of tangible assets have more liquidation value can be used as collateral. Pecking order theory predicts that companies with more itangible assets be less vulnerable to the problem of asymmetric information and reduce agency costs. the agency costs of debt which is secured than unsecured debt.
H4: Assets structure will positively affect to capital structure.
Non Tax shield
Non-debt tax shield (NDTS) or the tax savings that is not sourced from debt is not tax savings derived from loan interest paid. Non-debt tax shield in the form of depreciation of fixed assets. The higher the depreciation of a company, the higher the fixed assets owned by the company, so the company will be easier to obtain a loan from outsiders by pledging assets of the company. Lim (2012), found that the variable non-debt tax shield (tax savings) positive and significant effect on the capital structure (leverage).
H5: Non-debt Tas Shield will positively affect to capital structure.
Interest rate
Interest rates represent the cost of borrowing capital for a given period borrowing capital for a given period of time (muthama 2013). An interest rate is the rate at which interest is paid by a borrower for the use of money that they borrow from a lender
.
H6: Interest Rate will positively affect to capital structure.
Inflation
Inflation is a rise in the general level of prices of goods and services in an economy over a period of time. When the general price level rises, each unit of currency buys fewer goods and services. Inflation affects sales revenue and borrowing of a firm through changes in nominal cash flows and the discount rate (Günsel and Çukur, 2007). Inflation affects the interest rate as well as the general economic confidence in a country. High inflation tends to force the interest rate higher to enable investors to still achieve a sufficient return on their investments. It consequently increases the cost of debt financing to firms. High interest rates, due to high inflation, normally reduces the domestic demand and consequently has an adverse effect on economic growth (Brigham and Daves, 2004). Dammon (1988) in muthama (2013) stated that inflation affects capital structure and firm value thus higher inflation forces investors to sell bonds in exchange for stocks and hence firms capital structure measured as debt-equity ratio, tends to drop
H7: Inflation will positively affect to capital structure.
Exchange rate
Exchange rate regarded as the value of one country’s currency in terms of another currency (O'Sullivan and Sheffrin, 2003). A country's exchange rate is determined by the demand and supply of its currency relative to the demand and supply of a foreign currency. The demand for a currency is mainly driven by foreign investments and the desire for foreign products and services. Exchange rate depreciation is the decrease in the price of the domestic currency in terms of a foreign currency, while exchange rate appreciation is an increase in the price of the domestic currency relative to the foreign currency. An exchange rate appreciation is often accompanied by an increase in capital inflows into the country.
422 422 Economic growth (GDP)
GDP or gross domestic product, is the market value of all final goods and services produced in a country in a given time period. Gross Domestic Product (GDP) growth rate was related to leverage ratio and economic growth tends to cause firms to use more debt consistent Booth et al (2001) in Muthama (2013).
H9: Inflation will positively affect to capital structure.
The hyphotesis model is as follows :
Internal Factors External Factors
Firm Size Interest Rate
Company Growth
Financial Risk
Assets Structure
Non-Debt Tax Shield
Capital Structure
Exchange Rate
Inflation Rate
Economy Growth (GDP)
This study used the verification analysis by interpreting a conclusion on the problem to be solved which would be followed by a hypothesis through data processing. It also used the descriptive analytical method, a method that interprets the data obtained with the facts that appear at the time of investigation in order to obtain a clear picture of the objects studied the internal and external factors of the company, capital structure and corporate value. The study began with a particular theory as the starting point of the thought. The data obtained during the study would be processed, analyzed on the basis of existing theories and studied.
Assumption of regression testing was performed using regression models and simultaneous panels which in the data regression approach consists of three kinds of approach of least squares (pooled least squares), fixed effects approach (fixed effect), and the random effects approach (random effect). The data was processed by using Eviews 6 version.
Model pooled least square (PLS) is a model obtained by combining or collecting all cross section data and time series data. This data model is then estimated using ordinary least squares, as follows:
where, i shows the cross-section unit (i = 1, ...., n) and t shows the time series (t = 1, ...., t). From the equation will be obtained parametersαandβare constant and efficient involving as many as n x t observations
While the fixed effect model (FEM) is used to overcome the problem of assuming the intercept and the slope of the regression equation is assumed to be constant in the PLS model. In this method a dummy variable (dummy variable) is used to generate parameter values vary both cross-unit and cross section over time (time series), and then the model estimated by OLS as follows:
The assumptions used in the method of error individually REM are not correlated with each other, as well as the error combination. The use of REM approach can save degrees of freedom and does not diminish in number as the FEM approach.
Result and Discussion
We divided limitations in this study into two categories. The first category was the point of view of corporates which are listed in capital market. The companies were not in the same industry, and the characteristic of their capital market were different, also the insufficient knowledge of the nature oftheir companies. The second category was macroeconomic factors such as politics, government financial fundamentals, economic policy, and exchange rate policy that were different one to another.
The result of the test in the confirmity factor analysis of overall modelis:
Table 1 : t Test and R2 Varibles
Indonesia Malaysia Philipine Singpore Thailand Vietname
Coef t Test Coef t Test Coef t Test Coef t Test Coef t Test Coef t Test
Firm Size (X1) 0.316407 0.0045* 0.333792 0.003* -0.32571 0.004* 0.323709 0.0043* 0.323884 0.0043* -2.12 0.0000
Company Growth (X2) -0.125 0.6543 -0.14822 0.0595** -0.1609 0.05691** -0.16238 0.5551 -0.16253 0.05536** -3.1 0.9347
Financial Risk (X3) -0.04106 0.8146 -0.04944 0.7912 -0.03534 0.8462 -0.04889 0.7955 -0.04815 0.7977 -2.36 0.3597
Assets Structure (X4) 0.57419 0.3466 0.456634 0.0179* 7.518043 0.04113* 4.014335 0.03808* 2.829397 0.355 2.2 0.8652
Non-Debt Tax Shield (X5) -4.08048 0.0768** -0.5245 0.0456* -28.209 0.4404 -14.1986 0.4373 -9.45863 0.4376 -9.49 0.8549
Interest rate (X6) -0.12174 0.2031 0.41166 0.8280 -0.29191 0.7894 0.22931 0.7735 0.06987 0.06529** -1.05 0.0000
Exchange Rate (X7) -3288.64 0.8641 -4.86819 0.9525 401.8768 0.7706 1.959042 0.7984 -71.6212 0.5937 2.27 0.0000
Inflation Rate (X8) -0.01804 0.0506** 0.154888 0.08051** -0.04997 0.8433 0.00373 0.09292** 0.00956 0.07362** -3.86 0.0000
Economy Growth (GDP)(X9) -0.00027 0.0397* 0.00028 0.8879 0.00268 0.7638 2.6505 0.06282** 0.0000 0.08639** -8.292 0.5661
Adjusted R2 0.567 0.457 0.488 0.574 0.426 0.409
Note : * Significant level 5%, ** Significant level 10%
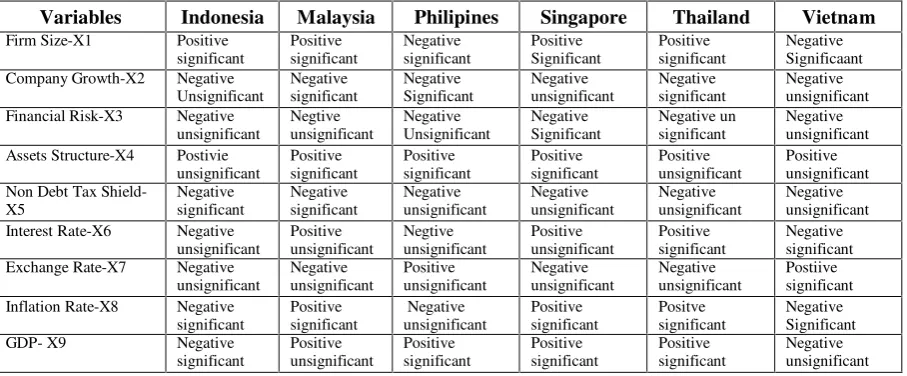
Table 2 : Result of Significants
Variables Indonesia Malaysia Philipines Singapore Thailand Vietnam Firm Size-X1 Positive
From the table above, the balance sheet effect may occur in :
Indonesia
424 424
factors would affect the microeconomic factors causing firm size to have a significant positive effect on capital structure, so that large companies tend to diversify utilizing high debt capacity and have the ability to repay it, so the debts would earn the trust of creditors to issue large amounts of debt according to Baskin (1989) and Ozkan (2001).
Malaysia
There were differences between internal factors and external factors to capital structure.It means all factors could influence balance sheet effect. Macro-economic policy did not influence micro-economic factors, because interest rate, inflation rate, foreign exhcange rate, and average economy growthwere stable during 2008-2011. According to Ting and Lean (2011), the evidence suggests that firm size, tangible assets, and profitability are the main factors determining a firm's capital structure in Malaysia.
Phillipines
The difference in the firm size changed from a significant positive influence of internal factors on the capital structure to a significant negative influence of internal and external factors on capital structure. This showed that the firm size is a factor to be considered in determining capital structure in the Philippines. Negative direction indicated that the study was in line with Kwok & Reeb (2000) and Frank and Goyal (2003).
Singapore
The research indicated that the economy growth and non-debt tax shield had changed from the negative influence of internal factors on capital structure to a negative and insignificant influence of internal and external factors on capital structure. These results indicated that the growth of the company was not the determining factor of capital structure. This study is in line with Kallapur & Trombley (1999), while the risk of significant negative did not become significantly negative. This was because the risk of the company became a decisive factor in capital structure. Hence, the company with high risk would be hard to get loans.
Thailand
The research showed that there are differences of the structure of assets and non-debt tax shield of significant to become insignificant. It indicated that the structure of assets and non-debt tax shield was not considered a factor in the determination of capital structure, although in the same time the direction was negative
Vietnam
The study showed a difference in the firm size to become a significant negative. This explained that the firm size became a considered factor in determining capital structure in Vietnam. Negative direction indicated that the study was in line with Kwok & Reeb (2000) and Frank and Goyal (2003).
Conclusion and Implication
Firm size factor is dominat in all ASEAN countries. Inflation rate is dominant in five countries. Company growth is dominant in four countries. The asset structure is dominant in three countries. Non-debt tax shield, interest rates and economy growth (GDP) are dominant in two countries, meanwhile the exchange rate is dominant in one country. The summary of the conclusion is as follows:
Table 2 : Dominat Variables on Capital Structure
Variables Indonesia Malaysia Philipines Singapore Thailand Vietnam
Firm Size X X X X X X
Company Growth X X X X
Financial Risk X
Assets Structure X X X
Non-Debt Tax Shield X X
Interest Rate X X
Exchange Rate X
Inflation Rate X X X X X
The implication of this research to the companies is that companies should consider macroeconomy in setting their capital structure to avoid negative balance sheet effect. Implication to the international investors is that they should consider significant variables on capital structure of each country.
References
Baskin, J. (1989), An Empirical Investigation of The Pecking Order Hypothesis,Journal of Finance, spring edition.
Brigham, Eugene F. and Daves Philip R. 2004. Intermediate Financial Management. Mason, Ohio: Thomson South Western.
Carmen, Cotei., Farhat, Joseph. 2009. The Trade-Off Theory and The Pecking Order Theory ; Are They Mutually Exclusive? North American Journal of Finance and Banking Research Vol. 3. No. 3. 2009.
Frank, M.Z., and Goyal, K, V (2003), Testing the pecking order theory of capital structure, Journal of Financial Economics 67, p 217-248
Ghazouani, Tarek. 2013. The Capital Structure through the Trade-Off Theory: Evidence from Tunisian Firm. International Journal of Economics and Financial Issues Vol. 3, No. 3, 2013, pp.625-636 ISSN: 2146-4138 www.econjournals.com.625
Günsel, Nil and Sadõk Çukur. 2007. The Effects of Macroeconomic Factors on the London Stock Returns: A Sectoral Approach. International Research Journal of Finance and Economics ISSN 1450-2887 Issue 10
Jibran, Sheikh., et al. 2012. Pecking at Pecking Order Theory: Evidence from Pakistan’s Non-financial Sector. Journal of Competitiveness. Vol. 4, Issue 4, pp. 86-95, December 2012 ISSN 1804-171X (Print), ISSN 1804-1728 (On-line), DOI: 10.7441/joc.2012.04.06
Julius, Adebiyi. 2012. Pecking Order Theory Of Capital Structure: Another Way To Look At It. Journal of Business Management and Applied Economics. Pecking Order Theory Of Capital Structure: Another Way To Look At Septemebr 5, 2012.
Kallapur, Sanjay., and Trombley, A, Mark., (1999), The Association Between Investment Opportunity Set
Proxies and Realized Growth, Journal of Business Finance & Accounting, Volume 26, Issue 3-4, pages 505–519, April/May 1999
Kwok, Chuck C. Y., Reeb, David M. (2000), Internationalization and Firm Risk: An Upstream-Downstream Hypothesis.(Statistical Data Included), Journal of International Business Studies, December 22, 2000.
Lim, Thian Cheng. 2012. Determinants of Capital Structure Empirical Evidence from financial Services Listed Firms in China. International Journal of Economics and Finance. 4 (3), pp: 191-203.
Muthama, Charles., Mbaluka, Peter, and Kalunda, Elizabeth. 2013. An Empirical Analysis of Macro-Economic Influences on Corporate Capital Structure of Listed Companies in Kenya. Journal of Finance and Investment Analysis, vol. 2, no.2, 2013, 41-62 ISSN: 2241-0998 (print version), 2241-0996(online) Scienpress Ltd, 2013 O'Sullivan, Arthur and Sheffrin, M Steven. 2003. Economics: Principles in action. New Jersey: Pearson Prentice Hall. Ozkan, A., 2001, Determinans of capital structure and adjustment to Long-run Target:Evidence from UK Company
Panel Data.Journal of Business Finance and Accounting, Vol. 28, pp.175-199
Shahar, Wan Shahdila Shah Shahar et.al. 2015. A review of Capital Strucuture Theories : Trade-off Theory, Pecking Order and Market Timing Theory. Proceeding of the 2nd International Conference on Management and Muamalah 2015 (2nd ICoMM). 16th–17th November 2015, e-ISBN: 978-967-0850-25-2. 240
Ting, Irene Wei Kiong Ting and Lean, Hooi Hooi Lean. 2011. Capital Structure of Governemnt-Linked Companies in Malaysia.Asian Academy of Management Journal of Accounting and Finance. AAMJAF, Vol. 7, No. 2, 137–156, 2011