42
Lampiran
Kurs USD
BI Rate
IHSG
Jan-07
9111,82
9,50%
1776,52
Feb-07
9112,85
9,25%
1772,35
Mar-07
9209,95
9,00%
1780,51
Apr-07
9142,90
9,00%
1948,46
Mei-07
8888,48
8,75%
2050,01
Jun-07
9028,55
8,50%
2119,17
Jul-07
9112,36
8,25%
2294,85
Agust-07
9413,55
8,25%
2152,85
Sep-07
9356,50
8,25%
2269,15
Okt-07
9152,71
8,25%
2556,94
Nop-07
9310,68
8,25%
2662,15
Des-07
9380,27
8,00%
2742,77
Jan-08
9453,3
8,00%
2640,93
Feb-08
9226,95
8,00%
2690,43
Mar-08
9230,83
8,00%
2475,91
Apr-08
9254,64
8,00%
2291,59
Mei-08
9337,3
8,25%
2425,98
Jun-08
9342,29
8,50%
2378,53
43
Agust-08
9195,1
9,00%
2134,43
Sep-08
9387,4
9,25%
1914,3
Okt-08
10098,65
9,50%
1376,22
Nop-08
11769,85
9,50%
1255,18
Des-08
11381,53
9,25%
1298,13
Jan-09
11223,11
8,75%
1367,83
Feb-09
11912,15
8,25%
1318,64
Mar-09
11908,8
7,75%
1343,93
Apr-09
11080,25
7,50%
1576,41
Mei-09
10449,11
7,25%
1837,88
Jun-09
10257,59
7,00%
2029,8
Jul-09
10161,86
6,75%
2133,45
Agust-09
10027,5
6,50%
2356,66
Sep-09
9950,39
6,50%
2394,59
Okt-09
9530
6,50%
2466,88
Nop-09
9517,2
6,50%
2424,32
Des-09
9504,85
6,50%
2492,65
Jan-10
9321,95
6,50%
2619,9
Feb-10
9395,11
6,50%
2548,58
Mar-10
9219,68
6,50%
2692,11
Apr-10
9072,33
6,50%
2895,43
44
Jun-10
9194
6,50%
2851,94
Jul-10
9094,45
6,50%
2977,06
Agust-10
9016,76
6,50%
3073,18
Sep-10
9020,84
6,50%
3335,58
Okt-10
8972,9
6,50%
3594,71
Nop-10
8983,29
6,50%
3670,61
Des-10
9067,62
6,50%
3667,8
Jan-11
9082,38
6,50%
3543,19
Feb-11
8957,11
6,75%
3449,74
Mar-11
8805,48
6,75%
3558,11
Apr-11
8694,3
6,75%
3749,2
Mei-11
8598,8
6,75%
3818,32
Jun-11
8607
6,75%
3805,4
Jul-11
8576,19
6,75%
4025,94
Agust-11
8574,79
6,75%
3936,35
Sep-11
8809,45
6,75%
3716,53
Okt-11
8939,67
6,50%
3600,4
Nop-11
9060,23
6,00%
3747,03
Des-11
8742,52
6,00%
3776,43
Jan-12
9154,76
6,00%
3930,84
Feb-12
9070,81
5,75%
3960,07
45
Apr-12
9221,5
5,75%
4162,22
Mei-12
9336,57
5,75%
4050,98
Jun-12
9498,14
5,75%
3850,55
Jul-12
9503,59
5,75%
4044,56
Agust-12
9547,16
5,75%
4114,76
Sep-12
9614,25
5,75%
4187,22
Okt-12
9645,14
5,75%
4309,68
Nop-12
9675,95
5,75%
4327,29
Des-12
9685,6
5,75%
4294,51
Jan-13
9735,57
5,75%
4403,12
Feb-13
9735,05
5,75%
4588,5
Mar-13
9758,11
5,75%
4823,16
Apr-13
9772,95
5,75%
4959,15
Mei-13
9809,91
5,75%
5100,44
Jun-13
9931
6,00%
4726,88
Jul-13
10123,7
6,50%
4631,38
Agust-13
10625,28
7,00%
4348,86
Sep-13
11402,95
7,25%
4353,64
Okt-13
11423,86
7,25%
4496,32
Nop-13
11652
7,50%
4359,72
46
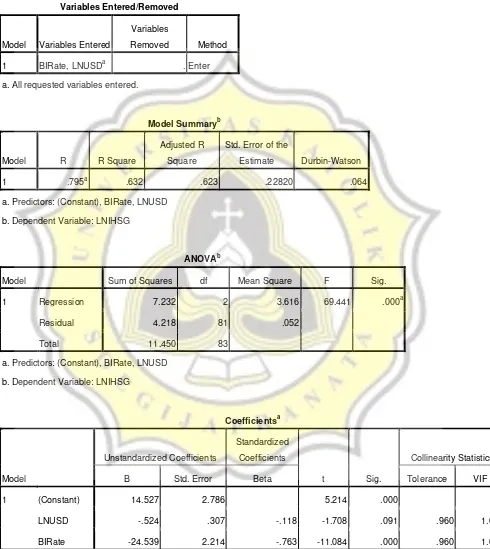
Tabel pengujian Asumsi Klasik dan uji Hipotesis dengan program SPSS
Variables Entered/Removed
Model Variables Entered
Variables
Removed Method
1 BIRate, LNUSDa . Enter
a. All requested variables entered.
Model Summaryb
Model R R Square
Adjusted R
Square
Std. Error of the
Estimate Durbin-Watson
1 .795a .632 .623 .22820 .064
a. Predictors: (Constant), BIRate, LNUSD
b. Dependent Variable: LNIHSG
ANOVAb
Model Sum of Squares df Mean Square F Sig.
1 Regression 7.232 2 3.616 69.441 .000a
Residual 4.218 81 .052
Total 11.450 83
a. Predictors: (Constant), BIRate, LNUSD
b. Dependent Variable: LNIHSG
Coefficientsa
Model
Unstandardized Coefficients
Standardized
Coefficients
t Sig.
Collinearity Statistics
B Std. Error Beta Tolerance VIF
1 (Constant) 14.527 2.786 5.214 .000
LNUSD -.524 .307 -.118 -1.708 .091 .960 1.042
BIRate -24.539 2.214 -.763 -11.084 .000 .960 1.042
47
Coefficient Correlationsa
Model BIRate LNUSD
1 Correlations BIRate 1.000 -.200
LNUSD -.200 1.000
Covariances BIRate 4.901 -.136
LNUSD -.136 .094
a. Dependent Variable: LNIHSG
Collinearity Diagnosticsa
Model
Dimensi
on Eigenvalue Condition Index
Variance Proportions
(Constant) LNUSD BIRate
1 1 2.983 1.000 .00 .00 .00
2 .017 13.300 .00 .00 .97
3 3.958E-5 274.541 1.00 1.00 .03
a. Dependent Variable: LNIHSG
Residuals Statisticsa
Minimum Maximum Mean Std. Deviation N
Predicted Value 7.2813 8.3381 7.9768 .29518 84
Residual -.50192 .60267 .00000 .22543 84
Std. Predicted Value -2.356 1.224 .000 1.000 84
Std. Residual -2.200 2.641 .000 .988 84
48
NPar Tests
One-Sample Kolmogorov-Smirnov Test
Unstandardized
Residual
N 84
Normal Parametersa,,b Mean .0000000
Std. Deviation .22543045
Most Extreme Differences Absolute .122
Positive .112
Negative -.122
Kolmogorov-Smirnov Z 1.117
Asymp. Sig. (2-tailed) .165
a. Test distribution is Normal.
b. Calculated from data.
Descriptive Statistics
N Minimum Maximum Mean Std. Deviation
Unstandardized Residual 84 -.50192 .60267 .0000000 .22543045
Valid N (listwise) 84
Variables Entered/Removed
Model Variables Entered
Variables
Removed Method
1 BIRate, LNUSDa . Enter
a. All requested variables entered.
Model Summaryb
Model R R Square
Adjusted R
Square
Std. Error of the
Estimate
1 .760a .577 .567 .44515
a. Predictors: (Constant), BIRate, LNUSD
49
ANOVAb
Model Sum of Squares df Mean Square F Sig.
1 Regression 21.906 2 10.953 55.275 .000a
Residual 16.051 81 .198
Total 37.957 83
a. Predictors: (Constant), BIRate, LNUSD
b. Dependent Variable: ABSZRES
Coefficientsa
Model
Unstandardized Coefficients
Standardized
Coefficients
t Sig. B Std. Error Beta
1 (Constant) -56.384 5.435 -10.375 .000
LNUSD 6.292 .599 .775 10.510 .000
BIRate -7.842 4.319 -.134 -1.816 .073
a. Dependent Variable: ABSZRES
Coefficient Correlationsa
Model BIRate LNUSD
1 Correlations BIRate 1.000 -.200
LNUSD -.200 1.000
Covariances BIRate 18.651 -.516
LNUSD -.516 .358
a. Dependent Variable: ABSZRES
Residuals Statisticsa
Minimum Maximum Mean Std. Deviation N
Predicted Value .0676 2.2005 .7323 .51374 84
Residual -1.19521 .74524 .00000 .43975 84
Std. Predicted Value -1.294 2.858 .000 1.000 84
50
Residuals Statisticsa
Minimum Maximum Mean Std. Deviation N
Predicted Value .0676 2.2005 .7323 .51374 84
Residual -1.19521 .74524 .00000 .43975 84
Std. Predicted Value -1.294 2.858 .000 1.000 84
Std. Residual -2.685 1.674 .000 .988 84
a. Dependent Variable: ABSZRES
Descriptive Statistics
N Minimum Maximum Mean Std. Deviation
Unstandardized Residual 84 -1.19521 .74524 .0000000 .43975232
Valid N (listwise) 84
Variables Entered/Removed
Model Variables Entered
Variables
Removed Method
1 BIRate, LNUSDa . Enter
a. All requested variables entered.
Model Summaryb
Model R R Square
Adjusted R
Square
Std. Error of the
Estimate
1 .441a .195 .175 .47979
a. Predictors: (Constant), BIRate, LNUSD
b. Dependent Variable: ABSZRES2
ANOVAb
Model Sum of Squares df Mean Square F Sig.
1 Regression 4.511 2 2.256 9.799 .000a
Residual 18.646 81 .230
Total 23.157 83
a. Predictors: (Constant), BIRate, LNUSD
51
Coefficientsa
Model
Unstandardized Coefficients
Standardized
Coefficients
t Sig. B Std. Error Beta
1 (Constant) -20.413 5.858 -3.485 .001
LNUSD 2.429 .645 .383 3.764 .000
BIRate -14.127 4.655 -.309 -3.035 .003
a. Dependent Variable: ABSZRES2
Coefficient Correlationsa
Model BIRate LNUSD
1 Correlations BIRate 1.000 -.200
LNUSD -.200 1.000
Covariances BIRate 21.666 -.600
LNUSD -.600 .416
a. Dependent Variable: ABSZRES2
Residuals Statisticsa
Minimum Maximum Mean Std. Deviation N
Predicted Value .3861 1.3671 .8440 .23314 84
Residual -1.03701 1.71009 .00000 .47397 84
Std. Predicted Value -1.964 2.244 .000 1.000 84
Std. Residual -2.161 3.564 .000 .988 84
a. Dependent Variable: ABSZRES2
Variables Entered/Removed
Model Variables Entered
Variables
Removed Method
52
Variables Entered/Removed
Model Variables Entered
Variables
Removed Method
1 BIRate, LNUSDa . Enter
a. All requested variables entered.
Model Summaryb
Model R R Square
Adjusted R
Square
Std. Error of the
Estimate
1 .441a .195 .175 .47979
a. Predictors: (Constant), BIRate, LNUSD
b. Dependent Variable: ABSZRES2
ANOVAb
Model Sum of Squares df Mean Square F Sig.
1 Regression 4.511 2 2.256 9.799 .000a
Residual 18.646 81 .230
Total 23.157 83
a. Predictors: (Constant), BIRate, LNUSD
b. Dependent Variable: ABSZRES2
Coefficientsa
Model
Unstandardized Coefficients
Standardized
Coefficients
t Sig. B Std. Error Beta
1 (Constant) -20.413 5.858 -3.485 .001
LNUSD 2.429 .645 .383 3.764 .000
BIRate -14.127 4.655 -.309 -3.035 .003
53
Coefficient Correlationsa
Model BIRate LNUSD
1 Correlations BIRate 1.000 -.200
LNUSD -.200 1.000
Covariances BIRate 21.666 -.600
LNUSD -.600 .416
a. Dependent Variable: ABSZRES2
Residuals Statisticsa
Minimum Maximum Mean Std. Deviation N
Predicted Value .3861 1.3671 .8440 .23314 84
Residual -1.03701 1.71009 .00000 .47397 84
Std. Predicted Value -1.964 2.244 .000 1.000 84
Std. Residual -2.161 3.564 .000 .988 84
a. Dependent Variable: ABSZRES2
Variables Entered/Removed
Model Variables Entered
Variables
Removed Method
1 BIRate, LNUSDa . Enter
a. All requested variables entered.
Model Summaryb
Model R R Square
Adjusted R
Square
Std. Error of the
Estimate
1 .314a .098 .076 .53915
a. Predictors: (Constant), BIRate, LNUSD
54
ANOVAb
Model Sum of Squares df Mean Square F Sig.
1 Regression 2.536 2 1.268 4.362 .016a
Residual 23.254 80 .291
Total 25.790 82
a. Predictors: (Constant), BIRate, LNUSD
b. Dependent Variable: ABSZRES3
Coefficientsa
Model
Unstandardized Coefficients
Standardized
Coefficients
t Sig. B Std. Error Beta
1 (Constant) -6.472 6.798 -.952 .344
LNUSD .903 .747 .130 1.209 .230
BIRate -15.130 5.322 -.305 -2.843 .006
a. Dependent Variable: ABSZRES3
Coefficient Correlationsa
Model BIRate LNUSD
1 Correlations BIRate 1.000 -.146
LNUSD -.146 1.000
Covariances BIRate 28.326 -.582
LNUSD -.582 .558
a. Dependent Variable: ABSZRES3
Residuals Statisticsa
Minimum Maximum Mean Std. Deviation N
Predicted Value .3210 .9550 .7297 .17586 83
Residual -.75783 1.45509 .00000 .53253 83
Std. Predicted Value -2.324 1.281 .000 1.000 83
Std. Residual -1.406 2.699 .000 .988 83
55
NPar Tests
One-Sample Kolmogorov-Smirnov Test
Unstandardized
Residual
N 83
Normal Parametersa,,b Mean .0000000
Std. Deviation .53253281
Most Extreme Differences Absolute .085
Positive .085
Negative -.077
Kolmogorov-Smirnov Z .779
Asymp. Sig. (2-tailed) .579
a. Test distribution is Normal.
b. Calculated from data.
Descriptives
Descriptive Statistics
N Minimum Maximum Mean Std. Deviation
Unstandardized Residual 83 -.75783 1.45509 .0000000 .53253281
Valid N (listwise) 83
Regression
Variables Entered/Removed
Model Variables Entered
Variables
Removed Method
1 BIRate, LNUSDa . Enter
56
Model Summaryb
Model R R Square
Adjusted R
Square
Std. Error of the
Estimate
1 .267a .071 .048 .57798
a. Predictors: (Constant), BIRate, LNUSD
b. Dependent Variable: ABSZRES4
ANOVAb
Model Sum of Squares df Mean Square F Sig.
1 Regression 2.044 2 1.022 3.059 .052a
Residual 26.725 80 .334
Total 28.769 82
a. Predictors: (Constant), BIRate, LNUSD
b. Dependent Variable: ABSZRES4
Coefficientsa
Model
Unstandardized Coefficients
Standardized
Coefficients
t Sig. B Std. Error Beta
1 (Constant) -12.878 7.288 -1.767 .081
LNUSD 1.571 .801 .214 1.962 .053
BIRate -10.135 5.706 -.194 -1.776 .079
a. Dependent Variable: ABSZRES4
Coefficient Correlationsa
Model BIRate LNUSD
1 Correlations BIRate 1.000 -.146
LNUSD -.146 1.000
Covariances BIRate 32.554 -.669
LNUSD -.669 .641
57
Residuals Statisticsa
Minimum Maximum Mean Std. Deviation N
Predicted Value .4818 1.1363 .8008 .15786 83
Residual -1.05542 2.06697 .00000 .57089 83
Std. Predicted Value -2.021 2.125 .000 1.000 83
Std. Residual -1.826 3.576 .000 .988 83
a. Dependent Variable: ABSZRES4
NPar Tests
One-Sample Kolmogorov-Smirnov Test
Unstandardized
Residual
N 83
Normal Parametersa,,b Mean .0000000
Std. Deviation .57089160
Most Extreme Differences Absolute .094
Positive .094
Negative -.057
Kolmogorov-Smirnov Z .859
Asymp. Sig. (2-tailed) .451
a. Test distribution is Normal.
b. Calculated from data.
Regression
Variables Entered/Removed
Model Variables Entered
Variables
Removed Method
1 BIRate, LNUSDa . Enter
58
Model Summaryb
Model R R Square
Adjusted R
Square
Std. Error of the
Estimate Durbin-Watson
1 .267a .071 .048 .57798 1.456
a. Predictors: (Constant), BIRate, LNUSD
b. Dependent Variable: ABSZRES4
ANOVAb
Model Sum of Squares df Mean Square F Sig.
1 Regression 2.044 2 1.022 3.059 .052a
Residual 26.725 80 .334
Total 28.769 82
a. Predictors: (Constant), BIRate, LNUSD
b. Dependent Variable: ABSZRES4
Coefficientsa
Model
Unstandardized Coefficients
Standardized
Coefficients
t Sig.
Collinearity Statistics
B Std. Error Beta Tolerance VIF
1 (Constant) -12.878 7.288 -1.767 .081
LNUSD 1.571 .801 .214 1.962 .053 .979 1.022
BIRate -10.135 5.706 -.194 -1.776 .079 .979 1.022
a. Dependent Variable: ABSZRES4
Coefficient Correlationsa
Model BIRate LNUSD
1 Correlations BIRate 1.000 -.146
LNUSD -.146 1.000
Covariances BIRate 32.554 -.669
LNUSD -.669 .641
59
Collinearity Diagnosticsa
Model
Dimensi
on Eigenvalue Condition Index
Variance Proportions
(Constant) LNUSD BIRate
1 1 2.984 1.000 .00 .00 .00
2 .016 13.501 .00 .00 .98
3 3.767E-5 281.444 1.00 1.00 .01
a. Dependent Variable: ABSZRES4
Residuals Statisticsa
Minimum Maximum Mean Std. Deviation N
Predicted Value .4818 1.1363 .8008 .15786 83
Residual -1.05542 2.06697 .00000 .57089 83
Std. Predicted Value -2.021 2.125 .000 1.000 83
Std. Residual -1.826 3.576 .000 .988 83
a. Dependent Variable: ABSZRES4
Regression
Variables Entered/Removed
Model Variables Entered
Variables
Removed Method
1 BIRate, LNUSDa . Enter
a. All requested variables entered.
Model Summary
Model R R Square
Adjusted R
Square
Std. Error of the
Estimate
1 .795a .632 .623 .22820
60
ANOVAb
Model Sum of Squares df Mean Square F Sig.
1 Regression 7.232 2 3.616 69.441 .000a
Residual 4.218 81 .052
Total 11.450 83
a. Predictors: (Constant), BIRate, LNUSD
b. Dependent Variable: LNIHSG
Coefficientsa
Model
Unstandardized Coefficients
Standardized
Coefficients
t Sig. B Std. Error Beta
1 (Constant) 14.527 2.786 5.214 .000
LNUSD -.524 .307 -.118 -1.708 .091
BIRate -24.539 2.214 -.763 -11.084 .000
a. Dependent Variable: LNIHSG
Coefficient Correlationsa
Model BIRate LNUSD
1 Correlations BIRate 1.000 -.200
LNUSD -.200 1.000
Covariances BIRate 4.901 -.136
LNUSD -.136 .094
a. Dependent Variable: LNIHSG
Regression
Variables Entered/Removed
Model Variables Entered
Variables
Removed Method
1 BIRate, LNUSDa . Enter
61
Model Summaryb
Model R R Square
Adjusted R
Square
Std. Error of the
Estimate Durbin-Watson
1 .781a .609 .599 .22896 .065
a. Predictors: (Constant), BIRate, LNUSD
b. Dependent Variable: LNIHSG
ANOVAb
Model Sum of Squares df Mean Square F Sig.
1 Regression 6.539 2 3.269 62.370 .000a
Residual 4.194 80 .052
Total 10.733 82
a. Predictors: (Constant), BIRate, LNUSD
b. Dependent Variable: LNIHSG
Coefficientsa
Model
Unstandardized Coefficients
Standardized
Coefficients
t Sig.
Collinearity Statistics
B Std. Error Beta Tolerance VIF
1 (Constant) 14.035 2.887 4.861 .000
LNUSD -.473 .317 -.105 -1.490 .140 .979 1.022
BIRate -24.255 2.260 -.758 -10.731 .000 .979 1.022
a. Dependent Variable: LNIHSG
Coefficient Correlationsa
Model BIRate LNUSD
1 Correlations BIRate 1.000 -.146
LNUSD -.146 1.000
Covariances BIRate 5.108 -.105
LNUSD -.105 .101
62
Collinearity Diagnosticsa
Model
Dimensi
on Eigenvalue Condition Index
Variance Proportions
(Constant) LNUSD BIRate
1 1 2.984 1.000 .00 .00 .00
2 .016 13.501 .00 .00 .98
3 3.767E-5 281.444 1.00 1.00 .01
a. Dependent Variable: LNIHSG
Residuals Statisticsa
Minimum Maximum Mean Std. Deviation N
Predicted Value 7.3731 8.3334 7.9870 .28239 83
Residual -.51700 .58943 .00000 .22615 83
Std. Predicted Value -2.174 1.227 .000 1.000 83
Std. Residual -2.258 2.574 .000 .988 83
a. Dependent Variable: LNIHSG
Descriptives
Descriptive Statistics
N Minimum Maximum Mean Std. Deviation
LNUSD 83 9.06 9.40 9.1641 .08060
BIRate 83 .0575 .0950 .070783 .0113086
Valid N (listwise) 83
Descriptives
Descriptive Statistics
N Minimum Maximum Mean Std. Deviation
IHSG 84 1255 5100 3103.18 1044.915
Kurs USD 84 8574 12147 9606.05 846.975
BI Rate 84 .0575 .0950 .071071 .0115467