Journal of Electrical Technology UMY (JET-UMY), Vol. 1, No. 2, June 2017 ISSN 2550-1186 e-ISSN 2580-6823
Development of User Interface Based on LabVIEW for
Unmanned Aircraft Application
Faaris Mujaahid*, Amir Malik Hizbullah, Febrian Dhimas Syahfitra, Muhammad Abduh Dahlan, Nugroho Dwi Juliansyah
Department of Electrical Engineering, Faculty of Engineering Universitas Muhammadiyah Yogyakarta
Kampus Terpadu UMY, Jl. Lingkar Selatan, Kasihan Bantul, Yogyakarta 55183, Indonesia *Corresponding author, e-mail: [email protected]
Abstract – This paper describes the user interface construction of rocket/aircraft condition monitoring systems on LabVIEW, a graphical-based programming language. The interface, placed in the ground station, has some important information transmitted from the rocket. The information contains real-time data from the sensor devices. The aim of the construction of this interface is that the operator in the ground station can monitor the behavior and the condition of the flying rocket, in regard to the self-control mechanism programmed within the rocket. The LabVIEW front panel includes the visualization of 3D rocket motion, accelerometer-graph, gyroscope-graph, rocket navigation, GPS positioning, altitude, and pressure-meter. The result proved that the data transmission was recorded properly to the front panel system and logbook. In addition to the result, the reliability test has 50% probability to the system performance with the given test period of 300 seconds and 600 seconds. The low reliability result might be caused by the size of buffer overflow between the hardware and LabVIEW.
Copyright © 2017 Universitas Muhammadiyah Yogyakarta- All rights reserved.
Keywords: User Interface, Condition monitoring, LabVIEW, Rocket
I. Introduction
An aircraft vehicle, whether it is manned or unmanned model, demands a very high standard operational requirement for safety and reliability. Especially for unmanned aircraft, such as rocket, drone, and quadcopter. If the autopilot system is not properly controlled, they could easily harm its surrounding within the striking distance. Therefore, constructing an aircraft vehicle involves plenty of procedures to design, merely to assure that the aircraft is fully under control by the operator. Especially nowadays, where the safety becomes increasingly urgent. The emerging sciences and technologies such as control system, aerodynamic, signal processing, sensor technology, and artificial intelligence are very much exploited to improve the system reliability [1].
Due to its advanced technology, aircraft and
space vehicles become one of the parameters to measure the technology and science level of the country, including Indonesia. The Indonesian government is aware that the aircraft and space research development will make a significant impact on science and economic sector. Through the government space agency, LAPAN (National Institute of Aeronautics and Space) and the Ministry of Research, Technology and Higher Education, they organize an annual event called KOMURINDO (Indonesian Payload Rocket Competition) to enhance the rocket research in the higher education level, such as university and polytechnic. Since 2008, this event has been held for ten times and each year the competition becomes more competitive [2, 3].
F. Mujaahid, A. M. Hizbullah, F. D. Syahfitra, M. A. Dahlan, N. D. Juliansyah
time to reach the target. Besides, the assessment also includes the user interface, hardware design, communication system, and rocket’s launcher.
According to Camilo Jimenez et al in 2016, the user interface is regarded as important for the aircraft system [4]. Because it elevates the flying experience of the operator and provides crucial information that assists the operator to maintain the aircraft control.
Few works have been done to develop the user interface of condition monitoring system for an unmanned aircraft application. Sudesh Mukhami from his work in 2013 merged the existing Simian simulator on a C# platform and extended the functionality [5]. The C# text-based platform has been widely used in the academic level for prototyping purpose. User interface developed by MATLAB platform has also been designed by Kalra et al, as reported in their paper in 2014 [6]. The graphical user interface was designed to examine the motion shifting concerning to the aircraft’s position and direction.
The scope of this paper demonstrates the design of the autonomous rocket’s user interface developed by LabVIEW, a graphical-based programming tools. The user interface is meant for condition and monitoring system on the ground station. Unlike the text-based programming, the use of the graphical-based platform is still limited in this application and therefore has more gap to develop and explore.
II. Design Methodology
Construction of the autonomous rocket is divided into five parts; the electronics design, the rocket transceiver and communication system, the rocket control system, the user interface of the ground station, and the mechanical design of the rocket body and the launcher. Due to the scope of this paper, the content is limited to the user interface system developed by LabVIEW. In addition, the rocket electronics design will be briefly described in this chapter.
II.1. Rocket Electronics and EDF Motor
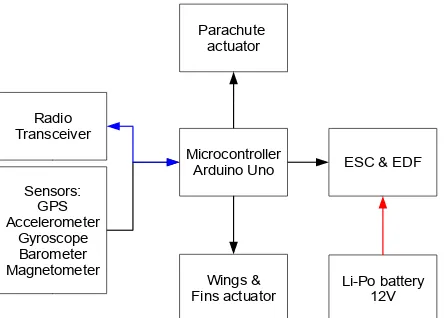
The rocket is developed by using sensors that can detect the change of its position and condition. As shown in Fig. 1, the sensors installed in the rocket are Global Positioning System (GPS) to track the real-time position, an accelerometer to measure the acceleration, a gyroscope to maintain the orientation, a barometer to measure the atmospheric
pressure and rocket altitude, and magnetometer to properly determine the rocket’s direction.
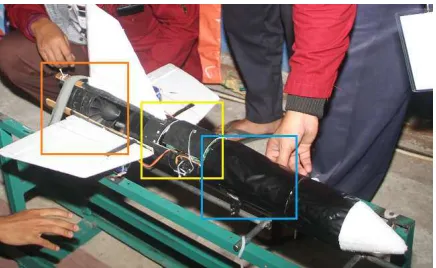
The data collected by each sensor, then transmitted directly to the Arduino microcontroller for further process. Furthermore, the microcontroller performs an additional action to make a simpler form of the raw data and merges them together into one packet ready to be sent to the ground station. The parachute actuator, wings/fins actuators, and the Electric Speed Controller (ESC) are driven by the microcontroller based on the automatic or manual instructions from the ground station. ESC is an electronic device with a built-in program responsible for the EDF motor speed control. This device can be controlled via the microcontroller. The location of the electronic and mechanical parts in the rocket is depicted in Fig. 2.
Electric Ducted Fan (EDF) rocket is one type of rocket that uses electrical motor propeller mounted within a cylindrical duct as its main actuator. It is widely used in the academic and research stage because of its low cost and versatility. The motor’s power is supplied by an external Lithium Polymer (Li-Po) battery. In order that the EDF can lift the rocket and control the stability, it should have the thrust-weight ratio ranging between 1:1 to 2:1. The rocket’s weight is 1.2 kg. Therefore, the EDF thrust should be between 1.2 to 2.4 kg. The 2:1 ratio is also regulated in the competition requirements as the EDF maximum ratio. The specifications of EDF motor used in the system is stated in Table 1.
Fig. 1. Block diagram of electronics and EDF assembled in the rocket. The red line indicates the power line, the
blue line indicates the transceiver/receiver communication system, and the black line indicates the
F. Mujaahid, A. M. Hizbullah, F. D. Syahfitra, M. A. Dahlan, N. D. Juliansyah
Fig. 2. Location of electronics and mechanical parts in the rocket. From left to right; (orange) EDF motor.
(yellow) Parachute and Li- Po battery. (blue) ESC, sensors, and radio transceiver.
TABLE1 EDF SPECIFICATIONS [7]
Item Values Unit Type Dr. Mad Thrust 90mm - Rotor diameter 92 Mm Constructions Aluminum alloy -
Weight 640 Gr
LabVIEW stands for Laboratory Virtual Instrument Engineering Workbench, is a visual-programming language developed by National Instruments. In our work, LabVIEW is used for the user interface of the system in the ground station and emergency panel in case of the uncontrolled rocket. Besides, it also has the function of the monitoring system. We use professional version 2013 with Virtual Instrument Software Architecture (VISA) installed for hardware-software communication interface. This platform enables the flowchart to be graphically programmed on the computer screen [8]. LabVIEW also facilitates plenty of powerful features that require hardware interaction in the system. This functionality is needed in our research; data acquisition and serial communication from and to the hardware in the ground station [9].
The program consists of two sections; front panel and block diagram. The first section contains the controls and indicators. This is the display of the graphical interface, where the operator can interact with the running program to give the command or
get the results. Front panel’s controls and indicators correspond to the block diagram. The latter is the section where coding runs behind the user interface. It contains the functions, structures, data process, and wires that connect the data [10]. Fig. 3 shows the final design of front panel in our report. For explanation purpose, the front panels are divided into three parts; left, middle, and right. Each part contains specific controls/indicators related to the block diagram. Table 2 describes the function of each control/indicator.
TABLE2
EXPLANATION OF CONTROLS/INDICATORS ON FRONT PANEL
Panel Function Left:
Com-port Select the serial port that connects to the external hardware (control) Save Select the file from the directory to
save the collected raw data. By default, the file is data.txt (c) Start Engine Turn on the EDF motor (c) End Program End the program (c)
Filtered-buffer Contain the post-processing data by filtering the Original-buffer
(indicator)
Original-buffer Contain the raw data that is directly transmitted from the hardware (i) Failed-buffer Contain the raw data that causes the
program failures (i)
Emergency Turn off the EDF and deploy the parachute (c)
Middle:
3D image Display the rocket orientation in 3D format (i)
CompX/Y/Z Display the compass three-axis value in numeric format (i) Head_degree Display the rocket heading
direction in numeric format (i) Longitude Display the horizontal coordinate
(longitude) in numeric format (i) Latitude Display the vertical coordinate
(latitude) in numeric format (i) Pressure Display the pressure in numeric
format (i)
Altitude Display the rocket altitude, measured above the sea level in numeric format (i)
Temp Display the temperature in numeric format (i)
Right:
Gyro orientation Display the three-axis gyroscope graph (i)
Accelerometer Display the three-axis accelerometer graph (i)
F. Mujaahid, A. M. Hizbullah, F. D. Syahfitra, M. A. Dahlan, N. D. Juliansyah
Fig. 3. Front panel interface developed in LabVIEW
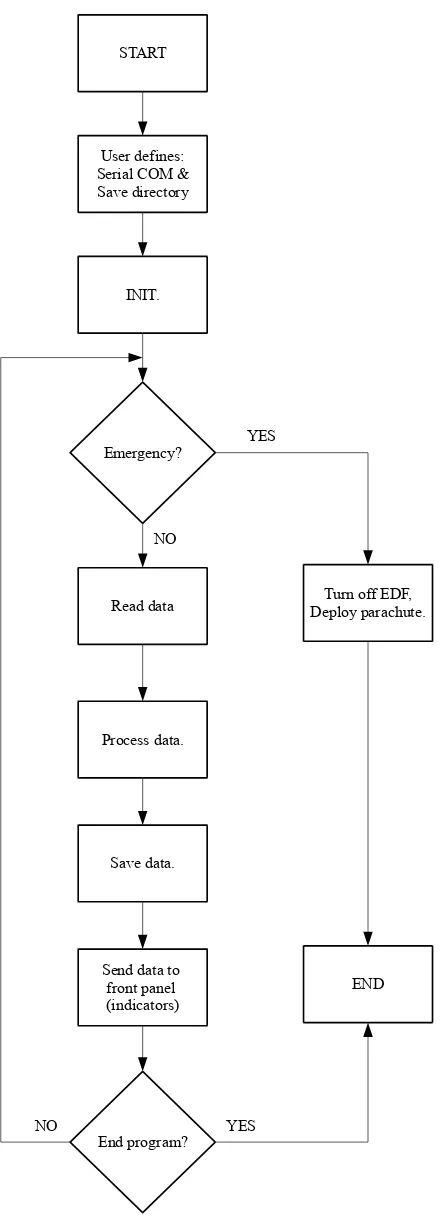
The graphical coding cannot be shown in this paper due to the extensive space required to display. However, it may be personally requested through the corresponding email. The flowchart in Fig. 4 describes the steps and decisions process in sequential order built on the block diagram.
First, after the program is running, the operator needs to specify the serial port channel from the drop-down menu. Followed by selecting the directory to enable the autosave mechanism. These two operator dependent steps are mandatory to begin with the data acquisition process.
Second, the initialization (INIT.) starts and configures VISA. The configuration includes the baudrate setting 57600, data bits 8, and parity none. At the same time, the program gives the command to hardware to send its data to be continuously read.
Third, the next step is to check whether the emergency button is pressed or not. Unless the button is triggered, the program continues to read the buffered data. Otherwise, the program will turn off the EDF and deploy the parachute.
Fourth, the program runs four consecutive steps. It begins with reading the continuous data from the sensors. Followed by processing the data and saving into the designated directory. Then, the data is split into 15 parts. These parts match the sensor indicators displayed on the front panel. They are temperature, pressure, altitude, accelerometer axis X/Y/Z, longitude, latitude, compass axis Z/Y/Z, gyroscope axis X/Y/Z, and head degree.
Fifth or the last step, wait for the operator to end the program. As long as the operator does not press the End Program button, the decision to end the program is neglected and bypassed. Thus, the program keeps running from the third step (emergency check) to the fourth step (front panel display) continuously.
START
User defines: Serial COM & Save directory
INIT.
Read data Emergency?
Turn off EDF, Deploy parachute.
Process data.
Save data.
Send data to front panel (indicators)
End program?
END YES
NO
YES NO
F. Mujaahid, A. M. Hizbullah, F. D. Syahfitra, M. A. Dahlan, N. D. Juliansyah
III. Results and Discussion
The programming test procedure was carried out by using two approaches. The first was checking the quality of data transmission. The second was testing its reliability by means of the maximum time it could perform consistently. Fig. 5 and Table 3 showed respectively the test results on data transmission and reliability.
III.1. Data Transmission
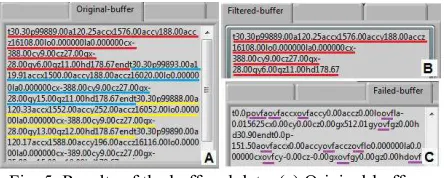
Data buffer was logged for each cycle the data is transmitted to LabVIEW. Each cycle, the program often, but not limited, read approximately 200 to 300 string characters. These characters were logged in the front panel indicator named Original-buffer, see Fig. 5 (a). Then, the entire data was filtered. The filter selected the first packet to be processed to check if there was any unwanted data. The filtered data was passed on to the front panel as shown in Fig. 5 (b). This is as depicted in Fig.5 (b)
Filtered-buffer that represents the first packet of Fig. 5 (a) Original-buffer, highlighted in red. In case the data buffer contained the unwanted data, the entire data was passed on to the front panel named Failed-buffer, see Fig. 5 (c).
Fig. 5. Results of the buffered data. (a) Original-buffer, the raw data received from the hardware. (b) Filtered-buffer, after the Original-buffer is processed. (c)
Failed-buffer, the corrupted data received from the hardware that may cause the program to behave abruptly.
TABLE3 RELIABILITY TEST RESULTS Trial
Number (seconds) Time Pass/Fail 1 300 Pass
2 95 Fail, due to ovf 3 37 Fail, unknown 4 300 Pass
5 113 Fail, due to ovf
6 65 Fail, due to nan
7 600 Pass 8 600 Pass
9 74 Fail, due to ovf
10 600 Pass
The unwanted data refers to all the letter characters that are not supposed to be included in the data transmission packet. From the test results,
ovf and nan can halt the programming. However, buffer data was properly read by the program and displayed on the front panel.
III.2. Reliability Test
The purpose of this test was to measure the program consistency and reliability. In total, 10 trials were conducted with 300 seconds for the first half trials and 600 seconds for another half trials. Table 3 shows that trial number 2, 3, 5, 6, and 9 failed to run the program until the end due to three
ovf, one nan, and one unknown issue. The other five trials were successful. It is obvious that the program is not reliable yet for the system. According to the test, the program only has 50% probability of success.
The issue with this reliability test might be caused by the overflow data transmitted from the hardware buffer to LabVIEW. The buffer size difference between the hardware and LabVIEW is likely affecting the data buffer. However, the authors are not certainly sure about this issue and suggest that further research should be done to enhance the reliability.
IV. Conclusion
Based on the test results, it may be concluded that a user interface for rocket condition monitoring system can be built simply and less time-consuming by LabVIEW. The result showed that the real-time sensor data was correctly displayed on the front panel. The program is functionally proven despite the issue of the reliability test. In the future work, indeed the program should be improved further. Especially the overflow buffer that needs to be investigated more thoroughly.
ACKNOWLEDGEMENTS
F. Mujaahid, A. M. Hizbullah, F. D. Syahfitra, M. A. Dahlan, N. D. Juliansyah
References
[1] Zhang, Y., Wu, J., Huang, M., Zhu, H., Chen, Q. (1998). Liquid-Propellant Rocket Engine Health-Monitoring Techniques. Journal of Propulsion and Power. 14 (5). 657-663.
[2] Wiyagi, R. O., Danardono, Agus, T. A. (2017). High Altitude Balloon Payload Design for Atmospheric Observations. Journal of Electrical Technology UMY (JET-UMY), 1(1). 50-57.
[3] LAPAN. (2015). Komurindo dan Kombat 2015 Sukses Dilaksanakan. LAPAN, Deputy of Space Science and Atmosphere. Access date: 21 June 2017.
[4] Jimenez, C., Faerevaag, C. L., Jentsch, F. (2016). User Interface Design Recommendation for Small Unmanned Aircraft Systems (sUAS). International Journal of Aviation, Aeronautics, and Aerospace. 3
(2).
[5] Sudesh, M. (2013). An Unmanned Air Vehicle Simulator in C#, M.Sc. theses, Dept. Computer Science, North Dakota State University of Agriculture and Applied Science, North Dakota. [6] Kalra, A., Anand, P., Singh, S. (2014). Flight
Simulation Using Graphical User Interface.
Advances in Aerospace Science and Applications. 4
(1). 85-90.
[7] HobbyKing. Dr. Mad Thrust 90mm Blade Alloy EDF 1400kv – 2500w (6S). Access date: 10 July 2017.
[8] National Instruments. Advantages of LabVIEW in Academic Research. Access date: 10 July 2017. [9] Tasner, T., Lovrec, D., Tasner, F., Edler, E. (2012).
Comparison of LabVIEW and MATLAB for Scientific Research. Annals of Faculty Engineering Hunedoara -International Journal of Engineering. 389-394.
[10] National Instruments. (2013). Getting Started with LabVIEW. Access date: 10 July 2017.
Authors’ information
Faaris Mujaahid hold a bachelor
degree in 2010 from Electrical and Electronics Engineering Department, Saxion University of Applied Sciences, the Netherlands. He received a master degree in Sustainable Energy Technologies in 2016 from University of Southampton, UK.
ing. Faaris Mujaahid, M.Sc is currently a lecturer in the Department of Electrical Engineering, Faculty of Engineering, Universitas Muhammadiyah Yogyakarta, Indonesia. His main research interest is in LabVIEW and renewable energy (mainly in solar cell material and fabrication technologies).
Amir Malik Hizbullah Was a third-year
student in the Department of Electrical Engineering Universitas Muhammadiyah Yogyakarta at the time of this project. His research interest is in embedded system and electronics.
Febrian Dhimas Syahfitra Was a
third-year student in the Department of Electrical Engineering Universitas Muhammadiyah Yogyakarta at the time of this project. His research interest is in electrical power.
Muhammad Abduh Dahlan Was a
second-year student in the Department of Electrical Engineering Universitas Muhammadiyah Yogyakarta at the time of this project. His research interest is in electrical power.
Nugroho Dwi Juliansyah Was a