PRECISION AND DEVIATION COMPARISON BETWEEN ICESAT AND ENVISAT IN
TYPICAL ICE GAINING AND LOSING REGIONS OF ANTARCTICA
Wenjia Du a, b, Lei Chen a, b, Huan Xie a, b*, Gang Hai a, b, Shanshan Zhang a, b, Xiaohua Tong a, b
a
College of Surveying and Geo-Informatics, Tongji University, 1239 Siping Road, Shanghai, China - (1253507, 103495chen, huanxie, ganghai, 1633316, xhtong)@tongji.edu.cn
b
Center for Spatial Information Science and Sustainable Development, Tongji University, 1239 Siping Road, Shanghai, China
Commission VIII, WG VIII/6
KEY WORDS: ICESat, Envisat , precision , deviation, Antarctica
ABSTRACT:
This paper analyzes the precision and deviation of elevations acquired from Envisat and The Ice, Cloud and Land Elevation Satellite (ICESat) over typical ice gaining and losing regions, i.e. Lambert-Amery System (LAS) in east Antarctica, and Amundsen Sea Sector (ASS) in west Antarctica, during the same period from 2003 to 2008. We used GLA12 dataset of ICESat and Level 2 data of Envisat. Data preprocessing includes data filtering, projection transformation and track classification. Meanwhile, the slope correction is applied to Envisat data and saturation correction for ICESat data. Then the crossover analysis was used to obtain the crossing points of the ICESat tracks, Envisat tracks and ICESat-Envisat tracks separately. The two tracks we chose for cross-over analysis should be in the same campaign for ICESat (within 33 days) or the same cycle for Envisat (within 35 days).The standard deviation of a set of elevation residuals at time-coincident crossovers is calculated as the precision of each satellite while the mean value is calculated as the deviation of ICESat-Envisat. Generally, the ICESat laser altimeter gets a better precision than the Envisat radar altimeter. For Amundsen Sea Sector, the ICESat precision is found to vary from 8.9 cm to 17 cm and the Envisat precision varies from 0.81 m to 1.57 m. For LAS area, the ICESat precision is found to vary from 6.7 cm to 14.3 cm and the Envisat precision varies from 0.46 m to 0.81 m. Comparison result between Envisat and ICESat elevations shows a mean difference of 0.43 ±7.14 m for Amundsen Sea Sector and 0.53 ± 1.23m over LAS.
1. INTRODUCTION
Antarctic ice sheet is one of the most sensitive and important areas which contributes significantly to changes of the global sea level (Bamber et al., 2009; Cazenave et al., 2010; Shepherd et al., 2012; Vaugham et al., 2013). There are three widely used methods for monitoring Antarctica ice sheet: gravity satellite, altimeter and Input-output(Rignot et al., 2008; Shepherd et al., 2012; Gunter et al., 2014; Zwally et al., 2015). Satellite altimetry has proven to be a valuable tool in studying ice sheet mass balance changes over the past 30 years, for its well data quality and high resolution (Shepherd et al., 2012).
While the radar altimetry covers the longest time series, the laser altimetry is available solely from ICESat mission (Davis et al., 2004; Zwally et al., 2015; Sørensen et al., 2015). Since 1991, Greenland and Antarctica to 81.5°south had been covered continuously by the European Space Agency (ESA) radar altimeters on the European Remote Sensing Satellites (Féménias, P. et al., 1993; Anita C. Brenner et al., 2007; Aurélie Michel et al., 2014). The ENVISAT was launched in 2002 by the ESA to link up with ERS-1 and ERS-2. It worked for eight years and successfully provided great large measurements and currently, followed by CryoSat-2 (Rémy et al., 2009; Sørensen et al., 2015). The Ice Cloud and Land Elevation Satellite (ICESat) was launched by the National Aeronautics and Space Administration (NASA), which operated from 2003 to 2009, and worked two to three campaigns (approximately 30 days) per year, carrying the Geoscience Laser Altimeter System (GLAS)
________________________________ * Corresponding author
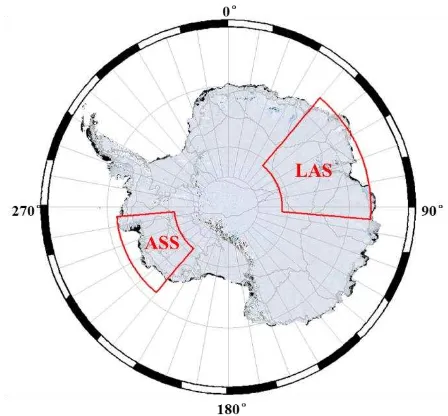
Figure 1.Antarctic ice sheet and its sub-regions, the LAS and ASS.
instrument (Abshire et al., 2005; Zwally et al., 2002; Sørensen et al., 2015). Because of the longer wavelength of the radar instrument, the signal might penetrate into the snow pack, while the laser signal is reflected from the air–snow interface and get a more accurate result (Arthern et al., 2001; Ridley and Partington, 1988; Sørensen et al., 2015). Brenner et al. used the data retrieved from the ICESat, ERS-2 and Envisat over the Greenland and Antarctic ice sheets to calculate their precision.
The International Archives of the Photogrammetry, Remote Sensing and Spatial Information Sciences, Volume XLII-2/W7, 2017 ISPRS Geospatial Week 2017, 18–22 September 2017, Wuhan, China
This contribution has been peer-reviewed.
The laser precision is found to vary from 14 to 59 cm, and the radar precision varies from 59 cm to 3.7 m for ERS-2 and from 28 cm to 2.06 m for Envisat (Anita C. Brenner et al., 2007). This paper analyzes the precision and deviation of elevations received from Envisat and ICESat over typical ice gaining area, the LAS and losing regions, the ASS and analyzes the factors influenced them(the location of the regions showed in Fig.1).
2. DATA AND METHODS
2.1 ICESat Data and Processing
We chosed newly released ICESat GLA12 dataset (R634) - Antarctic and Greenland ice sheet altimetry data (ftp://n5eil01u.ecs.nsidc.org/SAN/GLAS/GLA12.034/).This dataset has recently been updated due to the error (called the Gaussian-centroid or “G-C” offset) in the range determination from the transmit-pulse reference-point selection. This product has 18 campaigns from January 2003 to October 2009 and the time period is listed in Table 1 (Shutz et al., 2005). Campaign 17 lost a large part of data and Campaign 18 was not completed responding to a sensor problem. In accordance with its data acquisition plan, the data from these last two campaigns were excluded from this study (Schutz et al., 2005). For the ICESat data, we performed data preprocessing, which involved data filtering, data classification, projection and transformation.
Table1. ICESat Campaigns and data used in this study
Campaign
The Envisat Radar Altimeter 2 (RA-2) data used in this study is provided by the official website of ESA.ENVISAT changed its orbit on October 22, 2010 and the cycle changed from 35 days to 30 days (Rosmorduc et al., 2011). Here after, this repeat orbit was abandoned, and the time period used in this study is from
September 2003 to December 2008 (corresponding to cycles19– 75); in which periods can be contrasted with ICESat. The elevation data needed geophysical corrections, including dry / wet troposphere delay correction, ionospheric correction, polar tide correction and solid tide correction. We use quality labels and waveform labels to remove the bad observation points. The retracking of the RA2 altimeter waveform provides a mean range to the radar scatterers within a certain area of several square kilometres(Roemer et al. ,2006).Generally, the surface of the ice sheet is slanting and the impact point is not located in the satellite's underneath direction, which leads to a range error. So, correction for slope induced error (SE) is necessary. The SE correction usually been introduced through simple surface parameters such as the surface slope that can response topographic information (Roemer et al., 2006). In this paper, we consider that the impact point is correct and regard the SE as a distance error. We assume a planar surface over the footprint and using small angle assumptions, the correction becomes a function of the altitude and the slope ,the equation is given by:
∆� = � ���� − 1 1 where H is the altitude of the satellite above the surface (in meters), and α is the slope of the surface calculated from ICESat DEM (http://nsidc.org/data/nsidc-0304.html).
2.3 Crossover Analysis
The orbits of the satellite around the earth can be divided into ascending arcs (from south to north) and descending arcs (from north to south). The intersection of the tracks at the same location is called the crossover point (Li et al., 2003). Firstly, the crossover is calculated by fitting the track to a quadratic function and calculating the intersection of the two curves. Then, only points which are closed to the crossover point are used to iterative fitting until the crossover point is stable. The elevation at the crossover is calculated by linearly interpolating from the points on both ascending and descending tracks. If the elevation data is invalid or missing within the expected distance (330 m agrees to the previous value to within 2%.
3. RESULTS AND DISCUSSION
The crossover analysis mentioned above was used to obtain the crossing points of the ICESat tracks, Envisat tracks and ICESat-Envisat tracks separately. The two tracks we chose for cross-over analysis should be in the same campaign for ICESat (within 33 days) or the same cycle for Envisat (within 35 days). Due to the small amount of ICESat data and the sparse distribution of the intersection points, 20km × 20km grid is established to make the overlap analysis while 10×10km grid is applied for Envisat as the data is abundant. The standard deviation of a grid of elevation residuals at time-coincident crossovers is calculated as the precision of each satellite while the mean value is calculated as the deviation of ICESat-Envisat.
3.1 Calculate Result
The geographical distribution of the precision in ASS area and LAS area are shown in Figure 2a, 2b,respectively. In both figures, precision in higher latitude is better than the margin areas. Compared with the two satellites, ICESat has a higher precision. For both satellites, LAS has a better result than ASS.
The International Archives of the Photogrammetry, Remote Sensing and Spatial Information Sciences, Volume XLII-2/W7, 2017 ISPRS Geospatial Week 2017, 18–22 September 2017, Wuhan, China
This contribution has been peer-reviewed.
As the latitude grows, the tracks for both ICESat and Envisat become sparse, so the crossover points in margin areas are less than the higher latitude region. In the Amundsen Sea Sector area, the average precision of ICESat is 0.10 m and 1.10m for Envisat. In the LAS area, the average precision is higher as 0.09m for ICESat and 0.56m for Envisat. Compared ASS and LAS, it is clear that the ASS region has a more complex distribution, which is related to the complex terrain and significant ablation.
(a) (b)
Figure 2. (a) precison of ICESat in LAS and ASS; (b) precison of Envisat in LAS and ASS.
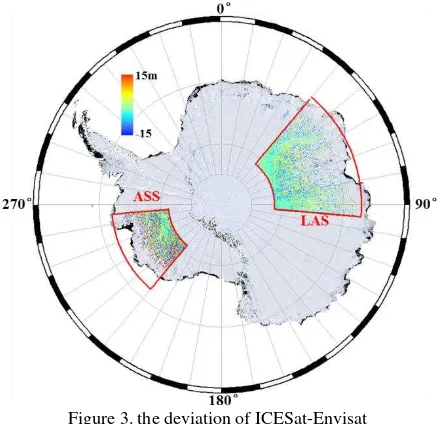
Figure 3. the deviation of ICESat-Envisat
The deviation of ICESat-Envisat is shown in figure 3. As the figure shows, the flatter inner area of Antarctic ice sheet has a small deviation than complex margin area in both ASS and LAS. The average difference of ICESat-Envisat intersection in the ASS area is 0.43 m, and the standard deviation is 7.14 m while in the LAS area, with an average of 0.53 m, the standard deviation of 1.23 m. This is because Envisat is a radar altimeter whih has a penetration of the surface snow and ICESat laser altimetry do not penetrate the surface ice sheet. The average difference 0.43m and 0.53m in ASS and LAS is coincident with the penetration depth for Envisat. The deviation shows the ICESat and Envisat has a good agreement in LAS (1.23m). The LAS region has a relatively slow slope than ASS region. The slope correction for Envisat is effective while for ASS region, the terrain is more complex and our slope correction method may not correct all of the slope included error so that the deviation is larger than LAS region.
3.2 Further Discussion
The deviation for ICESat and Envisat is calculated in ASS and LAS, but the impacts which influence the result such as terrain
slope, ice velocity and elevation change trend has not been analysed in our paper. The correlation analysis is going to be developed.
4. CONCLUSION
The precision of ICESat and Envisat are estimated in ASS and LAS separately, meanwhile the deviation of ICESat and Envisat is generated. The good precision of ICESat indicates the good data quality and leads our later research in these two regions. The less precise Envisat data is also a good dataset for investment which needs meters lever precision such as DEM generation. The differences of ICESat and Envisat indicate the penetration depth of 0.43 and 0.53 in ASS and LAS separately.
ACKNOWLEDGEMENTS
This work has been supported by the National Natural Science Foundation of China (Project Nos. 41325005, 41571407 and 4151101326), the National Key Basic Research Program of China (No. 2012CB957701), the Shanghai Rising-Star Program (Project No. 15QA1403700), and the Fundamental Research Funds for the Central Universities. We would like to thank NSIDC and ESA data centre for providing ICESat and Envisat data.
REFERENCES
Abshire, J. B., Sun, X., Riris, H., Sirota, J. M., McGarry, J. F., Palm, S., Yi, D. H., and Liiva, P., 2005. Geoscience laser altimeter system (GLAS) on the ICESat mission: on‐orbit measurement performance. Geophysical Research Letters, 32(21).
Arthern, R. J., Wingham, D. J., and Ridout, A. L., 2001. Controls on ERS altimeter measurements over ice sheets: Footprint-scale topography, backscatter fluctuations, and the dependence of microwave penetration depth upon satellite orientation. Journal of Geophysics.,106(33), pp. 471–484.
Bamber, J. L., Gomez-Dans, J. L. and Griggs, J. A., 2009. A new 1km digital elevation model of the Antarctic derived from combined satellite radar and laser data – Part 1: Data and methods. The Cryosphere, 3(1), pp. 101–111.
Brenner, A. C., DiMarzio, J. P., and Zwally, H. J., 2007. Precision and accuracy of satellite radar and laser altimeter data over the continental ice sheets. IEEE Transactions on
Geoscience and Remote Sensing, 45(2),PP.321-330.
Cazenave, A. and Llovel W., 2010. Contemporary sea level rise.
Annual review of marine science, 2, pp. 145-173.
Davis, C. H., and Ferguson, A. C., 2004. Elevation change of the Antarctic ice sheet, 1995-2000, from ERS-2 satellite radar altimetry. IEEE Transactions on Geoscience and Remote
Sensing, 42(11), pp. 2437-2445.
Féménias, P., Rémy, F., Raizonville, P., and Minster, J. F., 1993. Analysis of satellite altimeter height measurements above ice sheets. Journal of Glaciology, 133, pp. 591–600.
Gunter, B. C., Didova, O., Riva, R. E. M., Ligtenberg, S. R. M., Lenaerts, J. T. M., King, M. A., van den Broeke, M. R. and Urban, T., 2014. Empirical estimation of present-day Antarctic glacial isostatic adjustment and ice mass change. The
Cryosphere, 8(2), pp. 743-760.
The International Archives of the Photogrammetry, Remote Sensing and Spatial Information Sciences, Volume XLII-2/W7, 2017 ISPRS Geospatial Week 2017, 18–22 September 2017, Wuhan, China
This contribution has been peer-reviewed.
Michel, A., Flament, T., and Rémy, F., 2014. Study of the penetration bias of ENVISAT altimeter observations over Antarctica in comparison to ICESat observations. Remote
Sensing, 6, pp. 9412-9434
Rémy, F. and Parouty, S., 2009. Antarctic ice sheet and radar altimetry: A review. Remote Sensing, 1, pp. 1212–1239.
Ridley, J. K. and Partington, K. C., 1988. A model of satellite radar altimeter returns from ice sheets. Remote Sensing, 9(4), , pp. 601–624.
Rignot, E., Bamber, J. L., Van Den Broeke, M. R., Davis, C., Li, Y. H., van de Berg, W. J., and van Meijgaard, E., 2008. Recent Antarctic ice mass loss from radar interferometry and regional climate modelling. Nature geoscience, 1(2), pp. 106-110.
Roemer, S., Legresy, B., Horwath, M., and Dietrich, R., 2007. Refined analysis of radar altimetry data applied to the region of the subglacial Lake Vostok/Antarctica. Remote sensing of
environment, 106(3), pp. 269-284.
Rosmorduc, V., Benveniste, J., Lauret, O., Maheu, C., Milagro, M., and Picot, N., 2011. Radar altimetry tutorial. ESA, Europe, 112-128.
Schutz, B. E., Zwally, H. J., Shuman, C. A., Hancock, D. and DiMarzio, J. P., 2005. Overview of the ICESat mission.
Geophysical Research Letter, 32, pp. L21S01.
Shepherd, A., and 46 others, 2012. A reconciled estimate of ice-sheet mass balance. Science, 338(6111), pp. 1183–1189.
Sørensen, L. S., Simonsen, S. B., Meister, R., Forsberg, R., Levinsen, J. F., and Flament, T., 2015. Envisat-derived elevation changes of the Greenland ice sheet, and a comparison with ICESat results in the accumulation area. Remote Sensing of
Environment, 160, pp. 56-62.
Vaughan, D. G., Comiso J. C., Allison, I., Carrasco, J., Kaser, G., Kwok, R., Mote, P., Murray, T., Paul, F, Ren, J., Rignot, E., Solomina, O., Steffen, K. and Zhang, T., 2013. Observations: Cryosphere, in Climate Change 2013, The Physical Science Basis. Contribution of Working Group I to the Fifth Assessment Report of the Intergovernmental Panel on Climate Change, edited by Stocker and others, pp. 317–383, Cambridge University Press, Cambridge, United Kingdom and New York, NY, USA.
Zwally, H. J., Schutz, B., Abdalati, W., Abshire, J., Bentley, C., Brenner, A., Bufton, J., Dezio, J., Hancock, D., Harding, D., Herring, T., Minster, B., Quinn, K., Palm, S., Spinhirne, J. and Thomas, R., 2002. ICESat's laser measurements of polar ice, atmosphere, ocean, and land. Journal of Geodynamics, 34(3–4), pp. 405–445.
Zwally, H. J., Li, J., Robbins, J. W., Saba, J. L., Yi, D., and Brenner, A. C., 2015. Mass gains of the Antarctic ice sheet exceed losses. Journal of Glaciology, 61(230), pp. 1019-1036.
The International Archives of the Photogrammetry, Remote Sensing and Spatial Information Sciences, Volume XLII-2/W7, 2017 ISPRS Geospatial Week 2017, 18–22 September 2017, Wuhan, China
This contribution has been peer-reviewed.