GEOSPATIAL ANALYSIS OF WETLANDS DEGRADATION IN MAKURDI, NIGERIA
P. Anule a, F. Ujoh b, *
a Department of Geography, Faculty of Environmental Sciences, Benue State University, Makurdi, Nigeria – [email protected] b Urban Planning Workstream, Nigeria Infrastructure Advisory Facility, Abuja, Nigeria - [email protected]
KEY WORDS: Wetlands degradation, Landsat, LCR & LAC, SDG 15, Makurdi
ABSTRACT:
Globally, the amount of wetlands have being on the decline due to the fragile nature of these ecosystems and unplanned land consumption practices. This has created pressure on suitable land for cultivation in most developing countries where most of the growing food demand originates. Previous studies revealed that wetlands and agricultural landuse dominated the landscape of Makurdi. However, the trend is changing in recent times. Makurdi has undergone tremendous transformation in its landuse/landcover due to rapid urbanization since 1976 when it became the capital city of Benue State. To estimate the land cover change in Makurdi, Landsat ETM, ETM+ and OLI satellite data for 1996, 2006 and 2016, respectively were utilised. The study adapted the Kappa index for assessing accuracy of the land use/cover maps generated from the analysis to improve the accuracy of results. An accuracy level of 80 to 91% was achieved. The results reveal an overall significant increase in built-up area and other land uses at the expense of wetlands from 26.3% in 1996 to 18.1% in 2016. Further analysis includes the land consumption rate (LCR) and land absorption coefficient (LAC) which reveals the role of population expansion in the recorded levels of wetland losses recorded in this study. The study projects a further decline of wetland cover by 33.15 km2 (or by 22.57%) in 2026 if steps are not instituted to control the rate of decline. Suggestions are made to align with and incorporate into policy the strategic need to adopt the provisions of the SDGs at local levels if we intend to avert the massive failure recorded by the now rested MDGs.
1. INTRODUCTION 1.1 Background
A number of different sub-classes of wetlands exist, but each can be defined as an area saturated with water for a duration that is sufficient to sustain various types of hydrologic and biological activities (National Wetlands Working Group, 1997). Wetlands typically possess high levels of biodiversity, help regulate watershed hydrology, and are a source of carbon sequestration (Wright and Gallant, 2007). Although wetlands only cover roughly 6% of the Earth’s land surface, they are considered an immensely important part of the global ecosystem (Töyrä and Pietroniro, 2005; Kashaigili et al., 2006).
Environmental researchers in recent decades have detected a trend of diminishing wetlands in terms of areal extent and health/quality, primarily linked to numerous anthropogenic interactions and indirect forces of the changing climate (Eppink et al., 2004; Hartig et al., 2003). Eppink et al., (2004), and Ujoh (2009) and Ujoh and Eneche (2017) explains that ecological fragmentation is often linked to human development in wetlands, generating a desire for management to establish a reasonable degree of land use that will generate a state of sustainability in these areas.
As the impacts of climate change and land use practices in the environment have become more abundantly apparent, remote sensing becomes a vital tool for the assessment of the status and well-being of wetlands (Cook et al., 2009), and in maintaining accurate records of the state of wetlands which is crucial in their preservation (Klemas, 2011; Robertson, 2015).
One of the main aspects that can be closely monitored remotely is the overall behaviour of wetlands over time (Klemas, 2011; Robertson, 2015) using a series of images from different years (Wright and Gallant, 2007). A wealthy amount of information can be extracted through the comparison of multiple images, and
* Dr. Fanan Ujoh; [email protected]
this data can sometimes be extrapolated to predict future changes (Klemas, 2011; Robertson, 2015). The flexibility of GIS allows the analyst to control the scale of their research, depending on the data available.
A major step towards the preservation and conservation of wetlands begins with understanding the level of degradation of these fragile ecosystems at regional and local spatial scales. Thus, providing an accurate evaluation of the spread and health of the world’s forest, grassland, water, and agricultural and land resources has become an important priority (Mengistu and Salami, 2007). Therefore, this study maps the status of wetlands in Makurdi Local Government Area (LGA) over a 20-year period (1996-2016) with a view to estimating the rich alluvial wetlands that can also be used for urban agriculture but is being lost to urban expansion and related land uses. An understanding of this status would aid in proffering suggestions towards developing policies for sustainable use of the environment of the study area. Using the information available on wetlands, as well as the literature regarding wetlands and remote sensing as a basis, this study aims to accomplish the following objectives:
1. Identify wetlands for different study epochs in Makurdi local government area (LGA) of Benue State using remote sensing and detect any changes in their extent or existence;
2. Correlate changes with nearby land use and land cover over time;
3. Identifying wetland losses within the stipulated epochs; and,
4. Project future levels of degradation (up to 2026) based on the trend observed over the last 20 years (1996-2016).
aspirational, global in nature and universally applicable to all countries, while taking into account different national realities, capacities and levels of development and respecting national policies and priorities (Osborn et al., 2015), and should be focused on priority areas for the achievement of sustainable development. Building on the gains of the MDGs post-2015, it is imperative that development continues to thrive at local and regional levels within the context of globally established sustainability frameworks as provided for in the SDGs. Wetlands are valuable yet fragile and sensitive ecosystems which have experienced extensive agricultural and other economic and socio-cultural exploitation which generally and cumulatively degrade their quality and quantity of wetlands.
In spite of the broad dimensions of the SDGs (which are generally aimed at sustainability in environmental resources utilization and human resource redistribution), of specific interest to this study is the SDG Number 15 which states, inter alia: “Protect, restore and promote sustainable use of terrestrial ecosystems, sustainably manage forests, combat desertification, and halt and reverse land degradation and halt biodiversity loss”. This goal is to be achieved vide 5 targets along with the indicators listed for each target as shown below:
a) Target 15.1: By 2020 ensure conservation, restoration and sustainable use of terrestrial and inland freshwater ecosystems and their services, in particular, forests, wetlands, mountains and drylands, in line with obligations under international agreements; Indicators:
15.1.1: Forest area as a proportion of total land area;
15.1.2: Proportion of important sites for terrestrial and freshwater biodiversity that are covered by protected areas, by ecosystem type;
b) Target 15.2: By 2020, promote the implementation of sustainable management of all types of forests, halt deforestation, restore degraded forests, and increase afforestation and reforestation (by a significant percentage) globally;
Indicator:
15.2.1: Progress towards sustainable forest management.
c) Target 15.5: Take urgent and significant action to reduce degradation of natural habitat, halt the loss of biodiversity, and by 2020 protect and prevent the extinction of threatened species; Indicator:
15.5.1: Red List Index (RLI)1.
d) Target 15.8: By 2020, introduce measures to prevent the introduction and significantly reduce the impact of invasive alien species on land and water ecosystems, and control or eradicate the priority species;
Indicator:
15.8.1: Proportion of countries adopting relevant national legislation and adequately resourcing the prevention or control of invasive alien species.
e) Target 15.9: by 2020, integrate ecosystems and biodiversity values into national and local planning, development processes and poverty reduction strategies, and accounts.
Indicator:
15.9.1: Progress towards national targets established in accordance with Aichi Biodiversity Target 2 of the Strategic Plan for Biodiversity 2011-2020.
1
The Red List Index (RLI) is currently available for 4 taxonomic groups (birds, mammals, amphibians, and corals.) only. These are the groups which have had all species assessed, at least twice. Currently, the RLI clearly demonstrates that the status of these major groups is
The UN General Assembly (Resolution 68/261) recommends that “SDGs indicators should be disaggregated, where relevant, by income, sex, age, race, ethnicity, migratory status, disability and geographic location, or other characteristics, in accordance with the Fundamental Principles of Official Statistics”. To the extent that statistics and data on the current state of wetlands is required for planning, this study is a focused attempt towards supporting the attainment of the SDG 15 (at the local level) through the laid down indicators by the United Nations (2016) and supported by the RLI by Bubb et al., (2009).
2. METHODOLOGY 2.1 Study Area
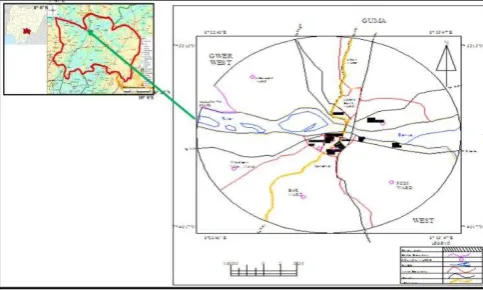
River Benue, the second largest river in Nigeria, is endowed with an extensive network of streams and a large expanse of wetlands forming the Benue valley. The river begins its 1,400 km stretch from the Adamawa Plateau of northern Cameroon and flows west through the towns of Garoua and Lagdo Reservoir (in Cameroon), into Nigeria through Jimeta, Ibi and Makurdi before confluencing with the largest river in Nigeria (the River Niger) at Lokoja. This study however, specifically focuses on Makurdi LGA (Figure 1), a strategic location within the River Benue basin area. Makurdi is a transit/nodal point (rail, road and in-land waterways) between the south-east and northern parts of Nigeria. The study area generally falls within the transitional belt from the densely vegetated south eastern Nigeria to the Sudano-sahelian region of northern Nigeria. According to the National Population Commission (2007), the last population census in 2006 recorded the population of Makurdi LGA as 297,398. Makurdi as currently defined politically, covers a radius of 16 Km2km with an area of about 800km2. The average elevation of the area ranges between 250m – 450m above sea level.
Figure 1. Makurdi LGA, the study area.
2.2 Research Materials and Methods
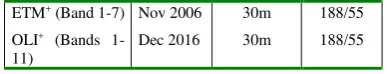
Landsat TM, ETM+ and OLI for 1996, 2006 and 2016, respectively were downloaded from the Global Land Cover Facility (GLCF) database. The qualities of the imageries used is shown on table 1. Also, a base map of Makurdi LGA was
ETM+ (Band 1-7) Nov 2006 30m 188/55
OLI+ (Bands
1-11)
Dec 2016 30m 188/55
Table 1. Characteristics of Landsat images used
ERDAS Imagine 9.2 software was used for pre-processing of the images which were subsequently imported into ArcMap 10 for image classification. All processes were performed in a raster environment with the exception of vector data used for defining the study area. A Garmin Etrex 32 handheld GPS was used to record coordinates for training sites. Determination of appropriate classes was done based on Level I of the Land use/cover classification by Anderson, et.al (1976). Six (6) classes namely were identified (Table 2).
Land Use Code Description Appearance
Color
Waterbody WA Open water field: freshwater, perennial streams, human-made ponds and Natural lakes cities, towns or Settlements, roads or any other kind of physical infrastructure.
Cyan
Wetland W Seasonally flooded areas covered with erect, rooted, herbaceous hydrophytes.
Green and dark pink
Forest FO Areas dominated by natural trees, such including riparian forest
Dark Red
Mixed Farming area
MFA Cultivated areas with field crops rice,
maize, beans or vegetables, etc.
Pink and dark blue
Barren land BS Soil or sand areas not covered by grass, sod or other live
ground covers.
Dark Brown or Brown and
white Adapted and modified from Anderson et al (1976)
Table 2. Landuse classes for the study.
2.3 Image Classification
2.3.1. Training stage: The image classification process was carried out using ERDAS Imagine image classification tool. Although the clumping of pixels is performed automatically by the software, the procedure followed in this study involved manual input. The quality of these inputs is instrumental in generating an accurate classified image. These inputs existed in the form of training sites, which were polygons digitized within the boundary of several different feature classes. The placement of these polygons was based primarily on the spectral reflectance of pixels as seen in different wavelength band combinations. Some useful combinations of the red, green, and blue bands used during the training stage were 4, 3, 2 for Landsat 7 and 5,4,3 for Landsat 8 for the purposes of visualization and better object determination. The result was effective in identifying wetlands.
2.3.2. Supervised Classification: Maximum Likelihood classification was executed for each image. This method assumes a normal distribution of DN values, allowing the function to determine the probability of a pixel belonging to a certain feature class and assign each pixel to the highest probability class (Lillesand et al., 2004). Classifications were often repeated numerous times after additional training sites were added to achieve satisfactory results. Wetland areas were occasionally classified as grassland, requiring additional polygons to be digitized to properly classify the image.
2.3.3. Post-classification processing: The classification process often misclassified pixels in outlying areas that are not an accurate representation of reality; individual or small clusters of pixels that are apparently segregated from other groups of the
same class were often misclassified. Cells with DN values that fall midway between two distinct classes were sometimes misclassified, creating a generous amount of noise within the image. Two filters were used to manage these problems. Isolated cells whose class did not match adjacent cells were changed to match the class of the majority of neighboring cells. This filter adjusted cells with four orthogonal neighbors of another class. The pixels along the boundaries of the resulting layer’s classes were then smoothed by expanding and shrinking the pixels, reducing clutter along the boundaries shared by two classes. These post-processing tools were useful for eliminating misclassified pixels regardless of the image’s resolution. With filtering complete, each classified image was clipped to the same extent.
2.3.4. Accuracy assessment: The accuracy of each classified image was tested by randomly generating a series of points within ERDAS Imagine, manually identifying the land cover type at each location, and subsequently comparing the land cover with the classified image. One hundred (100) points were generated
Table 3. Results of accuracy assessment of classified images.
Makurdi Land Use
Conditional Kappa for each LU/LC Category 1996 to 2016
1996 2006 2016
Table 4. Conditional Kappa for each LU category.
2.4 Data Analysis
The Land Consumption Rate (LCR) and Land Absorption Coefficient (LAC) were adopted from Yeates and Garner (1976) and Zubair (2008) for this study, using the following functions:
LCR = A
P (1)
Where
A = area extent of the study area in hectares; P = the population,
Ai1 and Ai2 = the area extents (in hectares) for early and later years;
Pi1 and Pi2 = population figures for the early and later years respectively.
The population estimates method was adopted from Zubair (2008) and is given as follows:
n = r/100 * Po (3)
Pn = Po + (n * t) (4)
Where:
Pn = estimated population (1996 & 2016); Po = base year population (1991 & 2006 Census); r = growth rate (3.0%);
n = annual population growth; and, t = number of years projecting for.
The LCR and LAC are applied to establish the role population increase plays in the rate of land consumption over specific spatio-temporal scales.
3. RESULTS
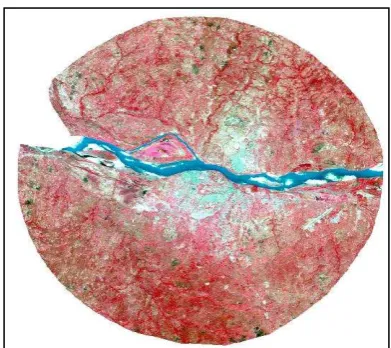
3.1 Quantifying land use/cover of study area (1996-2016) The quantification of various land use/cover classes within the study area is presented in Tables 5 and 6, while Figures 3, 4 and 5 show actual composition of classes of land cover for years 1996, 2006 and 2016, respectively. The false color composite (FCC) is shown on Figure 2. Clearly, wetlands cover is the only land cover that has continually experienced decline while others recorded various levels of increase.
Makurdi Land Use
Total Area in 1996 (km2)
Total Area in 2006 (km2)
Total Area in 2016 (km2)
Barren land 140.975 121.137 102.649
Mixed farming areas
202.03 183.096 173.313
Wetland 213.17 185.45 146.864
Built up 96.567 169.456 235.64
Forest 136.67 124.183 116.341
Water body 20.947 27.642 35.236
Total 810.359 810.964 810.043
Table 5. Landuse composition of study area (Km2) in 1996, 2006 & 2016.
Makurdi Land Use
Total Area in 1996 (%)
Total Area in 2006 (%)
Total Area in 2016 (%)
Barren land 17.397 14.937 12.672
Mixed farming areas
24.931 22.578 21.396
Wetland 26.306 22.868 18.130
Built up 11.917 20.896 29.090
Forest 16.865 15.313 14.362
Water body 2.585 3.409 4.350
Total 100.000 100.000 100.000
Table 6. Landuse composition of study area (%) in 1996, 2006 and 2016.
Figure 2. False Color Composition of study area.
Figure 3. Landuse composition of study area in 1996.
Figure 5. Landuse composition of study area in 2016.
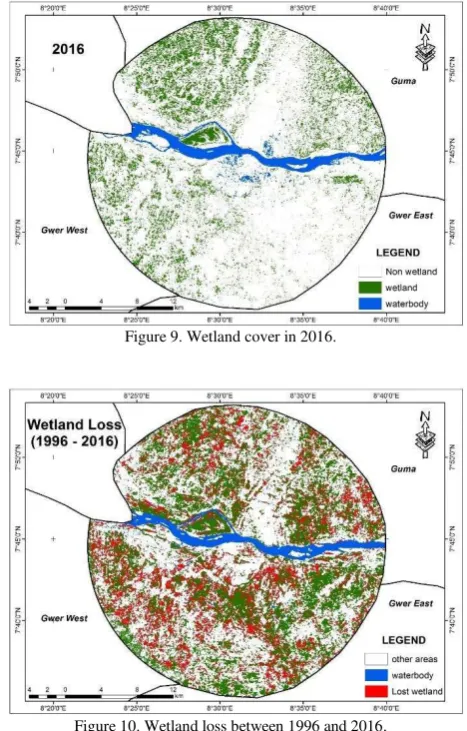
3.2 Quantification of Wetland Loss
Wetlands within the study area experienced huge losses to mixed farming over the last 20 years. This is due to the fact that much of the Benue State Government’s and the Federal Government of Nigeria’s policies in the past 2 decades had focused on agricultural expansion as an economic strategy to diversify to dependence on non-oil sectors. Additionally, the study area is known for its vast agricultural production potential and is christened “Food Basket of Nigeria”. Perhaps the positive gain is the conversion of wetlands into forest-like areas, especially in areas that are difficult to access for farming and habitation due to poor infrastructure within the region.
Detailed wetland losses have been sequentially captured between 1996 and 2016 as presented in Figures 7, 8, 9 and 10.
Figure 6. Wetland loss to other land uses/cover.
Figure 7. Wetland cover in 1996.
Figure 8. Wetland cover in 2006.
Figure 9. Wetland cover in 2016.
Figure 10. Wetland loss between 1996 and 2016.
3.3 Land Consumption Rate (LCR) and Land Absorption Coefficient (LAC)
were recorded in the following decade (2006-2016) in spite of the rapid increase in population within the same period. This is perhaps a result of the economic recession which gradually commenced from 2009 and is still being experienced in 2017.
Year *Population LCR Study
* Projections using 3% population increase rate by NPC (1991 and 2006)
Table 7. LCR and LAC in study area (1996-2016).
3.4 Future Projection of Wetland Status by 2026
The analysis on Table 8 shows the annual changes between epochs (1996-2006 and 2006-2016) and over the 20-year period (1996-2016). Using the simple overall average annual rate of decline in wetland cover between 1996 and 2016, the projected status of wetland cover in the study area is projected to further decline by 33.15 km2 (or by 22.57%) by 2026 if appropriate measures are not instituted to control current rates of decline.
Year Change Average Annual
Change 1996-2006 27.72 km2 13.00% 2.772 km2 2006-2016 38.59 km2 20.81% 3.859 km2 1996-2016 66.31 km2 31.07% 3.315 km2
Table 8. Trend of change & projected wetland cover in study area by 2026.
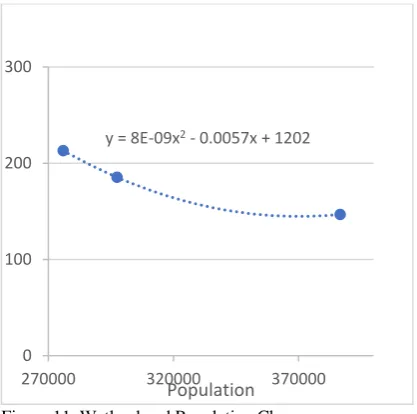
The population figures and wetland cover was used to plot a scattergram to indicate the changes in wetland that accompanied changes in population. A trendline was also inserted which was used to generate the projection function as shown in Figure 11.
Figure 11. Wetland and Population Change
The projection function contained in Figure 11 indicates a wetland cover (y) for any given population (x) within the study area.
4. CONCLUSION AND SUGGESTIONS
This study is an attempt to monitor the wetlands within a specified spatial and temporal context of comparing remotely sensed images obtained from the Landsat platform. The link between human development and wetland recession can be
measured through image classification, provided there is availability of remote sensing data which is generally affordable for local level research studies. Although image quality is an important factor in classification accuracy, moderate resolution imagery has proven to be appropriate for measuring wetland health. Considering that wetlands are so valuable to both humans and wildlife, the need for a comprehensive and periodically updated wetland database for Makurdi is apparently a pre-condition for planning usage and conservation of wetlands. This is necessary as population expansion continues to exert pressure on limited but fragile and critical natural resources including wetlands.
The SDG 15 have provided clear targets and indicators against which measurable progress can be tracked within space and over time. This study is one of such efforts. However, the study was limited based on availability of open access resources (specifically image resolution and recent software versions). In spite of the limitations, the study is expected to red-flag the status of wetlands in Makurdi, as a step towards ensuring that adequate actions are instituted if significant progress is to be achieved with the SDG 15. This is important as the UNICEF & WHO (2015) confirmed to very limited/insignificant progress recorded under the MDGs in most target nations, including Nigeria.
Based on the results of this study, it is suggested that further studies are carried out using images with relatively higher resolutions in order to compare results so as to establish a most suitable approach towards monitoring wetlands at the scale of Makurdi LGA. In addition to the remote sensing approach, a detailed study based on the red list index (RLI) should be contacted to assess the critical taxonomic groups (birds, mammals and amphibians) within the study area.
REFERENCES
Anderson, J.R., Hardy, E.E., Roach, J.T. and Witmer, R.E. 1976. A Land Use and Land Cover Classification System for Use with Remote Sensor Data. Geological Survey Professional Paper No. 964, U.S. Government Printing Office, Washington, D.C.
Bubb, P.J., Butchart, S.H.M., Collen, B., Dublin, H., Kapos, V., Pollock, C., Stuart, S. N., Vié, J-C. 2009. IUCN Red List Index - Guidance for National and Regional Use. Gland, Switzerland: IUCN. Modelling Biodiversity and Land Use: Urban Growth, Agriculture and Nature in a Wetland Area. Ecological Economics 51, 201-216.
Hartig T., Evans G. W., Jamner L. D., Davis D. S., Garling T. 2003. Tracking restoration in natural and urban field settings. Journal of Environmental Psychology. 23, 109–123
Kashaigili, J.J., McCartney, M.P., Mahoo, H.F., Lankford, B.A., Mbilinyi, B.P., Yawson, D.K. and Tumbo, S.D. 2006. Use of a hydrological model for environmental management of the Usangu Wetlands, Tanzania. Research Report, Colombo, Sri Lanka: International Water Management Institute.
Lillesand, M.T., Kiefer, W.R. and Dupman, W.J. (2004) Remote Sensing and Image Interpretation. (5th Edition). John Wiley & Sons Inc., New York.
Mengistu, D.A. and Salami, A.T. 2007. Application of Remote Sensing and GIS in Land Use/Land Cover Mapping and Change Detection in a Part of South-Western Nigeria. African Journal of Environmental Science and Technology Vol. 1, Np. 5, pp. 099-109
National Population Commission (1991). National Population Census 1991. Federal Government Printer, Lagos.
National Population Commission (2007). Legal Notice on Publication of the Details of the Breakdown of the National and State Provisional Totals 2006 Census. Federal Republic of Nigeria Official Gazette, Vol. 94, No. 24, Government Notice 2. May 15.
National Wetlands Working Group. 1997. The Canadian Wetland Classification System (2nd Edition). Wetlands Research Centre, University of Wateroo, Waterloo, ON.
Osborn, D., Cutter, A. and Ullah, F. 2015. Universal Sustainable Development Goals: Understanding the Transformational Challenge for Developed Countries. Report of a Study by Stakeholder Forum, May 2015.
Roberston, H.V. 2016. Wetland reserves in New Zealand: the status of protected areas between 1990 and 2013. New Zealand Journal of Ecology 40(1), 1-11
Toyra, J., and A. Pietroniro 2005. Towards operational monitoring of a northern wetland using geomatics-based techniques, Remote Sensing of the Environment. 97, 174–191.
Ujoh, F. 2013. An Assessment of the Environmental Impact of Limestone Mining and Cement Production at Yandev, Nigeria. Ph.D Thesis, Department of Geography and Environmental Management, University of Abuja, Nigeria.
Ujoh, F. 2009. Estimating Urban Agricultural Land Loss in Makurdi, Nigeria, Using Remote Sensing and GIS Techniques. Unpublished M.Sc Dissertation, Department of Geography and Environmental Management, University of Abuja, Nigeria.
Ujoh, F. and Eneche, P.S.U. 2017. Ecological Assessment of Infrastructure Development in Kaduna State, Nigeria. Geospatial Information Science (GSIS) Journal (article under review).
United Nations 2016. Report of the Inter-Agency and Expert Group on Sustainable Development Goal Indicators (E/CN.3/2016/2/Rev.1). Available online at https://unstats.un.org/sdgs/indicators/Official%20List%20of%2 0Proposed%20SDG%20Indicators.pdf Accessed March 29th 2017.
UNICEF & WHO. 2015: Progress on Sanitation and Drinking Water. 2015 Update & MDGs Assessment. WHO, Geneva.
Wright, C. and Gallant, A. 2007. Improved wetland remote sensing in Yellowstone National Park using classification trees to combine TM imagery and ancillary environmental data. Remote Sensing of Environment 107 (4), 582-605
Yeates, M. and Garner, B. (1976) The North American City. Harper and Row Pub. New York.