Volume 26, Number 2, 2011, 147 – 155
THE RISE OF CHINA AND ITS IMPLICATION ON
INDONESIA
-
UNITED STATES TRADE
Diyah Putriani 1
Universitas Gadjah Mada ([email protected])
Meikha Azzani
Universitas Gadjah Mada ([email protected])
ABSTRACT
The purpose of this study is to analyze the impact of Chinese renminbi exchange rate againts the United States (US) dollar, on the bilateral export of Indonesia to the US. Johansen cointegration test and Ordinary Least Square (OLS) regression are employed to examine one impact. This research is limited only in the long-run aspect. The Johansen test shows that there are long-run relationships amongs variables involved such as GDP, Real Exchange Rate (RER), RER Volatility, and dummy variables. Empirical test result shows that there are positive significant impacts of the Chinese renminbi on the Indonesia’s exports to the US, implying that the relationship between Chinese exports and Indonesia export are complementary in the US market.
Keywords: Indonesia, China, the United States, renminbi, cointegration, OLS
INTRODUCTION*1
In the 1950s-1960s, the economic growth in some Asian countries region grew rapidly up to 8-9 percent per year. This situation had caused some Asia countries such as Taiwan, South Korea, Singapore and Hongkong to be called as New Industrializing Countries (NIC) (Kuncoro, 1997:321). Nevertheless, entering the 1990s, Cina has become as a new member of NIC in East Asia.
The People’s Republic of China is a communist country in East Asia founded in 1949 by Mao Zedong. Since being found 60
*
1
The authors would like to thank Tri Widodo (FEB UGM) for the research supervision, Sony Warsono (CGCG FEB UGM) for providing data facilities and anonymous referee for her/his valuable comments.
years ago, China has been commanded through strictly political and planned economic system based on public ownership by the Communist China Party (CCP). After the Mao’s regime was over, China was introduced to the new economy management. Particularly, in the end of 1978, under the aegis of Deng Xiaoping, China has been transformed from a centrally planned economy to a market economy. However, they still retain communism ideology as their political system (Ishihara, 1993).
constant nominal level. It was pegged by 8.704 againts the US dollar (US$). However, entering the year of 2005, China government revalued their currency by about 2.1 percent to 8.11 againts the US $. It was primary caused by the demand from US government. Further-more, to accelerate trade volume and reduce its international barriers, the government of China tried to be as the new member of World Trade Organization (WTO). In 2001, then, China has successfully entered to the WTO as a new member. This accession was widely expected to give further impetus to the country's export, Foreign Direct Investment (FDI) and overall growth prospects (Rawski, 2009;Yamazawa and Imai, 2001 ). In addition, to facilitate FDI dealings and other foreign investments in China’s region, the government of China then built more than 2000 Special Economic Zones (SZE) surrounding China Mainland (Widodo, 2008).
As the result of these new policies, during the periode of 1980 to 2000 the Chinese international trade was phenomenally in-creasing, from about US$19.30 to US$249.2 billion, moreover, the share of China in total world exports also expanded from 0.96 percent to 3.9 percent. Then, in 1990s Cina has become the biggest garment producer in the world, with twenty percent of world’s garment produced by China (Yamazawa and Imai, 2001). Thus, in the early 2000, it was not surprising that China had become the seventh largest international exporter, following the U.S., Germany, Japan, France, United King-dom, and Canada (Yue, 2001). By 2002, China was the biggest economy in Asia after Japan and the second largest in Purchasing Power Parity (PPP) terms in the world behind the US, the sixth biggest merchandise trading nation in the world, the world's twelfth largest exporter of commercial services, and the largest recipient of foreign direct investment (FDI) among developing countries. Those
power in Asia and has being given various names such as global factory, the world’s manufacturing centre and export processing zone of the world (Rajan, 2003) 2.
In the contrary, many economists and competitors firmly believe that the key factor of the China’s strengthened international competitiveness is caused by the pegging of
renminbi againts the US$. This inference is
based on the study of Funke and Rahn (2005) that argues the main purpose of the China goverment devalued its currency was to maintain Chinese vibrant exports artificially cheaper than exports goods from the US, which has lead to job losses in America, Japan, and other more sluggish economies in the region. Furthermore, Baak (2007 and 2005) concluded that the depreciation of renminbi turned out to decrease both Korean exports to Japan and the US exports to China.
The transmission can be explained as follow: the price of Chinese export goods is cheaper due to the devaluation of renminbi, so that it causes products from other countries will be relatively more expensive.
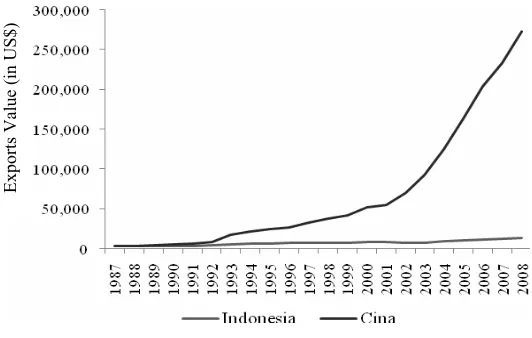
In the case of Indonesian trade, for more than two decades (1987-2008), the growth of Indonesian exports to the US increased up to 7.12 percent. As a comparison, the growth of Indonesian exports to the US was much lower than Chinese exports which was about 25.2 percent (Figure 1).
2China’s merchandise exports increased from about
Source: DOTS. Authors’ calculation.
Figure 1. The Comparison of Total of Exports Value of China and Indonesia to The US
As an additional information, the US is the major trading partner for both of Indonesia and China. Moreover, the implication of ASEAN-China Free Trade Area (ACFTA) becomes the new concern of the Government of Indonesia which has a corellation to the future of its international trade. Teh (1999) states that China is the main competitor for ASEAN countries in international trade. Therefore, a specific study is needed to explore the relationship and position of China and Indonesia trade in the case of the US market.
According to the heated debate among the economists in the context of the renminbi side effect and the importance of the issue, this research is aimed to deeply analyze the impact of both devaluation and real exchange rate of the Chinese renminbi on the exports of Indonesia to the US, particularly in the
long-run3. The rest of this paper is organized as
follows. Part 2 exhibits research methods comprising the econometric model and data. Part 3 shows the empirical result analysis. And finally, conclusions is presented in Part 4.
3 In the context of Chinesse renminbi real exchange rate
against U.S. dollar.
RESEARCH METHOD
1. The Econometric Model
The most important issue of this research is how to determine both impacts devaluation and real exchange rate of Chinese renminbi on the trade of other East Asian countries, particularly on the exports of Indonesia that has rarely been explored4.
Based on the work and typical spesification of other studies as in Baak (2007, 2006 and 2005), Arize and Osang (2000), Widarjono (2005), and Funke and Rahn (2005), we set up an econometric model for the long term equilibrium relation between exports and all independent variables as follows:
Yijt= β0+ β 1gjt+ β2pijt+ β3σijt
+ β4pcjt+ β5 Dijt + εijt (1)
4 Baak (2007) examined that some studies explored the
impact of the renminbi on Chinese trade itself. Zhang (2001), Chou (2000), Tang ( 2003), Wang and Zhang (2003) investigated the effects of the Japanese yen depreciation on the Chinese exports. While, Battacharya, Gosh and Jansen (2001) determined whether the emergence of China hurt Asian exports.
Exports Valu
e (
represents exporting country i.e. Indonesia,
and j denotes importing country, i.e. the
United State. Meanwhile, c is defined as a
competitor of i’s country in the market of
country j, that is China. The variables are
computed as follows:
Yijtis defined as country i’s exports to j. It is
formulated as follows (Baak, 2007):
100
quarterly nominal exports of country i to
country j. EXUVijt represents the price index
of country i. Unfortunately, the price index
from Indonesia are incomplete, thus real exports are calculated using the following formula (Baak, 2006):
100
Where IMijt is the quarterly nominal imports
of US from Indonesia, which is equivalent (with marginal differences) to the quarterly nominal exports of Indonesia to the US.
While, IMUVitdenotes the import unit value
index of the US.
gjt is the log value of real GDP from
importing country, i.e. the US. In many lite-ratures, GDP is commonly used as a proxy to measure economic activities in such a country.
Real GDP is explained, as follows (Mankiw, 2009):
exchange rate. Specifically, pijt represents
the real exchange rate of an exporting country’s currency againts importing coun-try’s currency. While, pcjt is defined as the
The real exchange rates are computed in the conventional ways, as follows (Baak, 2005):
Where Eijt is the quarterly nominal
ex-change rate of country i againts country j
and CPIit denote the quarterly consumer
price index of an exporting country i and an
importing country j, respectively.
Accord-ing to the formula above, the real exchange
rate of country c is also calculated in the
same way by replacing the subscript i into
c.
σijtrepresents the log value of real exchange
rate volatility. Specifically, the real exchange rate volatility is determined with the natural logarithm of the absolute quar-terly standard deviation of monthly real exchange rate, as follows5:
Where RERijk denotes the monthly real
exchange rate, RERij is the quarterly
aver-age of monthly real exchange rates and k is
the index of the months in a quarter. Some empirical studies have shown that real exchange rate volatility may have either positive or negative influences on trade,
5 The equation above is a correction of formula which had
been employed by Baak (2007), as follows:
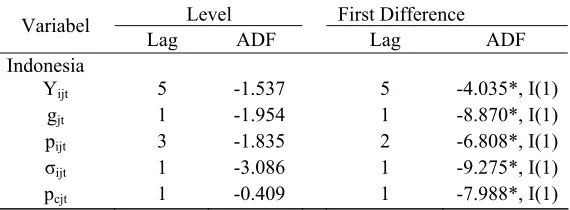
Table 1. ADF Unit Roots Test for The Level and The First Differences
Level First Difference
Variabel
Lag ADF Lag ADF
Indonesia
Yijt 5 -1.537 5 -4.035*, I(1)
gjt 1 -1.954 1 -8.870*, I(1)
pijt 3 -1.835 2 -6.808*, I(1)
σijt 1 -3.086 1 -9.275*, I(1)
pcjt 1 -0.409 1 -7.988*, I(1)
Source: Calculated from IFS, DOTS and NBSC
(*) Denotes rejection of a unit root hypothesis based on Mackinnon’s critical value at at the α =1%, 5%, 10%.
The number in the brackets is the order of integration depending on various economic and
institu-tional environment. However, Baak (2005 & 2006) hypothesizes that if the economic agents are moderately risk averse, it is generally expected that the impact of real exchange rate volatility will be negative, and vice a versa if the economic agents are moderately risk takers.
Dijt represents dummy variable, which is
employed to detect the impact of Chinese renminbi devaluation on the dependent variabel, i.e. the real exports of Indonsia.
Dijt takes a value of 0 (zero) for
1987.Q1-1993.Q4 period (or before devaluation) and 1(one) 1994.Q1-2009.Q2 period (or after devaluation).
2. Data Sources
The span data used in this research is from the first quarter of 1987 to the second quarter of 2009. This research period has been selected to represent the real condition based on its empirical test result. Specifically, the data of Indonesia exports to the US and the US imports from Indonesia have been obtained
from the Direction of Trade Statistics (DOTS)
of the International Monetary Fund (IMF). Meanwhile, nominal exchange rate, Consumer Price Indices (CPI), GDP nominal and GDP deflator of the US were taken from the
International Financial Statistics (IFS) of the
IMF. Especially, in the case of China the CPI
is provided by National Bureau of Statistics of
China (NBSC).
THE EMPIRICAL RESULTS AND ANALYSIS
1. Unit roots test: ADF test
The first step to test cointegrating relation-ship is detecting the presence of unit roots in the variables included in equation (1) by employing Augmented Dickey-Fuller (ADF) test, both for the level and the first difference. The optimal lags length included in the tests are determined by the Aikake Information Criterion (AIC).
Based on the results of ADF test for the level, table 1 reports ADF statistics which shows that all of the variables are not stationary at the level. However, from ADF test for the first difference, all of test appears to reject the null hypothesis of a unit roots at all significance level, i.e. variables are integrated of order one, I(1), or stationary at the first difference.
2. Cointegration test
said, test for cointegration could be thought of as a pre-test to avoid “spurious regression” situation. The presence of cointegrating rela-tionship is appeared when there are two non stationary series, I(1), i.e. they have stochastic trends; but their linear combination is stationary, I(0). In short, the stationary linear combination cancels out the stochastic trends in the two series, which can be proven by checking the residuals from the regressions, which are stationary, I(0) (Gujarati, 2003: 822).
Because of the empirical model of equa-tion (1) is a multivariate case, the presence of cointegration could be detected by applying Johansen cointegration test (Thomas, 1997:
selection criteria tests, which maximum lags length included in the tests are 8 (Tabel 2). In addition, if the I(1) variables involved are cointegrated, thus it is known that the OLS estimation are consistent (Thomas, 1997:428).
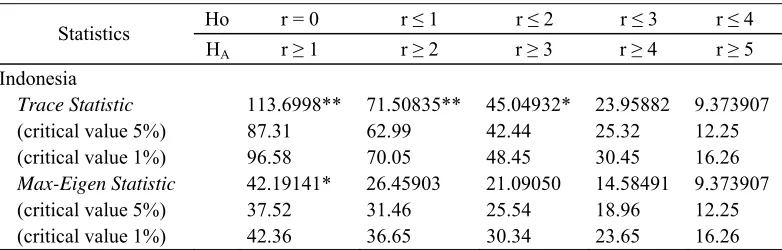
Under Johansen cointegration test proce-dures, table (3) reports its results. As can be seen, the result shows that both trace statistics and max-eigenvalue statistics confirm the presence of cointegrating vectors, implying the variables in equation (1.1) are cointegrated. According to the estimation of Error Correction Model (ECM) regression, the test result shows that the estimated coefficient of Error Correction Term (ECT) is negative and
significant at the α= 1%, 5%, 10% (Table 4).
Table 2. VAR lag order selection criteria
Country Lag LogL LR FPE AIC SC HQ
Indonesia 8 98.636 5.563* 0.007* -2.089* -1.707* -1.935* * indicates lag order selected by the criterion
LR : sequential modified LR test statistic (each test at 5% level) FPE : Final prediction error
AIC : Akaike information criterion SC : Schwarz information criterion HQ : Hannan-Quinn information criterion
Table 3. Johansen Cointegration Test
Ho r = 0 r ≤ 1 r ≤ 2 r ≤ 3 r ≤ 4
Statistics
HA r ≥ 1 r ≥ 2 r ≥ 3 r ≥ 4 r ≥ 5
Indonesia
Trace Statistic 113.6998** 71.50835** 45.04932* 23.95882 9.373907
(critical value 5%) 87.31 62.99 42.44 25.32 12.25
(critical value 1%) 96.58 70.05 48.45 30.45 16.26
Max-Eigen Statistic 42.19141* 26.45903 21.09050 14.58491 9.373907
(critical value 5%) 37.52 31.46 25.54 18.96 12.25
(critical value 1%) 42.36 36.65 30.34 23.65 16.26
Source: Calculated from IFS, DOTS and NBSC
Following the work of Baak (2007, 2006, and 2005), this studies examine that negative and significant value of the estimated ECT coefficient confirming the presence of one long-run relationship among the variables involved. In other words, this result shows long-run relationships among variables involved. As mentioned before, this study only focuses on the impact of Chinese renminbi on the bilateral exports of Indonesia to the US in the long run term, thus the short run impacts will be ignored.
Table (5) shows the result of the estimated coefficient of equation (1.1) using OLS. Dummy variable has a positive significant impact on on the bilateral export of Indonesia to the US. In other words, devaluation policy of renmimbi has positive impact on the Indonesia exports. Even more, depreciation of the Chinese renminbi proved to have positive impact on the exports of Indonesia to the US, implying that the products of Indonesia is complementary with Chinese products in the
US market. Spesifically, a 1 percent increase in the exchange rate of the Chinese renminbi (i.e. a 1 percent depreciation in the value of the Chinese renminbi againts US dollar) increases Indonesia exports by about 0.24 percent.
The strong effect of renminbi on the bilateral Indonesia exports to the US has been causing insignificant impacts not only on the bilateral domestic real exchange rates but also on the domestic real exchange rates volatility of Indonesia rupiah. This inference is accord-ing to the renminbi real exchange rate coeffi-cient which much higher than both of domes-tic real exchange rate and real exchange rate volatility. The similiar conclusion has been also found in the research conducted by Baak (2006) which was depreciation of renminbi has positive impact to Japan’s export to U.S, but the real value and the real exchange rates volatility of yen do not have significant impact. In addition, according to the estimated coefficient, the real GDP of the US has
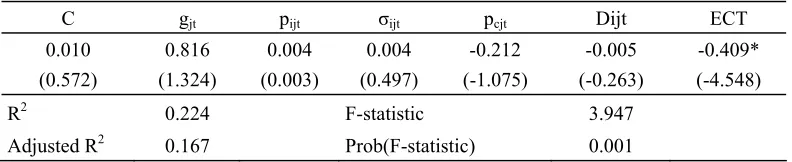
Table 4. Error Correction Term (ECT)
C gjt pijt σijt pcjt Dijt ECT
0.010 0.816 0.004 0.004 -0.212 -0.005 -0.409*
(0.572) (1.324) (0.003) (0.497) (-1.075) (-0.263) (-4.548)
R2 0.224 F-statistic 3.947
Adjusted R2 0.167 Prob(F-statistic) 0.001
Source: Authors’ calculation based on IFS, DOTS and NBSC Notes: Standard error in parantheses
The asterisk (*) indicate the rejection of the null hypothesis of a zero coefficient at the 5% significance level. According to the estimation of Error Correction Model (ECM) regression, the test result showed that the estimated coefficient of Error Correction Term (ECT) in Indonesia is negative and significant at the α=5%.
Table 5. OLS Estimation
C gjt pijt σijt pcjt Dummy R2 F-Stat
Prob (F-Stat)
Coeficient 3.393* 0.573* 0.114 0.007 0.244* 0.366*
Std.Error (0.993) (0.103) (0.088) (0.012) (0.140) (0.143)
0.935 24.23 0.000
Source: Calculated from IFS, DOTS and NBSC
Indonesia are normal goods for the US citizens.
From those explanations, one primary point should be addressed is as complementary goods, the Chinese exports’ position is much stronger than Indonesian exports. Therefore, the exports volume of Indonesia is depended on the value of renminbi. It may occur when the product exports of Indonesia is complementary product which also being produced in others China’s countries partner. In this case, the point must be underlined is China is the major producer of those exports product, particularly in the US market.
CONCLUSIONS
The objective of this research is to examine the impact of Chinese renminbi on the exports volume between Indonesia and US in the long term. According to the estimation, both of devaluation and Chinese renminbi have significant impact to Indonesian exports. Therefore, the renminbi depreciation possess out positive impact to Indonesian real exports to the U.S. It means that there is a complemen-tary relationship between commodity of Indonesia and China. Meanwhile, the real ex-change rate and the volatility of real exex-change rates Indonesian rupiah do not have significant impact. Based on estimated coefficient sign, the Indonesia bilateral exports to the US is dominated by the normal merchandise goods.
REFERENCES
ASEAN Secretariat, 2009. Overview of ASEAN. Available at http://www. aseansec. org.
Arize, Augustine and Osang, Thomas. 2000. “Exchange rate volatility and foreign trade: Evidence from thirteen LDC’s”.
Journal of Busssines and Economic
Statistics Vol.18, No.1:10-17.
China and the U.S”. Unpublished Manuscript. Department of Economics. Waseda University.
Baak, Saang Joon, 2006. “The Impact of The Chinese renminbi on the exports of Korea and Japan to The U.S”. Unpublished Manuscript. Department of Economics. Waseda University.
Baak, Saang Joon, 2007. “The Effect of The Chinese Renminbi on Korean Export to
Japan”. The Journal of Econometric
Study of Northeast Asia Vol. 6, No. 1:
103-112.
Departemen Luar Negeri Republik Indonesia, 2009. Mitra Wicara Penuh ASEAN. Available at http://www.deplu.go.id/
Funke, Michael and Jörg Rahn, 2004. “Just
How Undervalued is The Chinese
Renminbi?”. World Economy, Vol. 28,
No.4: 456-487.
Gujarati, Damodar, 2003. Basic Econometrics.
4th Edition. New Jersey: Mc Graw Hill.
International Monetary Fund (IMF). 2009 Direction of Trade Statistics. Available at http://www. imfbookstore.org. Accessed on September, 2009.
International Monetary Fund (IMF). 2009. International Financial Statistics. Avai-lable at http://www.imfbookstore.org. Accessed on September, 2009.
Ishihara, Kyoichi. 1993. China’s Conversion
to a Market Economy. IDE Occasional
Papers Series No. 28. Tokyo: IDE.
Kuncoro, Mudrajad, 1996. Manajemen
Keuangan Internasional [International
Financial Management]. 1st Edition.
Yogyakarta: BPFE.
Krugman, Paul and Obstfeld, Maurice, 2003.
International Economics: Theory and
Policy. Sixth Edition. United Kingdom:
Mankiw, Gregory. 2009. The Principle of
Macreconomics. New Jersey: Mc Graw
Hill.
McKibbin, Warwick dan Stoeckel, Andrew, 2003. “What if China revalues its
curren-cy?”. Economic Scenarios, Issue No.7.
Available at http://www. economicscenarios.com.
National Bureau of Statistics of China.
Available at http://www.stats.gov.cn/english/
Nicholson, Walter, 2004. Intermediate
Micro-economics and Its Application. Ninth
Edition. United States: Thomson Corpo-ration.
Nicholson, Walter, 2005. Microeconomics
Theory: Basic Principles and Extensions.
Ninth Edition. United States: Thomson Corporation.
Nopirin, 2007. Ekonomi Internasional
[International Economics]. 3rd Edition.
Yogyakarta: BPFE.
Rajan, Ramkishen, 2003. “Emergence of China as an Economic Power: What does
it imply for South-East Asia?”. Economic
and Political Weekly, June 28th-July 4th,
2003. Vol. 38, No. 26:2639-2643.
Rawski, Thomas, 2009. “China’s Economy and Global Interactions in The Long Run”. Discussion Paper No. 53. United Kingdom: China Policy Institute of
Nottingham University. Available at
http://www. Chinapolicyinstitute.org.
Teh Jr, Robert R, 1999. “The Effects of a
Renminbi Devaluation on ASEAN
Economies: An Applied General
Equilibrium Approach”. Presented in The
China-ASEAN Research Institutes
Roundtable University of Hong Kong.
Hong Kong: 16-18 September 1999. Available at http://www.aseansec.org/ 2826.Htm.
Thomas, RL, 1997. Modern Econometrics an
Introduction. 1st Edition. United
King-dom:Addison Wesley.
Widarjono, Agus, 2005. “The Impact of Real Exchange Rate and Trade Balance”.
Jurnal Ekonomi dan Bisnis Indonesia.
Vol.20. No.3: 239-249.
Widodo, Tri . 2008. “Shifts in Pattern of
Specialization”. Gadjah Mada
Interna-tional Journal of Business. January-April.
Vol.10. No.1: 47-75.
Winantyo, R., Saputra, Dwi Rahmat., Fitriani, Sri., Morena, Rita., Kosotali, Aswin., Saichu, Gunawan., Rohmadyati, Usmanti., Sholihah., Rachmanto, Aditya.,
and Gandara, Dadan, 2008. Masyarakat
Ekonomi ASEAN (MEA) 2015: Memper-kuat Sinergi ASEAN di Tengah Kompetisi
Global [ASEAN Economic Community
2015: Strengthening ASEAN Synergy
Amidst Global Competition]. Jakarta: PT
Elex Media Komputindo.
Yue, Changjun. 2001. “Comparative Advan-tage, Exchange Rate and Export in
China”. Presented in International
Conference: Has China Become a Market