VOLUME 5 No. 2, 22 Juni 2016 Halaman 81-146
OPtIMIZatION Of MUNICIPaL WastE COLLECtION POINts IN
YOGYaKarta CItY- INDONEsIa
Bertha Maya Sopha dan Alditya Perkasa Sri Haryoto
Jurusan Teknik Mesin dan Industri Fakultas TeknikUniversitas Gadjah Mada Email: [email protected]
aBstraK
Pemanfaatan kapasitas yang tidak merata seringkali menjadi masalah dalam sistem pengelolaan limbah di Yogyakarta. Masalah ini diperparah dengan tidak adanya alat keputusan untuk mengevaluasi sistem dan merumuskan strategi yang tepat. Oleh karena itu, penelitian ini bertujuan untuk menilai kinerja sistem pengelolaan limbah yang ada dan mengoptimalkan titik-titik pengumpulan limbah. Model matematis Mixed Integer Linear Programming dikembangkan dan diimplementasikan dalam Lingo 9. Temuan penelitian ini
menunjukkan bahwa sistem pengelolaan limbah saat ini dikaitkan dengan total biaya harian sekitar Rp 10
juta dan pemanfaatan kapasitas 88%. Beberapa skenario dikembangkan untuk menguji sistem yang optimal.
Temuan menunjukkan bahwa limbah kota saat ini dapat ditangani dengan 35 titik pengumpulan yang melibatkan 15 depot dan 20 kontainer. Sistem yang dioptimalkan sesuai dengan Rp 6,3 juta dan pemanfaatan kapasitas 99%, yang membuat biaya pengurangan sebesar 37% dan peningkatan utilisasi kapasitas sebesar 13% dibandingkan dengan kinerja sistem yang ada. Berdasarkan analisis sensitivitas, volume limbah kota
nampaknya merupakan faktor yang berpengaruh terhadap total biaya dan struktur jaringan. Batasan model juga dibahas.
Kata Kunci: Mixed Integer Linear Programming; Optimalisasi; Titik pengumpulan limbah kotamadya; Yogyakarta.
aBstraCt
Uneven capacity utilization seems to be a constant problem in Yogyakarta waste management system. The problem
is worsen by lack of a decision tool to evaluate the system and formulate appropriate strategy.This present study
therefore aims at evaluating the performance of existing waste management systemandoptimizingmunicipal waste
collection points. A mathematical model of MixedIntegerLinearProgramming was developed and implemented inLingo 9. Findings show that the current waste management system is associated to daily total cost of about IDR 10 million and capacity utilization of 88%. Scenarios are developed to examine the optimized system. Findings suggest that current
municipal waste can be handled with 35 collection points involving 15 depots and 20 containers. The optimized system
is corresponding to IDR 6.3 millionand the capacity utilization of 99%, which makes a reduced cost of 37% and an increasedcapacity utilization of 13% in comparison to the performance of the existing system. Based on sensitivity
analysis,volume of municipal waste appears to be inluential factor toward the total cost and network structure.
Limitation of the model is also discussed.
INtrODUCtION
Population growth has created problems related to urban waste particularly in a dense city such as Yogyakarta. Yogyakarta, the sixth denset city in Indonesia, has population densi-ty of 13,320 people per km2 (Badan Pusat Statis-tik, 2010). Current Yogyakarta waste manage-ment system is based on sectoral approach in which each sector handles different location of waste sources. The system has divided into ive sectors, i.e., Gunungketur, Kotagede, Krasak, Malioboro-Kranggan, and Ngasem-Gading. Malioboro-Kranggan sector handles the highest municipal waste of 195 m3daily, corresponding to 28% of total daily municipal waste. Types three of waste collection points, i.e., depot, container, and permanent polling station are employed. The total existing waste collection points are 91 consisting of 13 depots, 20 containers, and 58 permanent polling sta-tions.
Issues on urban waste such as waste dis-posal sites, illegal waste disdis-posal, and undis-placed waste appear to be recurring problems encountered by Yogyakarta. The problems are also worsen by the fact that current waste man-agement is not supported by suficient decision tool which facilitates planning and evaluation of the waste management system. Planning of current waste management system is mainly based on previous practices, intuitions, and ex-periences with the aim of minimizing transpor-tation cost. Lack of evaluation on the current system also hinders effective improvement as the system cannot be managed and the im-provement areas cannot be identiied without measuring its performance. It is not surprising that under-utilization of disposal points at one place while over-utilization of disposal points in other places frequently occur. Average uti-lization of depot and container are 70% and 86% respectively, while average utilization of permanent polling stations is generally over-utilized (Yogyakarta EnvironmentalAgency, 2013). Moreover, the department also inds dif-iculties to decide the optimum number, type, and location of waste collection points.
The present study therefore aims at as-sessing the performance of existing waste
man-agement system and then evaluating the opti-mal number and location of waste collection points. According to Yogyakarta Environmen-tal Agency (2013), due touneven utilization of waste collection points, the government aims to reducepermanent polling stations in order to increase capacity utilization of depots and con-tainers. Due to lack of the decision tool, the re-alization of the strategy becomes challenging. The present study contributes to understand the best way to increase utilization of both de-pots and containers through the elimination of permanent polling stations. Moreover, trans-portation network of depots and containers which employ direct delivery from either de-pots or containers to landill should be treated differently from that of permanent polling sta-tions which use milk-run delivery.
Most of literature on waste management is dominated by the optimization of collec-tion route such as Agha (2006), Karadimaset
al. (2007), and Bhambulkar (2011). This is also the case for the study of Yogyakarta waste management system. Most of the literature of Yogyakarta case focuses on optimizing route such as Prastawa (2012) who examined best route for collecting urban waste which mini-mizes travel time and Pramitaningrum (2013) who examined potential factors contributing to the long-term future urban waste. A study on the evaluation of current location of collec-tion points is still lack, whereas some efforts have actually been conducted such as Aremu (2011) who determined location of collection points to optimize service coverage using Arc-GIS Network Analyst, and Tjandra et al. (2006) who developed multi-criteria facility location model for municipal solid waste management in Greece.
procedure of developing optimization model which consists of system characterization, data collection, mathematical model formulation, implementation, veriication-validation, and intepretation of results is followed. Based on the system characteristics which involve both binary and continuous variables and linear
re-Method
lationships among the variables, Mixed Integer Linear Programming(MILP) was then used to developmathematical models to determine a set of waste collection point locations which gives minimum total cost.
Current waste management system has operated regionally, and each region has em-ployed three types of waste collection points (see Table 1 for the regions and waste collec-tion points). Depots have capacity range of 24 – 48 cubic meters. One up to two trucks are available in each depot to transport the waste to the landill. Depots normally receive munici-pal waste through trash haulers which collect wastes from individual households and usu-ally coordinated by local communities. Con-tainer is a portable trash bin with the capacity of 6 cubic meters. Waste loading and unload-ing is conducted automatically so that human labor is not needed as much as permanent poll-ing stations. Waste retrival is carried out uspoll-ing a truck which directly transports the waste to landill. Permanent polling stations have the capacity range of 1 – 4 cubic meters. Municipal waste from permanent polling stations are col-lected in a truck with capacity of 8 cubic meters and are delivered to inal landill once the truck is fully loaded. The delivery method used by permanent polling stations is typically milk-run delivery.
As the model only considers only depots and containers, the developed mathematical modelsfollows waste low of depots and co-tainers as shown in Figure 1.
Figure 1.
Waste low of depots and containers
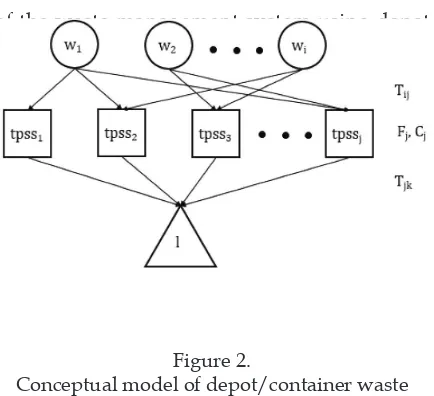
Transportation of wastesources todepots/ containers normally use a collecting wagon of three-wheel vehicles which are arranged by lo-cal communities, while transportation of waste from depots/containers to the landill use gar-bage trucks which are provided by the govern-ment. Figure 2 illustrate the conceptual model
of the waste management system using depot and container.
Figure 2.
Conceptual model of depot/container waste management system in Yogyakarta
Based on Figure 2, mathematical models are developed with the objective of minimizing the total cost. The total cost includes ixed cost incurred when depot/container is decided to open, and transportation cost which involves the costs of moving waste from the sources to depots/containers and then to the landill.
Objective function:
Constraintsof the model relates to waste mass balance as follows; the amount of waste sources is the same as that collected in depots and containers (Equation 2), the wastes received by depots and containers are never exceeded the capacity of depots and containers (Equation 3), the capacity of landill is greater than the wastes it receives (Equation 4). Additional constraint regarding to non-negativity is also added(Equation 5).
where,
wi : quantity of waste generated at the point i (m3)
Cj : daily capacity at waste collection point j (m3)
L : daily capacity of the landill (m3) Fj : daily-basedixed
costofdepot/con-tainer (IDR/day)
Tij : transportation cost from waste sour-ces i to depot/container j (IDR/m3) Tj : transportation costfrom depot/
container j to the landill (IDR/m3) xij : quantity of waste that was moved
from waste sources to depot/con-tainer j (m3)
yj : quantity of waste that was moved from depot/container j to the land-ill (m3)
bj : binary variable 0 (if depot/con-tainer is closed) and 1 (if depot/ container is opened)
tpssi : waste collection points i (i.e., depots and containers)
l : landill
Data including waste collection points (type, capacity, and location), daily waste vol-ume, and capacity utilization of each point, travelled distance, daily-based ixed cost, transportation cost,was collected through di-rect observation, interview, and secondary sources such as reports. The model was then implemented in the optimization software of Lingo 9. Veriication of the model was con-ducted by implementing the down-scaled-developed model in a spreadsheet-based op-timization software. The result of veriication test showed that the model developed in Lingo has produced similar output of that developed in the spreadsheet-based optimization soft-ware, indicating that the implemented model was veriied. With respect to validation, two types of validation, i.e., data validation and face-to-face validation, were conducted. Data was validated through triangulation, while results of the research were communicated to Yogyakarta Environmental Agencythrough face-to-face validation. The results are found to be acceptable.
To meet the research objectives, three sce-narios are developed. Base scenario (Scenario 1) is to evaluate the performance of current waste management system by mapping cur-rent activities and associated costs. Optimiza-tion is hence not yet necessary at this stage. Second scenario is then developed following the strategy suggested by Yogyakarta Envi-ronmental Agency to reduce the number of permanent polling stations. The reasons un-derlying the strategy is that permanent polling stations have beentime-consuming and high cost because the permanent polling stations require many labors and time for loading and unloading the waste. Moreover, it is dificult to control and manage many small capacity of permanent polling stations. Second scenario will assess the performance of the system with completely none of permanent polling stations. Consequently, it is assumed that the munici-pal waste is only be handled by depots and containers. Scenario 3 is assessing optimized location of depots and containers which yield the minimum total cost while still capable of handling the municipal waste load. Sensitiv-ity analysis is also conducted to examine the robustness of model results toward the change of input variables.
rEsULts aND DIsCUssION
scenario 1
Table 1
Current waste management system of Yogyakarta city
Sector Waste
source
Volume
(m3) Depot Container Permanent Polling Station
Gunungketur w1, w8,
w14 146 tpss1, tpss11
tpss14,tpss15,
tpss16,tpss18 tpss34, tpss35, tpss36, tpss37, tpss38, tpss39, tpss40
Kotagede w2 70 tpss2, tpss3 tpss17, tpss31,
tpss32, tpss33 tpss41
Krasak w1, w8,
w14 140 tpss8 tpss29, tpss30 tpss42, tpss43, tpss44, tpss44, tpss45, tpss46, tpss47, tpss48, tpss49, tpss50, tpss51, tpss52, tpss53, tpss54, tpss55, tpss56, tpss57, tpss58, tpss59, tpss60, tpss61, tpss62, tpss63, tpss64, tpss65, tpss66
Malioboro-Kranggan
w1, w8,
w14 195 tpss5,tpss6, tpss7, tpss13
tpss19, tpss20, tpss26, tpss27, tpss28
tpss67, tpss68, tpss69, tpss70, tpss71, tpss72, tpss74, tpss74, tpss75, tpss76, tpss77, tpss78, tpss79, tpss80, tpss81, tpss82, tpss83
Ngasem-Gading
w1, w8,
w14 136 tpss4,tpss9, tpss10, tpss12
tpss21, tpss22, tpss23, tpss24, tpss25
pss84, tpss85, tpss86, tpss87, tpss88, tpss89, tpss90, tpss91
Capacity 687 m3 456 m3 162 m3 163,5 m3
Based on aforementioned current system, the performance is evaluated and presented in Table 2. According to Table 2, the daily total cost is about IDR 10 million to handle all municipal
waste to landill. However, the utilization of waste collection points is, on average, 88%. It appears that the current management system has still areas to be improved.
Table 2
Performance of existing waste management system
Performance Indicators Value Unit
Total cost Fixed cost
Transportation cost from waste sources to collection points
Transportation cost from collection points to landill
10,114,803
Undisplaced waste 0 m3
Capacity utilization 88 %
scenario 2
To increase the utilization of both depots and containers, Scenario 2 therefore examines if only depots and containers handle current waste, following the strategy of Yogyakarta Environmental Agency to reduce permanent polling stations. The reason underlying the strategy is that the number of permanent polling stations is too large so that it is dificult to manage particularly in route planning.
the total cost is lesser, available capacity of both depots and containers is not suficient to handle current waste which is indicated by
undisplaced waste of 69 m3, corresponding to 10% of the total volume of daily generated waste. Figure 4 showing the location spread of depots and containers in Scenario 2.
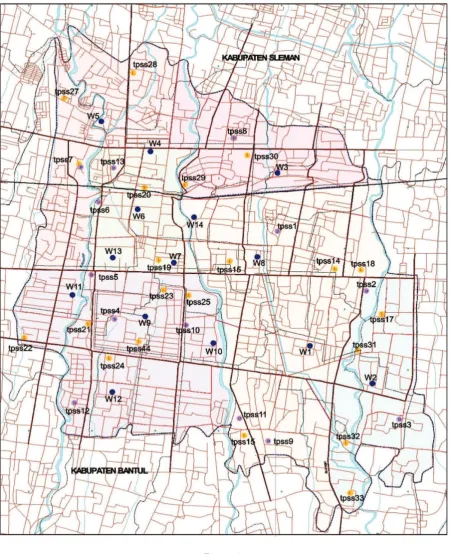
Figure 3.
Locations of depots (purple circle), containers (yellow circle), permanent polling station (red and blue squares), and aggregated waste sources (blue circle) (For interpretation of the references color in this
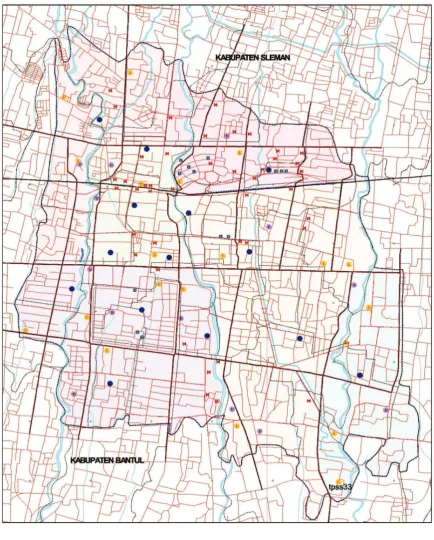
Figure 4.
Locations of depots (purple circle), containers (yellow circle) and aggregated waste sources (blue
circle)(For interpretation of the references color in this igure legend, the reader is referred to the web
Table 3
Performance of Scenario 2
Performance Indicators Value Unit
Total cost Fixed cost
Transportation cost from waste sources to collection points
Transportation cost from collection points to landill
6,022,979
Undisplaced waste 69 m3
Capacity utilitization 100 %
scenario 3
Based on the result of Scenario 2, it is nec-essary to have additional capacity to handle undisplaced waste. Scenario 3 therefore acco-modates additional capacity to handle remain-ing waste. However, the question remains where the additional collection points should bebuiltso that the minimum total cost can be achieved. Adding capacity of existing depots or containers seems not to be an option due to insuficient space. Potential locations of new depots or containers areadded based on the consideration that the locationsare owned by government, were previously ever being used as depots/containers, andarehaving sufi-ciently available space. Based on the criteria, 11 new containers (tpss92 Hayam Wuruk, tpss93
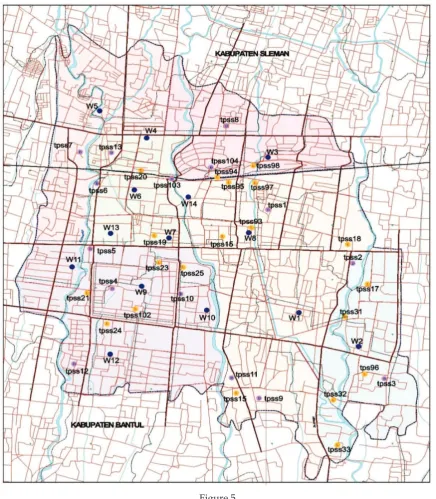
Mangunsarkoro, tpss94 Stasiun Lempuyan-gan 1, tpss95 Stasiun LempuyanLempuyan-gan 2, tpss96 Lapangan Karang, tpss97 Argolobang, tpss98 Kusbini, tpss99 Kawasan Bagunrejo, tpss100 Kawasan Kricak, tpss101 Wongsodirjan 2, tpss 102 Alun-alun Selatan) and 2 new depots (tpss103 Pasar Kembang, tpss104 Kridosono) are proposed.The total capacity of additional depots and containers are 162 m3 which makes the total available capacity of 780 m3, exceed-ing the total current waste. The scenario there-fore examines 15 depots and 31 containers. The scenario is simulated todetermine the best locations of both depots and containers which give the minimum total cost. Table 4 and Table 5 present the results of Scenario 3, while Figure 5 shows the spatial result.
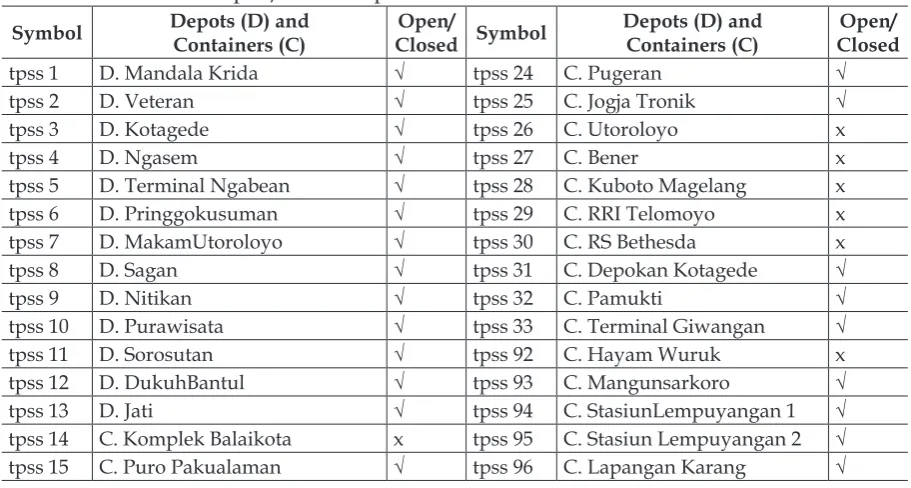
Table 4
Open/closed depots and containers of Scenario 3
Symbol Depots (D) and
Containers (C)
tpss 3 D. Kotagede √ tpss 26 C. Utoroloyo x
tpss 4 D. Ngasem √ tpss 27 C. Bener x
tpss 5 D. Terminal Ngabean √ tpss 28 C. Kuboto Magelang x
tpss 6 D. Pringgokusuman √ tpss 29 C. RRI Telomoyo x
tpss 7 D. MakamUtoroloyo √ tpss 30 C. RS Bethesda x
tpss 8 D. Sagan √ tpss 31 C. Depokan Kotagede √
tpss 9 D. Nitikan √ tpss 32 C. Pamukti √
tpss 10 D. Purawisata √ tpss 33 C. Terminal Giwangan √
tpss 11 D. Sorosutan √ tpss 92 C. Hayam Wuruk x
tpss 12 D. DukuhBantul √ tpss 93 C. Mangunsarkoro √
tpss 13 D. Jati √ tpss 94 C. StasiunLempuyangan 1 √
tpss 14 C. Komplek Balaikota x tpss 95 C. Stasiun Lempuyangan 2 √
Symbol Depots (D) and
tpss 16 C. RS Wirosaban √ tpss 97 C. Argolobang √
tpss 17 C. Kebun Raya Gembiraloka √ tpss 98 C. Kusbini √
tpss 18 C. SGM √ tpss 99 C. Kawasan Bangunrejo x
tpss 19 C. Pasar Sore √ tpss 100 C. Kawasan Kricak x
tpss 20 C. StasiunTugu √ tpss 101 C. Wongsodirjan 2 x
tpss 21 C. Perempatan Tamansari √ tpss 102 C. Alun-Alun Selatan √
tpss 22 C. Bugisan x tpss 103 D. Pasar Kembang √
tpss 23 C. Alun-alun Utara √ tpss 104 D. Kridosono √
Note: Open (√), Closed (x)
Based on the results of Scenario 3, the op-timized system is achieved through the opera-tion of 15 depots and 20 containers in which 7 of previous containers, i.e., Komplek Balaikota, Bugisan, Kuboto Magelang, Utoroloyo, Bener, RRI Telomoyo, and RS Bethesda should be closed and 6 new containers should be opened
in Mangunsarkoro, Stasiun Lempuyangan 1, Stasiun Lepmpuyangan 2, Lapangan Karang, Argolobang, Alun-alun Selatan. The proposed optimized system offers the reduction of total cost by 37% and the increased utilization of 13% in comparison to existing system.
Table 5
Performance of Scenario 3
Performance Indicators Value Unit
Total cost Fixed cost
Transportation cost from waste sources to collection points
Transportation cost from collection points to landill
6,341,679
Undisplaced waste 0 m3
Capacity utilitization 99.6 %
sensitivity analysis
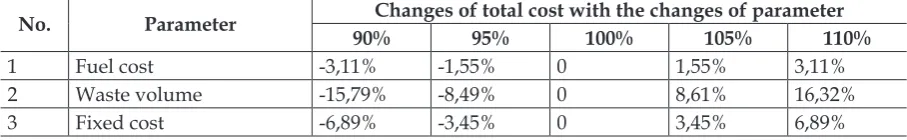
Sensitivity analysis is conducted to ex-amine the robustness of the model results due to the changes of input. Three variables such as fuel cost, waste volume, and ixed cost are selected for sensitivity analysis. Table 6 shows the results of sensitivity analysis which dem-onstrates that waste volume is the most
sen-sitive variable toward the total cost of waste management system. It implies that, among the examined parameters, waste volume gives the greatest inluence. The waste volume in-crease by 5% results in the inin-crease total cost of 8.6%. Surprisingly, fuel cost appears to be the least sensitive parameter.
Table 6
Sensitivity analysis on the total cost
No. Parameter Changes of total cost with the changes of parameter
90% 95% 100% 105% 110%
1 Fuel cost -3,11% -1,55% 0 1,55% 3,11%
2 Waste volume -15,79% -8,49% 0 8,61% 16,32%
Figure 5
Locations of depots (purple circle), containers (yellow circle) and aggregated waste sources (blue
circle)(For interpretation of the references color in this igure legend, the reader is referred to the web
version of the article)
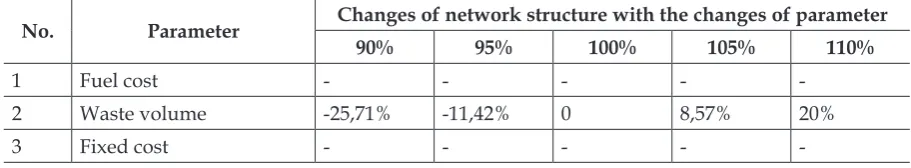
With respect to network structure, Table 7 indicates that only waste volume appears to be inluential, where both fuel cost and ixed cost are found to be insensitive. In general, the total cost as well as the network structure may be changing by the change of waste volume. It
Table 7
Sensitivity analysis on the network structure
No. Parameter Changes of network structure with the changes of parameter
90% 95% 100% 105% 110%
1 Fuel cost - - - -
-2 Waste volume -25,71% -11,42% 0 8,57% 20%
3 Fixed cost - - - -
-Although the result of the study seems promising, it is worth to discuss limitation of the model. As the model neglects permanent polling stations, the result of the study should be intepreted with care. Excluding permanent polling stations may result in that the distance between waste sources to waste collection points is too far. Future study should therefore addresses this issue. Furthermore, potential study should also work on optimizing the sys-tem including depots, containers, and perma-nent polling stations once the permaperma-nent pol-ling stations are not avoidable.
CONCLUsION
Uneven capacity utilization of waste collection points indicate that current waste management system needs to be evaluated and redesigned. However, the evaluation and redesigned efforts have been unobstracted by lack of decision tool. The present research con-tributes to evaluate current waste management system and proposed an optimized system. Results indicate that current waste manage-ment system is corresponding to the total cost of about 10 million and capacity utilization of 88%. Using Mixed Integer Linear Program-ming, the results proposed that the optimum system with no permanent polling system can be achieved through the operation of 15 depots and 20 containers. Of 15 depots, 2 new depots are added. Of 15 containers, 7 of previous con-tainers are closed, whereas 6 new concon-tainers are opened. The optimized system corresponds to 37% reduced total cost and 13% of increased capacity utilization in compariso to those of existing system. Waste volume apperas to be inluential factor on the total cost and the net-work structure of the system.
BIBLIOGraPhY
Agha, S. R., 2006, Optimizing Routing of Municipal Solid Waste Collection Vehicles in Deir El-Balah – Gaza Strip, The Islamic University Journal, 14(2), 75-89.
Aremu, A., S., 2011, Optimization and
Assessment of Waste Bin Locations
Using Geographic Information System, available online: http://www. unilorin.edu.ng/publications/ asaremu/13_AremuConf_2011.pdf, accessed on June 2013.
BadanPusatStatistik, 2010, Laporan Eksekutif Hasil Sensus Penduduk 2010 Provinsi
Daerah Istimewa Yogyakarta, Badan Pusat Statistik Kota Yogyakarta, Yogyakarta.
Bhambulkar, A. V., 2011, Municipal Solid Waste Collection Routes Optimized With ArcGis Network Analyst,
International Journal of Advanced
Engineering Sciences and Technologies, 11(1), 202-207.
Karadimas, N.,Kolokathi, M., and Loumos, V, 2007, Municipal Waste Collection of Large Items Optimized with ArcGis Network Analyst, Proceedings 21st
European Conference on Modelling and Simulation, 4-6 June 2007, Prague, Czech Republic.
Prastawa, D. M., 2012, Optimasi Rute
Pengambilan Sampah Berbasis Vehicle
Routing Problem, Undergraduate thesis,Fakultas Teknik Universitas Gadjah Mada, Yogyakarta.
Tjandra, S. A., Erkut, E., Karagiannidis, A., dan Perkoulidis, G., 2006, A Multicriteria Facility Location Model for
Municipal Solid Waste Management in North Greece, European Journal of Operation Research, 187(3), 1402-1421. Yogyakarta Environmental Agency, 2013,