2,5 10 Pembaca yang terhormat,
Puji syukur kami panjatkan kepada Tuhan Yang Maha Esa karena atas rahmat-Nya, Jurnal Ecolab Volume 7 Nomor 1 Tahun 2013 telah terbit. Mulai penerbitan Volume 4 Nomor 2 Tahun 2010, Jurnal Ecolab mengalami perubahan sebagai berikut.
Pertama, perubahan warna pada logo kalpataru disesuaikan dengan warna logo baru Kantor Kementerian Lingkungan Hidup. Kedua, substansi tulisan yang dimuat tidak terbatas pada hasil pemantauan, tetapi juga kajian ilmiah yang mencakup aspek lingkungan hidup.
Dalam penerbitan edisi ini, Jurnal Ecolab memuat lima tulisan dengan judul sebagai berikut: • Komponen Kimia PM dan PM di Udara Ambien di Serpong –Tangerang • Dinamika Penerimaan Sosial Terknologi Biogas di Komunitas Pedesaan Iindonesia:
Studi Kasus di Daerah Istimewa Yogyakarta
• Relasional Data Penginderaan Jauh Dengan Gradasi Temperatur di Taman Nasional Gunung Pangrango
• Efektivitas Arang Aktif Diperkaya Mikroba Konsorsia Terhadap Residu Insektisida Lindan dan Aldrin di Lahan Sayuran
• Analisa Pengaruh Letusan Abu Vulkanik Gunung Marapi di Sumatera Barat Terhadap Pengukuran Gas (SO ) dan Partikel (PM dan SPM) di Stasuin Pemantau Atmosfer
2 10
Global Bukit KotoTabang
Kami mengharapkan partisipasi para pembaca dan praktisi di bidang lingkungan hidup untuk turut serta menyajikan tulisan mengenai kajian-kajian yang berkaitan dengan aspek lingkungan hidup untuk terbitnya jurnal ecolab selanjutnya.
Terimakasih.
Salam, Redaksi
2,5 10
2 10
Jurnal Kualitas Lingkungan Hidup Volume 7, Nomor 1, Januari 2013
DAFTAR ISI
Kata Pengantar ... i
Daftar Isi ... iii
Komponen Kimia PM dan PM di Udara Ambien di Serpong –Tangerang ... 1 Rita Mukhtar, Esrom Hamonangan, Hari Wahyudi, Muhayatun Santoso dan Syukria Kurniawati
Dinamika Penerimaan Sosial Terknologi Biogas di Komunitas Pedesaan Iindonesia:
Studi Kasus di Daerah Istimewa Yogyakarta ... 8 Meredian Alam dan Niken Budi Pratiwi
Relasional Data Penginderaan Jauh Dengan Gradasi Temperatur
di Taman Nasional Gunung Pangrango ... 18 Wiweka, Sri Handoyo, John Hendrick B, dan Samsul Arifin
Efektivitas Arang Aktif Diperkaya Mikroba Konsorsia
Terhadap Residu Insektisida Lindan dan Aldrin di Lahan Sayuran... 27 E.Srihayu Harsanti, Indratin, Sri Wahyuni, Eman Sulaeman, dan A.N. Ardiwinata
Analisa Pengaruh Letusan Abu Vulkanik Gunung Marapi di Sumatera Barat Terhadap Pengukuran Gas (SO ) dan Partikel(PM dan SPM) di Stasuin Pemantau
Atmosfer Global Bukit KotoTabang……….…... 37 Agusta Kurniawan
1 PUSARPEDAL – Kementerian Lingkungan Hidup Gd. 210 Kawasan Puspiptek Serpong T/F:021-7560983 E.mail: [email protected] 2 PTNBR – Pusat Teknologi Nuklir Bahan dan Radiometri- Badan Tenaga Nuklir Nasional, Jl.Tamansari No.71 Bandung 40132
Telp.022-2503997 Fax.022-2504081 E-mail:[email protected]
KOMPONEN KIMIA PM
2,5DAN PM
10DI UDARA AMBIEN
DI SERPONG –TANGERANG
CHEMICAL COMPONENT OF PM
2.5AND PM
10IN AMBIENT AIR
AT SERPONG –TANGERANG
Rita Mukhtar1), Esrom Hamonangan1), Hari Wahyudi1), Muhayatun Santoso2), Syukria Kurniawati2)
(Diterima tanggal 15-11-2011; Disetujui tanggal 14-03-2012)
ABSTRAK
Komponen Kimia PM2,5 dan PM10 Di Udara Ambien di SERPONG. Partikel yang terkandung di udara ambien umumnya berukuran 0,1 – 50 µm atau lebih. Parameter utama partikel pencemaran udara yang memiliki dampak
signifikan pada kesehatan adalah partikel udara dengan ukuran diameter 2,5 µm atau kurang. Partikel udara yang berukuran kurang dari 2,5 µm (PM2,5) disebut dengan partikel halus, dan PM10 adalah partikel udara yang beruku-ran kuberuku-rang dari 10 µm. Beberapa peneliti epidemiologi berpendapat bahwa partikel udara halus sangat berbahaya karena dapat berpenetrasi menembus bagian terdalam dari paru-paru dan sistem jantung, menyebabkan gangguan kesehatan di antaranya infeksi saluran pernafasan akut, kanker paru-paru, penyakit kardiovaskular bahkan kematian. Partikel udara halus diperkirakan dapat memberikan kontribusi besar pada angka kematian yang diakibatkan oleh gangguan kesehatan terkait pencemaran udara. Partikel udara halus umumnya berasal dari sumber antropogenik seperti kendaraan bermotor, pembakaran biomassa, pembakaran bahan bakar. Pengambilan sampel untuk mengukur konsentrasi PM2,5 dan PM10 dengan menggunakan alat GentStacked Filter Unit sampler. Lokasi pengambilan sampel di Pusat Sarana Pengendalian Dampak Lingkungan (Pusarpedal) Kawasan Puspiptek Serpong. Pelaksanaan sam-pling 2-3 kali seminggu pada periode tanggal 11 September – 29 Desember 2008, 10 Februari-30 Juli 2009, dan 14-23 Juli 2010. Konsentrasi PM2,5 dan PM10ditentukan dengan prinsip gravimetri dan penentuan unsur dilakukan menggunakan metode analisis aktivasi neutron (AAN) atau particle-induce X-ray emission (PIXE). Hasil analisis didapatkan konsentrasi rerata partikel halus PM2.5 di Serpong pada tahun 2008 adalah 15.72 ± 7 µg/m3, tahun
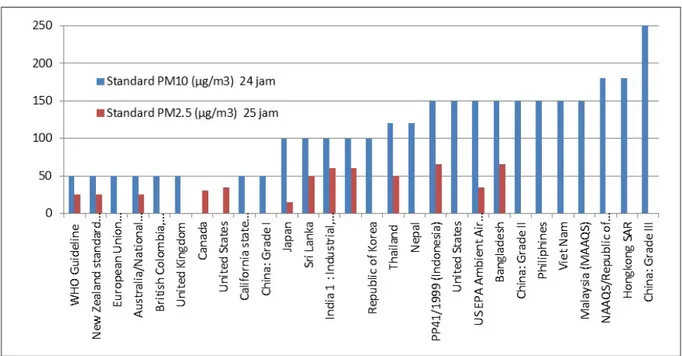
2009 adalah 15.61± 5 µg/m3, dan tahun 2010 adalah 20.26 ± 6 µg/m3. Konsentrasi ini belum melewati nilai batas
ambang harian PM2.5 di Indonesia yaitu 65 µg/m3, akan tetapi nilai tersebut telah mendekati nilai rata-rata tahunan
sebesar 15 µg/m3 yang tercantum didalam Lampiran Peraturan Pemerintah Republik Indonesia No. 41/1999 tentang
baku mutu udara ambien nasional. Konsentrasi rerata PM10 di Serpong pada tahun 2008 adalah 31.17 ± 13.7 µg/ m3, tahun 2009 adalah 30.9 ± 11.5 µg/m3, dan tahun 2010 adalah 34.18 ± 7.2 µg/m3. Kandungan komponen kimia
atau unsur pada PM2,5 dan PM10dengan menggunakan PIXE, adalah: Pb, Al, Na, Fe, K, Cl, Mg, Si, S, Ca, Sc, Ti, V, Cr, Mn, Co, Cu, Ni, Zn, As, Se, Br, Ba, P, dan Hg dengan rata-rata konsentrasi PM2,5 masing-masing adalah ; 228.6, 80.6, 111.9, 46.8, 139.9, 33.0, 45.1, 150.3, 769.9, 37.8, 1.2, 3.3, 1.3, 1.5, 2.9, 0.5, 2.0, 0.8, 40.5, 6.6, 1.2, 3.4, 4.2, 21.5, dan 2.3 ng/m3. Dan rata-rata konsentrasi PM
10 masing-masing adalah ; 331.6, 554.4, 482.3, 361.0, 268.2,
301, 176.1, 1108.3, 1089.9, 426, 5.7, 32, 3.7, 3.6, 12.9, 2.3, 6.3, 2.0, 87, 15.4, 4.6, 5.1, 7.3, 105.4, dan 7.8 ng/m3.
Kata kunci: Partikel Udara, Komponen Kimia, PM2.5, PM10, Gent Stacked Filter Unit sampler, PIXE
ABSTRACT
CHEMICAL COMPONENT OF PM2.5 AND PM10 IN AMBIENT AIR AT SERPONG –TANGERANG. Particles
in the atmosphere generally sized from 0.1 to 50 μm or more. The existence time of Particles in the atmosphere
varies depending on the size. One of the main parameters of air pollution is particulate matter (PM). Fine particles
is particulate matter with diameter less than 2.5 μm (PM2.5) whereas PM10 is particulate matter with diameter less
than 10 μm. Fine particle is very dangerous because it can penetrate through the deepest parts of the lungs and cardiovascular system, causing health problems include acute respiratory infections, lung cancer, cardiovascular disease and even death. Fine particulate matter can make a major contribution to the number of deaths from air pollution-related health problems. Fine particles are generally comes from anthropogenic sources such as motor
PENDAHULUAN
Total Suspended Partikulat (TSP) merupakan partikel atau aerosol <100µm partikel kasar tersaring dalam sistem pernafasan atas. PM10 partikel halus berdiameter hingga 10µm dapat masuk kedalam sistem pernafasan, PM2.5 partikel sangat halus dibawah 2.5µm yang dapat masuk ke dalam jaringan dalam paru-paru sehingga dapat menyebabkan gangguan kesehatan, seperti ISPA, gejala anemia, penyakit jantung, hambatan dalam pertumbuhan, sistem kekebalan tubuh yang lemah, gejala autis, kanker paru-paru, bahkan kematian dini.
Pada umumnya partikel yang terdapat didalam PM2.5 mengandunglogam berat lebih tinggi dibanding dengan partikel yang terdapat pada filter kasar (PM2.5-10)4). Logam
berat yang masuk kedalam pernafasan kemudian menembus kebagian dalam paru-paru manusia. Efek yang terjadi tergantung pada jumlah dan tempat absorpsi, sifat
kimiawi-fisis racun, misalnya silika sangat reaktif bereaksi dengan sel paru-paru sehingga
rusak dan terbentuk jaringan ikat atau fibrosis
yang sifatnya progesif, sekalipun silika sudah tidak bertambah jumlahnya, karbon bersifat inert, tidak akan bereaksi hanya terkumpul
vehicles, biomass burning, fuel combustion.Sampling of airborne particulate matter has been done in Serpong,
located in Environmental Management Center (EMC), Puspiptek Serpong area using a Gent Stacked Filter Unit sampler. Sampling was carried out 2-3 times a week from the year 2008 to 2010. Concentrations of PM2.5 and PM10
was determined by gravimetric method and elemental analysis was performed using particle-induce X-ray emission
(PIXE). The results shows the mean concentration of PM2.5 in Serpong in 2008, 2009 and 2010 are 15.7±7, 15.6±5
and 20.3±6 μg/m3, respectively. The concentrations are exceed the national standarad annual average value of 15
μg/m3 in Indonesian Government Regulation No. 41/1999. Average concentrations of PM
10 in Serpong during 2008,
2009 and 2010 are 31.2 ± 13.7; 30.9 ± 11.5 and 34.2 ± 7.2 μg/m3, respectively. Elemental analysis in the PM
2.5 and
PM10 using PIXE, 24 elements Pb, Al, Na, Fe, K, Cl, Mg, Si, S, Ca, Sc, Ti, V, Cr, Mn, Co, Cu, Ni , Zn, As, Se, Br, Ba,
P, and Hg were detected. The mean concentrations of these elements in the PM2.5 are 229, 80.6, 112, 46.8, 140, 33,
45.1, 150, 770, 37.8, 1.2, 3.3, 1.3, 1.5, 2.9, 0.5, 2.0, 0.8, 40.5, 6.6, 1.2, 3.4, 4.2, 21.5 and 2.3 ng/m3 . The average
concentration of elements in PM10 are 332, 554, 482, 361, 268, 301, 176, 1108, 1090, 426, 5.7, 32, 3.7, 3.6, 12.9,
2.3, 6.3, 2.0, 87, 15.4, 4.6, 5.1, 7.3, 105 and 7.8 ng/m3.
Keywords: Particulate matter, PM2.5, PM10, Gent Stacked Filter Unit sampler, PIXE
didalamnya. Logam lainnya seperti Cr, Be, Cd, Cu, Fe, Pb, Ni, Se, Ti, Te,V dapat menimbulkan tumor/kanker. Kontribusi faktor lingkungan adalah penyebab utama timbulnya penyakit5).
Pusat Sarana Pengendalian Dampak Lingkungan (PUSARPEDAL) adalah merupakan salah satu unit kerja yang ada dibawah Kementerian Lingkungan Hidup (KLH) yang telah menjalin kerjasama sejak tahun 2008 dengan BATAN khususnya kelompok Teknik Analisis Radiometri dalam penelitian kajian dan monitoring pencemaran udara.
Pada makalah ini dilakukan pengukuran PM2.5 dan PM10 didalam contoh uji udara ambien di daerah Serpong-Tangerang serta karakterisasi beberapa unsur ; Pb, Al, Na, Fe, K, Cl, Mg, Si, S, Ca, Sc, Ti, V, Cr, Mn, Co, Cu, Ni, Zn, As, Se, Br, Ba, P, dan Hg yang terkandung di dalamnya.
Sampel diambil menggunakan alat Gent Staked Filter Unit sampler pada tanggal 11 September- 29 Desember 2008, 10 Februari-30 Juli 2009, dan 14-23 Juli 2010. Pengukuran PM danPM dilakukan dengan
cara gravimetri dan analisis sampel dilakukan menggunakan teknik analisis nuklir, Particles Induced X-ray Emmission (PIXE). Hasil yang diperoleh diharapkan dapat memberi kontribusi, mendukung dan mendorong pemerintah untuk membuat kebijakan yang tepat dan terarah dalam upaya meningkatkan kualitas udara di Indonesia agar gangguan kesehatan dan kerugian ekonomi yang lebih besar dapat dihindari.
1. METODOLOGI 1.1 Sampling
Pengambilan contoh uji (sampling) menggunakan alat Gent stacked filter unit
sampler pada ketinggian ±8 meter diatas dak Gedung 210/Pusarpedal yang berada di Kawasan Puspiptek Serpong-Tangerang. Sampling dilakukan 2-3 kali dalam satu minggu pada tanggal 11 September – 29 Desember 2008, 10 Februari-30 juli 2009, dan 14-23 Juli 2010. Sampling dilakukan selama 24 jam dengan laju alir sekitar 15-18 L/min. Alat Gent stacked filter unit sampler terdiri dari dua filter, yaitu filter jenis Nuclepore polikarbonat yang ukuran pori filter 0,4μm yang disebut dengan filter halus (fine) yang akan digunakan untuk penentuan PM2,5. Disamping itu ada filter yang berukuran pori 8μm selanjutnya disebut filter kasar/coarse, yang digunakan untuk penentuan PM2,5-10. Jika PM2.5 digabung dengan PM2,5-10. Maka diperoleh nilai PM10.5)
1.2 Analisis Contoh Uji
Penentuan konsentrasi PM2,5 menggunakan metode gravimetri, yaitu konsentrasi ditentukan dari hasil pengurangan
penimbangan berat sampel pada filter halus dengan berat filter halus kosong. Sebelum dilakukan penimbangan, filter dikondisikan pada ruangan bersih dengan temperatur 18-25oC dan kelembaban maksimum kurang dari
55%.
Analisis contoh uji dilakukan dengan menggunakan teknik analisis nuklir, Particles Induced X-ray Emmission (PIXE), menggunakan fasilitas yang terdapat di Institute of Geological and Nuclear Sciences (IGNS), New Zealand. Analisis spectrum X-ray dilakukan menggunakan computer code GUPIX, sedang kalibrasi system PIXE dilakukan dengan mengiradiasi standar10).
Analisis dilakukan oleh PTNBR-Batan bandung.
2. HASIL DAN PEMBAHASAN
Hasil analisis menunjukkan konsentrasi rerata partikel halus PM2.5 di Serpong pada tahun 2008 adalah 15.72 ± 7 µg/m3, tahun 2009
adalah 15.61± 5 µg/m3, dan tahun 2010 naik
menjadi 20.26 ± 6 µg/m3.
Meskipun konsentrasi ini belum melewati nilai batas ambang harian PM2.5 di Indonesia yaitu 65 µg/m3, akan tetapi nilai tersebut telah
mencapai nilai rata-rata tahunan sebesar 15 µg/m3 yang tercantum didalam Lampiran
Peraturan Pemerintah Republik Indonesia No. 41/1999 tentang baku mutu udara ambien nasional1).
Dengan alat dan metode yang sama, nilai PM2.5 di Serpong tahun 2010 sama dengan nilai PM2.5 di Bandung pada tahun 20064. Dalam hal
ini upaya pemerintah sangat diperlukan untuk mengurangi konsentrasi PM2.5 di Serpong.
Grafik 1. Rerata PM2.5 di Udara Ambien di Serpong dan di Bandung
Grafik 2. Konsentrasi PM2.5 dan PM10 di Udara Ambien di Serpong
Hasil analisis konsentrasi rerata partikel (PM10)di Serpong pada tahun 2008 adalah 31.17± 13.7 µg/m3, tahun 2009 adalah 30.9
± 11.6 µg/m3, dan tahun 2010 naik menjadi
34.18 ± 7.2 µg/m3.
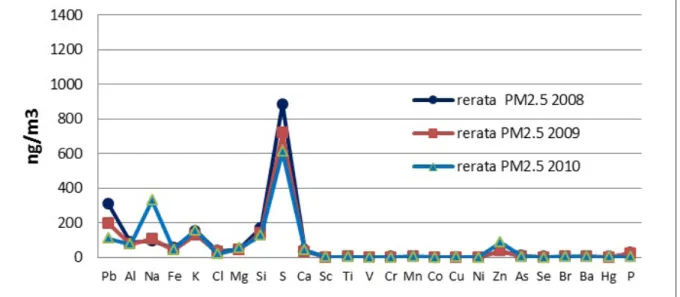
Konsentrasi rerata beberapa unsur Pb, Al, Na, Fe, K, Cl, Mg, Si, S, Ca, Sc, Ti, V, Cr, Mn, Co, Cu, Ni, Zn, As, Se, Br, Ba, P, dan Hg pada PM2.5
Grafik 4. Rerata Konsentrasi Beberapa Unsur pada PM2.5 di Udara Ambien di Serpong
diudara ambien tahun 2008-2010 di Serpong adalah 228.6, 80.6, 111.9, 46.8, 139.9, 33.0, 45.1, 150.3, 769.9, 37.8, 1.2, 3.3, 1.3, 1.5, 2.9, 0.5, 2.0, 0.8, 40.5, 6.6, 1.2, 3.4, 4.2, 21.5, dan 2.3 ng/m3, serta konsentrasi rerata unsur pada
PM10 adalah 331.6, 554.4, 482.3, 361.0, 268.2, 301, 176.1, 1108.3, 1089.9, 426, 5.7, 32, 3.7, 3.6, 12.9, 2.3, 6.3, 2.0, 87, 15.4, 4.6, 5.1, 7.3, 105.4, dan 7.8 ng/m3.
Dari Beberapa unsur yang diteliti didalam PM2.5
dan PM10diperoleh 10 nilai rerata konsentrasi unsur yang lebih tinggi dibandingkan dengan unsur lainnya. Unsur tersebut adalah; Timbal (Pb), Aluminium (Al), Natrium (Na), Besi (Fe), Kalium (K), Klorida (Cl), Silika (Si), Sulfur (S), Kalsium (Ca), serta Seng (Zn). Konsentrasi yang kecil bukan berarti tidak berbahaya, karena masing-masing unsur mempunyai tingkat toksisitas berbeda-beda. Beberapa unsur seperti timbal dan merkuri, walaupun dalam jumlah yang sedikit memiliki tingkat toksik dan efek yang berbahaya. Timbal akan merusak jaringan syaraf, menurunkan IQ, dan merkuri dapat menyebabkan penyakit Minamata diseases.
Partikel di udara dengan ukuran 2.5 µm dapat melayang dan terbang sampai ke negara tetangga. Hal ini telah dibuktikan oleh Batan dalam kasus kebakaran hutan di Australia yang dapat mencapai Indonesia yaitu Bandung10.
Keberadaan PM2.5 di serpong diduga berasal dari pembakaran aki bekas yang banyak dilakukan oleh sekelompok orang di sekitar
Konsentrasi Rerata ng/m3 SD min max Konsentrasi Rerata ng/m3 SD min max Konsentrasi Rerata ng/m3 StDev SD max Konsentrasi Rerata ng/m3 SD min max Konsentrasi Rerata ng/m3 SD min max Konsentrasi Rerata ng/m3 SD min max Pb 311.0 435.9 16.6 2057.5 443.7 534.6 32.8 2357 198.9 255.7 16.6 1308.8 289.2 318.5 4.4 1453.7 110.6 149.6 16.6 404.8 142.5 173.4 22.2 485.8 Al 88.6 40.5 16.2 194.6 565.0 277.0 165.0 1202 76.3 37.4 16.2 262.0 569.3 265,3 99.1 1118.8 75.6 13.4 16.2 88.5 381.6 105.6 254.1 537.3 Na 97.2 63.9 30.0 259.9 429.5 244.0 45.5 908.0 106.8 62.9 30.0 272.7 457.9 235.1 67.7 1121.8 330.8 107.2 30.0 464.6 941.3 200.0 635.9 1171.8 Fe 53.2 28.8 1.6 120.4 366.4 190.7 91.1 765.2 42.8 22.5 1.6 142.8 358.9 179.4 44.7 692.5 46.8 12.1 1.6 60.3 351.5 113.1 193.3 463.9 K 153.5 51.8 7.3 263.3 279.2 93.3 128.5 464.7 129.1 42.0 7.3 241.9 259.9 84.8 93.1 517.5 159.2 24.3 7.3 189.6 280.3 38.5 221.9 343.7 Cl 37.8 18.2 9.3 123.9 375.4 206.9 116.2 958.5 31.6 24.2 9.3 180.1 276.9 192.1 71.9 793.6 20.1 6.7 9.3 26.6 132.2 22.2 113.5 174.7 Mg 45.6 14.1 28.7 77.5 176.0 56.8 92.6 305.8 43.6 10.2 28.7 68.3 180.9 56.8 72.4 289.7 53.9 6.1 28.7 60.4 138.0 19.7 114.8 169.6 Si 170.3 74.9 11.0 357.1 1146.2 552.7 331.6 2329.1 140.8 75.1 11.0 565.7 1119.3 515.6 180.3 2164.8 126.2 21.9 11.0 154.2 831.0 232.7 522.1 1133.3 S 883.9 368.3 11.2 1532.7 1194.8 494.0 235.2 2230.2 718.5 281.6 11.2 1496.2 1059.8 399.9 225.2 2054.8 611.5 115.8 11.2 843.6 806.0 86.3 676.9 967.3 Ca 41.9 21.6 6.7 95.8 401.6 208.9 102.7 906.1 34.5 24.2 6.7 166.1 439.5 225.5 62.3 856.4 42.6 12.0 6.7 53.6 440.3 146.6 232.2 624.6 Sc 1.4 1.3 6.0 4.5 5.4 3.1 0.5 12.2 1.2 0.9 6.0 3.1 5.7 3.8 0.1 19.5 4.1 1.7 6.0 5.5 6.8 4.1 1.2 12.4 Ti 3.8 3.4 4.9 11.7 31.6 18.3 6.9 72.5 3.0 2.9 4.9 14.8 32.4 16.7 3.4 63.5 4.1 2.2 4.9 6.2 30.6 12.7 14.1 50.7 V 1.9 2.0 4.3 8.1 4.0 2.9 0.4 10.5 1.1 1.2 4.3 6.1 3.6 3.0 0.1 17.5 1.0 0.3 4.3 1.3 2.6 1.5 1.4 4.2 Cr 1.9 1.0 2.9 4.2 3.6 2.1 1.1 9.2 1.4 1.1 2.9 5.3 3.6 2.4 0.1 10.8 1.8 1.2 2.9 3.5 3.6 2.6 1.0 7.8 Mn 2.8 2.1 2.4 7.8 12.5 6.7 1.2 25.9 2.5 1.9 2.4 7.3 12.3 7.4 0.5 30.7 6.6 3.1 2.4 11.2 19.1 5.7 11.8 28.2 Co 0.7 0.8 1.9 2.8 2.7 1.6 0.6 6.2 0.4 0.6 1.9 2.7 1.9 1.5 0.3 5.3 0.7 1.3 1.9 3.4 4.4 2.9 1.1 7.9 Cu 1.7 1.4 1.9 5.6 4.6 3.2 0.4 16.6 1.8 2.0 1.9 9.6 6.8 4.6 0.6 18.3 4.4 3.5 1.9 8.5 9.5 3.7 5.0 15.3 Ni 1.2 1.3 1.6 4.6 2.4 2.1 0.8 8.9 0.7 0.8 1.6 4.0 1.7 1.1 0.3 4.4 0.5 0.9 1.6 2.3 2.5 1.9 0.7 5.0 Zn 38.4 30.0 2.4 150.5 75.7 57.6 1.8 256.3 35.8 27.9 2.4 168.6 81.7 56.0 4.0 300.1 89.1 47.7 2.4 165.2 186.3 108.6 87.1 362.3 As 7.8 7.5 6.3 19.6 17.8 9.6 3.9 43.1 6.0 8.4 6.3 44.3 14.0 10.0 2.3 44.3 7.1 7.6 6.3 22.4 14.4 7.7 5.4 22.4 Se 2.5 3.1 6.8 10.7 5.2 2.3 2.8 12.4 0.8 1.5 6.8 5.7 4.1 1.9 1.3 7.6 0.0 0.0 6.8 0.0 - - - -Br 3.4 4.0 10.8 12.5 4.2 5.7 0.0 19.7 3.2 3.5 10.8 11.3 5.5 4.3 0.0 18.0 5.2 6.6 10.8 14.8 6.5 6.3 0.0 14.8 Ba 5.2 5.4 19.5 18.9 5.9 6.6 0.0 20.1 3.9 5.0 19.5 25.1 7.6 6.4 0.0 35.8 3.2 3.7 19.5 9.4 12.5 14.4 0.0 42.2 Hg 3.9 5.6 11.3 17.8 9.4 5.9 2.1 25.2 1.4 2.6 11.3 9.5 6.2 3.9 1.8 17.6 3.0 5.1 11.3 11.3 12.8 7.4 6.3 20.8 P 26.2 10.1 16.7 46.7 107.1 25.6 51.2 177.3 21.7 13.3 16.7 82.1 114.4 36.6 35.4 199.3 3.4 2.5 16.7 5.8 24.3 7.0 14.6 33.5 2008 2009 2010 PM2.5 PM10 PM2.5 PM10 PM2.5 PM10 Unsur
Tabel 1. Konsentrasi rerata unsur pada PM2.5 dan PM10 di Serpong-Tangerang th. 2008-2010
Serpong. Pembakaran dilakukan di dekat perkebunan, dan dilakukan pada malam hari. Menurut hasil survai ke lapangan dan keterangan masyarakat, kegiatan ini sudah lama dilakukan2-3). Dalam hal ini
pemerintah setempat diharapkan dapat lebih memperhatikan lingkungannya, sehingga peredaran aki bekas sebagai bahan baku yang dibakar secara konvensional perlu diawasi. Sosialisasi mengenai bahaya pembakaran aki bekas tanpa penanganan khusus perlu dilakukan, agar masyarakat mengetahui dampak dari kegiatan yang dilakukan.
3. SIMPULAN
Konsentrasi partikel halus (PM2.5) dan PM10 di Serpong yang dilakukan dalam pada rentang tanggal 11 September-29 Desember 2008, 10 Februari-30 Juli 2009, dan 14-23 Juli 2010 menggunakan alat sampling Gent Staked Filter Unit sampler, dengan metode gravimetri diperoleh hasil bahwa konsentrasi PM2.5 dan PM10 dari th. 2008- 2010 semakin meningkat.
Dari 25 unsur yang diteliti didalam PM2.5 dan PM10diperoleh 10 nilai rerata konsentrasi unsur yang lebih tinggi dibandingkan dengan unsur lainnya. Unsur tersebut adalah; Timbal (Pb), Aluminium (Al), Natrium (Na), Besi (Fe), Kalium (K), Klorida (Cl), Silika (Si), Sulfur (S), Kalsium (Ca), serta Seng (Zn). Sumber yang menyebabkan hadirnya logam berat tersebut di udara ambien harus segera diatasi, agar kesehatan masyarakat dapat dilindungi. Hasil ini diharapkan dapat digu-nakan sebagai referensi berbasis ilmiah dalam merumuskan, mengambil tindakan dan kebija-kan yang tepat dan terarah untuk pengendalian pencemaran udara.
4. UCAPAN TERIMAKASIH
Penelitian ini terlaksana atas kerjasama PUSARPEDAL dengan PTNBR BATAN Bandung. Penulis juga mengucapkan terimakasih kepada seluruh personil bidang pemantauan Pusarpedal, dan kelompok teknik analisis radiometri Batan yang terlibat dalam sampling dan analisis pada kajian PM2.5 dan PM10 di udara ambien ini, serta semua pihak yang membantu terlaksananya kegiatan ini.
5. DAFTAR PUSTAKA
(1) Peraturan Pemerintah Republik Indonesia No. 41/1999 tentang Pegendalian pencemaran udara. (2) Pusarpedal. Laporan Kajian Timbal
di Serpong Tangerang dan Sekitarnya Tahun 2008.
(3) Pusarpedal. Laporan Kajian Timbal di Serpong Tangerang dan Sekitarnya Tahun 2009.
(4) Pusarpedal. Laporan Kajian Timbal di Serpong Tangerang dan Sekitarnya Tahun 2010.
(5) Philip R.S, Johnson, John J. Graham. Fine Particulate Matter National Ambient Air Quality Standards; Public Health Impact on Populations in the Norteastern United States. Environmetal Health Perspectivesehp03.niehs.nih.gov/.../ ehp.7822
(6) Muhayatun, Achmad Hidyat, Diah. Ambien Air Concentration of PM2,5 and PM10 in Bandung and Lembang in 2000-2006. Indonesian Journal of Science and Nuclear Technology 2008; X(1): 53-9
(7) M U H AYAT U N S A N T O S O , DIAH DWIANA LESTIANI, R I TA M U K H TA R , E S R O M HAMONANGAN, HALIMAH S Y A F R U L , A N D R E A S MARKWITZ, PHILIP K HOPKE, Preliminary Study of the Sources of Ambient Air Pollution in Serpong, Indonesia. Atmospheric Pollution Research (2) 2011, hal 190-196 (8) Edwar, J.D., Ogren, J.A., Weiss, R.A.,
and CHARLSON, R.J., Particle air pollutants, Atmos. Environ., 17 (1983) 2337-2341
(9) Trompetter.W.J. and Markwitz.A., Ion Bean Analysis Results of Air Particulate Filter from Indonesia, 2005
(10) Muhayatun Santoso, Diah Dwiana Lestianim David D. Cohen, Long-Range Transport Partikel Udara Halus di Bandung Indonesia. ISSN 2085 – 2797, hal 255
DINAMIKA PENERIMAAN SOSIAL TEKNOLOGI BIOGAS DI
KOMUNITAS PEDESAANINDONESIA: STUDI KASUS DI DAERAH
ISTIWEWA YOGYAKARTA
THE DYNAMIC OF SOCIAL ACCEPTANCE OF BIOGAS TECHNOLOGY
IN RURAL COMMUNITY OF INDONESIA: CASE STUDY OF
YOGYAKARTA SPECIAL REGION
Meredian Alam1,Niken Budi Pratiwi2
(Diterima tanggal 15-11-2011; Disetujui tanggal 14-03-2012)
1 Department of Sociology Faculty of Social and Political Sciences, Jln Socio-Yudisia No. 1 Bulaksumur, Sleman, Yogyakarta 55283.
E-mail: [email protected]
2 Center for Environment Studies, Gadjah Mada University, Jln. Kebudayaan, Sleman, Yogyakarta. E-mail: [email protected]
ABSTRAK
Kenaikan harga bahan bakar bensin dan LPG (Liquified Petroleum Gas) telah meningkatkan
kekhawati-ran di kalangan masyarakat lokal di pedesaan Indonesia, terutama mereka yang bekerja di industri lokal kecil. Situasi ini memotivasi masyarakat untuk menggunakan biogas sebagai pengganti bahan bakar alternatif dalam rangka mempertahankan industri kecil rumahan mereka dan ekonomi domestik karena
efisiensi biogas dianggap cukup terjangkau dan relatif aman. Selain itu, penggunaan biogas cocok dipakai di Indonesia karena jumlah ternak di daerah pedesaan memberikan kontribusi terhadap proses gasifikasi
kimia mengubah kotoran menjadi metana-gas di mesin fermentasi, yang nantinya dapat digunakan untuk memasak. Pengembangan gas di daerah pedesaan terutama didasarkan pada inisiatif masyarakat dengan bantuan dari Lembaga Swadaya Masyarakat dan pemangku kepentingan universitas, namun pemerintah daerah belum terlibat secara aktif. Tulisan ini mencoba untuk mengungkap faktor-faktor memfasilitasi dalam masyarakat dan beberapa perbaikan yang pemerintah daerah harus melakukan sebagai cara untuk mendukung ketahanan pangan dan mata pencaharian lokal. Partisipasi lokal di sini kemudian
diperhi-tungkan untuk pengoperasian biogas yang sukses.
Kata Kunci: biogas, energi terbarukan, komunitas
ABSTRACT
A rapid increase in gasoline and other LPG (Liquified Petroleum Gas) price has been raising concerns among lo
-cal communities in rural Indonesia, especially those who work in small lo-cal enterprises. This situation motivates people to use biogas as fuel replacement in order to improve their home industry and domestic economy as biogas is considered affordable enough and relatively safe. Other than this, the use of biogas is best utilized in Indonesia
because the total number of cattle in rural areas contributes to the/a reacting gasification processes by chemi
-cally converting the dung into methane-gas in fermentation machines, which later can be used for cooking. The development of gas in rural areas is mainly based on community initiatives with the assistance of Non-Government Organizations and university stakeholders, but the local government has not been actively involved. This paper
attempts to uncover the facilitating factors in communities and some improvements that local government must undertake as a way to support food security and local livelihoods. Local participation here is then taken into
ac-count for successful biogas operations
Keywords: biogas, renewable energy, community
1. INTRODUCTION
Although the government of Indonesia has
concerns from the community that will potentially make them collapsed if there is no feasible solution. The increase in LPG (Liquified Petroleum Gas) price and also oil, as researched by Wahyuni (2008), is regarded costly for the community and based on this, alternative renewable such biogas gain its importance. The use of biogas is essentially to improve community’s economic capacity and generate income as they are able to save money by reducing production costs. There are 12 714 181 cattles in the agricultural sector of Indonesia and they could feasibly provide ample inputs as biogas chemical activators (Directorate of Livestock Indonesia, 2010). Most of the cattle farms are situated in Yogyakarta Special Province, West Java, East Java, South Sumatra, and West Sumatra. By producing biogas, GHG (Green House Gas) emissions can be effectively reduced in the atmosphere, where methane counts for 70% among other GHG gases. It also has 21 times of the hazardous effect for human well-being compared to carbon dioxide (Widodo and Hendriadi, 2005). Larson and Kartha (2000) emphasize, the cycle of GHG effect can be gradually halted if dual efforts of using biogas and encouraging the locals to stop consuming fossil-based fuel. An estimation suggests that by 2050 almost 30% of the global primary energy consumption will be covered by regenerative energy sources (see Deublein & Steinhauser, 2008).
Indonesian energy consumption is dependent on oil and gas production. Although the oil and
gas industry has grown rapidly from 1970 to 2001, Abdullah (2005) argues that in 18 years, oil and gas will be depleted. The urgency of replacing oil usage should be inclusive in the government of Indonesia agenda as it is enshrined in the Kyoto Protocol, ratified on February 16 2005 (Wahyuni, 2008). The management of biogas under a renewable energy platform at the national level should be prioritized by the government to overcome energy scarcity3. The problem of financial
accessibility to such energy is mostly faced by the rural communities and therefore the policy implications should be directed in that way. Those problem become national prominence in Indonesia, thus by examining two different case studies about the following alternative energy implementation, this paper aims to analyze the facilitating dimension of biogas at the local level and the degree of government involvement in sustaining actions and local initiatives. The importance of examining the government involvement in environmental changes is to scrutinize how far their involvement in planning stage because government is ideally responsible for setting up policy that is compatible with local need. Further more, government action in biogas development is barely discussed in the research agenda. Barnet, et al (1978) state that building biogas technology must be facilitated by the active actions of local government and this is an important point to highlight. Embarking from this starting point, local participation as a core extent of development
3 As part of regional preparation of shared Asia Pacific Perspective on the issue for CSD-9 (UN Commissions on Sustainable Developmeny
its 9th session), the minister and heads of the delegations attending the High Level Meeting on Energy for Sustainable Development in Bali Indonesia 2000. The declaration together with Sustainable Development Action Program and Implementation Modalities for the Asia and
Pacific Region 2001-2005 serve as agenda for taking firm step toward sustainable development, but viable renewable technologies are not
is elaborated in the next section of the paper. Studies and policy implications are outlined to encourage a strategic system within the relations of government, community, and other stakeholders, presented in the developing countries setting.
2. BIOGAS OPERATION
Before continuing to examine the research sites, the environmental benefit of biogas is presented. Biogas as part of biomass was actually developed in pre-industrial times. However, it was a period where the complexity of human need had not been pushing forward consumption demand. Nevertheless, biogas remains suitable for the current need in developing countries to overcome energy scarcity (Reijenders, 2006). Each 1 cubic meter of biogas output is equal to 0.46 kg of LPG, 0.62 litre of kerosene (Wahyuni, 2008). In terms of cooking activities, it may contribute to 3 meals for a family of 5-6 members and replace 0.7 kg of petrol (www. paceproject.net). Basically, biogas consists of a mixture of roughly 65% of methane, 30%
carbon (COx), and 1% hydrogen sulfide (H2S) (Da Silva, 1980).
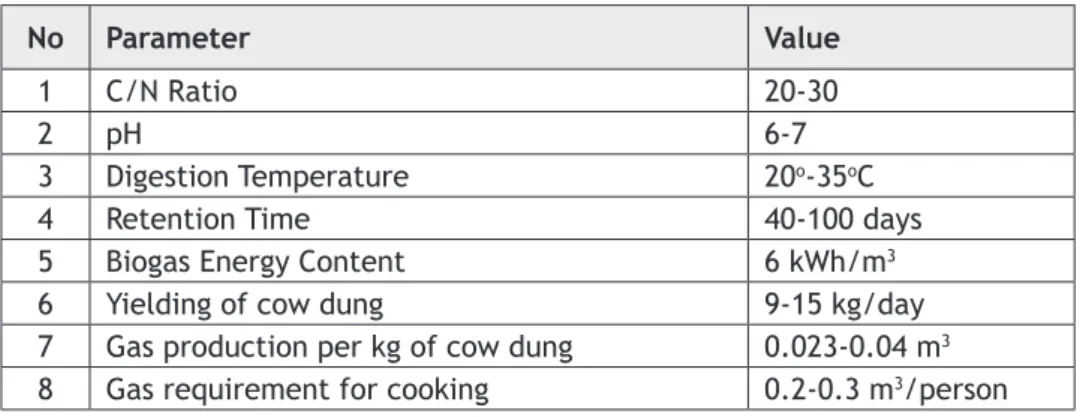
The design of biogas plants shall be comply to the technical requirements to allow its sustainability. As enshrined by Karki et al (2005), C/N Ratio, pH, Digestion Temperature, and Retention Time are four essential parameters to be taken into account. C/N Ratio is defined as proportion of carbon to nitrogen exist in the organic matter. The gas production is construed extractable if C/N ration is between 20 and 30. The pH is the measure of acidity/alkalinity of the input and it is neutral if reaching 7 while above 7 is alkaline. The gas output in must prevail the pH value of 6-7. Digestion temperature is related to the most suitable temperature of place where the biogas plants installed. The temperature between 20o-35oC is regarded
best fitted to enable gas production. Therefore, biogas technology is not feasible in a cold climate. The retention time is an average time that a given quantity of input remains in the digester (Karki et al 2005:13). The following table summarizes the technical requirement:
No Parameter Value
1 C/N Ratio 20-30
2 pH 6-7
3 Digestion Temperature 20o-35oC
4 Retention Time 40-100 days 5 Biogas Energy Content 6 kWh/m3
6 Yielding of cow dung 9-15 kg/day 7 Gas production per kg of cow dung 0.023-0.04 m3
8 Gas requirement for cooking 0.2-0.3 m3/person
Source: Karki et al (2005
3. RESULT AND ANALYSIS
Two different implementations and biogas practices are discussed to compare the characteristics of local participation, government involvement, and emergence of other stakeholders such as a university providing technical assessments. Banyakan village research site I (see map below- blue
dot) shows that biogas is used for domestic uses and by the local government, including the head of county and the village chief. The community in Manis Renggo, as research site II (see map below- orange dot),
have more capabilities in biogas usage to leverage productivity. The local government especially represented by the village chief support the local initiatives by performing regular consultation with the Gadjah Mada University experts on biogas technology The location is determinant to what kind of biogas plant is used by the community. Banyakan is situated in Bantul district which was severely devastated by the earthquake in 2006 and so the digester is made of PVC pipes which are considered durable against future earthquakes.
Figure 1. Position of research sites.
3.1 Research Site I-Banyakan Village
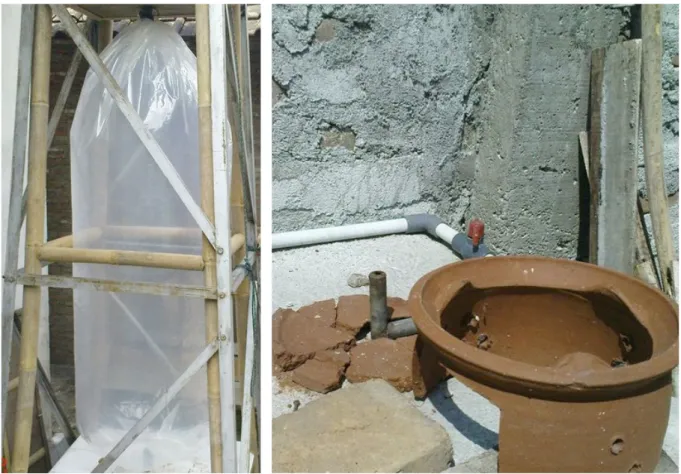
Banyakan village was one of the areas most devastated by the earthquake in 2006, as most of the local settlements were ruined. Biogas was introduced in this village after that disaster by Gadjah Mada University Indonesia, which was supported by JICA (Japan International Cooperation Agency) in order to recover economic livelihoods. The introductory stages began with the provision of more than 10 cattle to the local community and studies in the same community gathering data to assess people’s way of surviving and their well-being. In this process, Gadjah Mada University Indonesia under the implementation of Community Empowerment and Fieldwork (CEF) attempted to improve community knowledge about the economic benefits of what biogas can provide,. The local facilitator is deployed to also leverage awareness and provided an understanding that the bad smells associated with cow dung are produced by aired methane-gas, which is considered hazardous to the lungs. At first placement, each of the households were offered the biogas equipment, such as 4 meters of pipe connected to with a digester, which cost around IDR 1.250.000 (though it depends on the needs of each household). It may cost IDR. 3.000.0000. Facilitators of the Gadjah Mada University first attempted to use cemented pipe, which was also implemented in Pundong village. However, it cannot sustain endured due to debilitating earthquakes. Responding to it, another biogas plant type with semi-ceramic fabricated pipes is introduced. The operating procedure is actually simpler than as imagined. 2 kg of cow-dung are inserted in the digester and mixed with a litre of water to ensure that
the fermentation occurs. After 1-2 weeks, the biogas can be used for cooking and it is contained in the big plastic bag which can be just be compressed by a wooden stick before cooking starts.
The plastic used as a gas container is considered affordable enough because it is only IDR 25.000 for 25 meter long piece and when it is broken, each household can just purchase it at nearby construction agencies in the Bantu region. The benefit of biogas is well perceived by the local community, though only 12 households utilize it in addition to maintaining their cattle. Every 1m3 of biogas
can replace is equivalent to approximately 600 watts (1 hour usage). Regarding the risks, each user understands the possibility of explosion of biogas is low because the main substance has been gasified and fermented in the digester, so the end-outcome gas only contains methane. Besides, if they have ever attempted to make a small hole in the plastic and hold it closer to the fire, they would have figured out that explosions do not occur and the flame was minor. As long as the gas is not contained in pressurized tubes like general LPG containers, biogas is not hazardous. The maintenance procedure is considered easy for the user as they only take out residues and can use it for additional oil fertilizer. For instance, if they input 5 litres of cow dung, the final residue will be 5 litres as well, and it is very useful because they do not have to dry it, they just mix it with soil to help the plants grow. By using this residue in the same way, they save for agricultural production and have no need to buy chemical fertilizer. Food cooked with biogas is also without a bad smell and this raised good responses from
neighbouring people. Concerning the impact on health, biogas for the local community provides health benefits because they have assessed that the number of E. Coli present in the water well situated adjacent to the cow stable has declined gradually until 90% were gone. This achievement should be noted for further promotion.
To support the sustainability of community finance, especially for biogas, the community leader in Banyakan proposed funding scheme to the local government after the JICA and Hi-Link project ended. During the project, each interested household paid 30% of total initial costs, and the other 70% was funded by JICA. However, according to my observation, the quality of biogas installation in Banyakan village did not gain local prominence because the users did not receive continuous training and at the initial installation stage they were
not involved in the design-making. The need to uplift the quality of biogas is always at the heart of a/the community, but they must overcome financial constraints, especially for upgrading. The local institution, operated by the community, provides opportunities to disseminate information as well as exchange local aspirations and ideas at regular weekly meetings. By improving their solidarity through lending money, each household is not severely suffering from financial hurdles. However, the local government has not put forward any additional funding, nor have they even visited the site for assessment. More than three times the proposal was delivered to the local government office, but no response appeared. When asked about how government should take action, most people responded that government must be responsible for local livelihood promotion especially when dealing with prosperity and economic improvement.
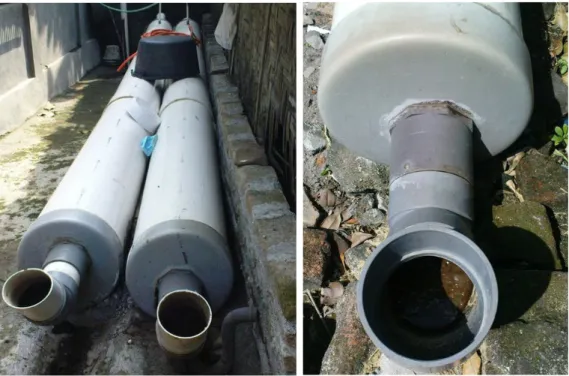
Figure 2. These PVC pipes are used by the community for the digester. They insert cow dung and water and the
gasification processing will take from 1 to 2 weeks. Gadjah Mada University Indonesia’s student fieldwork pro -gram (primarily students from the Livestock Department) introduced this gas plant. Japan International Coopera-tion Agency facilitated the initial installaCoopera-tion by requiring only 30% of the project’s capital investment from local people.
3.2 Research Site II-Manis Renggo Village
Different from research site 1, biogas in Manis Renggo village is built up based on the local needs of enterprises for converting their tofu slurry to be more productive alternative energy fuel, and the program starting-point was very similar to Banyakan Village. The tofu industry in this village provides their primary income, and the community has already targeted distribution areas for sale markets. More than 20 homemade tofu industries contribute to the economic livelihoods of the local people. When producing tofu, its slurry is extensively wasted and the residue is assessed to be potential for biogas inputs. The community considered tofu’s residues negative by-products with a disgusting smell, so often they
Figure 3. The plastic bag on the left contains methane gas. It is compressed from above by a wooden stick which pushes down the gas. On the right side is the end-channel of biogas used for cooking. A user can adjust the volume of gas as desired.
got rid of it in the nearest river, though this was not environmentally friendly. During 2007-2008 Manis Renggo village hosted more than 12 students for fieldwork activities for their final study requirements. At that time, those Gadjah Mada University students introduced the mechanisms and operating procedures for implementing biogas and how to resolve that negatives associated with tofu residue, such as unpleasant odors.
As the physical setting is quite sandy, cemented pipes are used to produce biogas in this area and all equipment is easily obtained from a nearby construction agency in Klaten. Regarding the biogas, it costs the user around IDR 1.000.000 which is accessible and not did not burden them. At later stages, they are
able to extend the installation by modifying the length of digester pipes in order to be adapted to changing local needs. From 20 biogas installations, now the numbers have increased to 60 installations, all initiated by the local community. Gadjah Mada University is often invited back by the local community for consultations and on-going assistance regarding the maintenance and modification of the digesters.
The enthusiasm of the community towards the initiative has lead to the success story of Manis Renggo Village, for not only do the local people and industry enjoy this opportunity, but also the government has been supportive. The project is supported by the The local government in Manis Renggo head of county and village chief through public consultation. The first time the student team immersed in this research, they were astonished by the warm welcome and eager greeting from the county head. He openly invited the students to come visit his house in Manis Renggo and to stay there while pursuing their research. As in the conversations with the local facilitators, the local governments are open to all proposals presented by the community. They often visited the tofu industry to see the progress and economic livelihoods and also interact with local people congenially to better understand any potential problems they might have.
3.3 Local Participation, Government Involvement, and Other Stakeholders Involvement
Comparing those two different areas, participating communities have distinctive needs for building up biogas installations. In the first research site in Banyakan, the
community is active, but the local government has nothing to do with actions for livelihood improvement. It can be said that making positive impacts on livelihoods is not put on their development agenda. Local communities should have given opportunities to respond and transparently explained regarding what sort of required procedures and information is necessary to meet before proposals are delivered.
Meanwhile, in the second research site of Manis Renggo the local governments are relatively open to the changes made by this initiative, as they regard this project will bring financial sustainability of local economics.. These two sites actually exemplify what is so-called “institutional predicaments” can be overcome by the local governments through their supports, where the need of community to improve quality of local business meet with characteristics of biogas. Institutional predicaments are defined as local settings involving local stakeholders when one of the parties does not support the development of newly introduced technology. As part of Renewable Energy Technology (RET) framework, biogas should be taken into account as a new way of creating something for environmental and economic gain. As Painuly (2001) asserts, financial issue that may be obvious hurdle for further improvement can be altered if the government is capable of facilitating the relations of community with external actors, such as university undertaking the respective project.
Locating the positive impacts as items which attract biogas, improvement and also other benefits in making people understand and comprehend should be prioritized in order
to give the community a chance to make a decision. Local participation shown in Manis Renggo and Banyakan implies that technology without active social capital will be no use as it does not give any benefits. The Critical importance of building a new installation that the project starts up is the new ways to ensure a degree of community ability in adapting a new technology which in later phase would be advantageous for generating sustainable livelihood. Also, local needs are only reinforced through community participation because to some extent, they will value the intrinsic benefit of the installation provided. Although biogas installation in those two sites become a success, my observation found that in the mid of installing processes, local participation is less involved, indicated by the gradual decline of biogas usage and the local return to cooking on wood situated in both research sites. Raising from this concern, Kartha and Larson (2000) assert that local needs and their technological acceptance is only able to be facilitated through local participation as it would allow them to choose the most suitable alternative energy source with locally obtainable construction materials. It is crucial to review how social acceptance in renewable energy posits important things which are mostly ignored by some of environmental planners. The idea of social acceptances is asserted by Wustenhagen et al (2007) which consist of socio-political acceptance, community acceptance, and market acceptance. Socio-political acceptance necessitates diverging stakeholders, government and other parties to synergize their interests for concretizing the community needs. This is may be one of the biggest
challenges and sometimes a major obstacle for renewable energy development, as each of the parties has different values and views to be coordinated. If this first requirement is met, subsequent process of installation will predictably run flawlessly because all of stakeholders have been broad-minded enough to accept any consequence that may come with it and in the same time they are ready enough to provide support for investors. Meanwhile, community acceptance is more substantial where it relates to by whom “sitting-decision of local stakeholder” will be executed. This will be playing a critical role in answering who local authorities are to ask for project authorization in a later stage. Also, information dissemination provided by interactive communication between actors/ users and government will lead to effective development of technology. And, another extent is market acceptance, which relates to segmentation of market for product distribution. If we put these into the context of two different research sites, Manis Renggo is more likely able to achieve socio-political acceptance and community acceptance as both aspects has heavily contributing to the improvement of biogas for production leveraging, but not in Banyakan. In the second site the community must overcome the situation by strengthening their social capital through local cooperation done with fellow members..
4. CONCLUSION
From the discussion and observation above, Banyakan village is less uccessful in mobilizing community members in adopting biogas installation because it has not gained
interest of the household, but some community members still retain their usage because it is considered efficient and beneficial for organic fertilizer. Meanwhile, Manis Renggo shows differently, it has strong demand on biogas because it has contributed to the increase in profitability and also savings and its local governments.
REFERENCES
(1) Abdullah, Kamaruddin. (2005). Re-newable energy conversion and utili-zation in ASEAN countries. Energy, 30, 119-128.
(2) Barnet, Andrew., Pyle, Leo., & Subramaniam, S.K. (1978). Biogas
Technology in the Third World: A Mul -tidisciplinary Review. International Development. Canada.
(3) Cohani, Bindu N. (2009). Climate of Opportunity: Developing Asia’s potential to address climate change. Journal of Emerging Market Econom-ics, 1, 293-337.
(4) Da Silva, Edgar J. (1980). Biogas: Fuel of the Future?. Ambio, 9 (1), 2-9 (5) Deublein, Dieter., & Steinhauser,
Angelica. (2008). Biogas from Waste
and Renewable Resources: An Intro -duction. Wenheim, Wiley-Vch. (6) Karki, A.B, Shresta, J.N, Bajgain, S
(ed.) (2005): Biogas As Renewable Source of Energy in Nepal: Theory
and Development. Kathmandu: Biogas Support Programme.
(7) Larson, Eric., & Kartha, Sivan. (2000). Expanding roles for modernized bio-mass energy. Energy for Sustainable
Development, IV(3), 15-25.
(8) Painuly, JP. (2001). Barriers to renew-able energy penetration: a framework for analysis. Renewable Energy, 78-89.
(9) Reijenders, L. (2006). Conditions for the sustainability of biomass based fuel use. Energy Policy, 34, 863-876. (10) Saha, Pranesh Chandra. (2003). Sus-tainable energy development: a chal-lenge for Asia and the Pacific region in 21st century. Energy Policy, 31,
1051-1059.
(11) Wahyuni, Sri. (2008). Policy Analysis on Biogas Development for Individual Based Alternative Energy and Farm Group (in Indonesian). Unpublished Master Thesis Institute Pertanian Bo-gor.
(12) Widodo, Teguh Wikan., & Hendriadi, Agung. (2005). Development of Biogas Processing for Small Scale Cattle Farm in Indonesia. Paper presented in International Seminar on Biogas Technology for Poverty Reduction and Sustainable Develop-ment 18-20 October 2005 in Beijing China.
(13) Wustenhagen, Rolf., Wolsin, Maar-ten., & Burer, Jean Mary Bürer. (2007). Social acceptance of renwable energy innovation: An Introduction to the concept. Energy Policy, 35, 2683-2691.
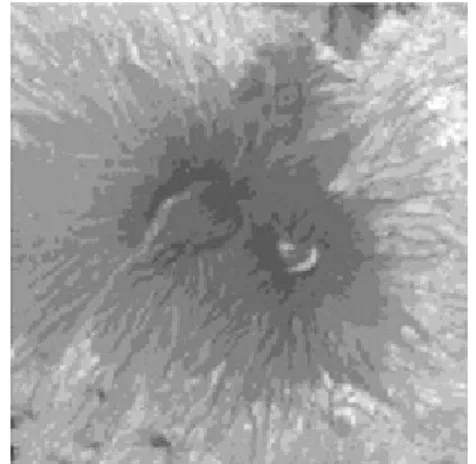
RELASIONAL DATA PENGINDERAAN JAUH DENGAN GRADASI
TEMPERATUR DI TAMAN NASIONAL GUNUNG PANGRANGO
RELATIONAL DATA REMOTE SENSING WITH TEMPERATURE
GRADIENT PANGRANGO MOUNTAIN NATIONAL PARK
Wiweka1, Sri Handoyo2, John Hendrick B2, Samsul Arifin1
(Diterima tanggal 15-11-2011; Disetujui tanggal 14-03-2012)
1. PENDAHULUAN
Temperatur merupakan salah satu parameter yang sangat penting bagi lingkungan, manusia dan tumbuhan. Temperatur udara dipengaruhi
1 LAPAN,Wiweka is with the National Institute Aeronautics and Space, Jl. R Lapan 70 Pekayon Pasar Rebo, Jakarta Timur 13710, Indonesia
(corresponding author to provide phone: 62-21-8710786; fax: 62-21-8712763; e-mail: wiweka@ lapan.go.id).
2 BIG, Jl. Raya Bogor Km
ABSTRAK
Gunung adalah bentuklahan besar yang membentang di atas tanah sekitarnya, berada di wilayah yang terbatas biasanya dalam bentuk puncaknya, ketinggian tinggi di pegunungan menghasilkan iklim dingin daripada di permu-kaan laut, gunung di karakteristik oleh sejumlah parameter yaitu ketinggian, volume, relief, kecuraman, jarak dan kontinuitas. Iklim dingin sangat mempengaruhi ekosistem pegunungan: ketinggian yang berbeda memiliki tanaman yang berbeda dan hewan. Karena medan yang kurang ramah dan iklim, pegunungan cenderung digunakan untuk ekstraksi sumber daya dan rekreasi, seperti mendaki gunung. Parameter lingkungan memiliki fungsi dan pengaruh terhadap kehidupan komunitas. Data penginderaan jauh dapat ditransformasi menjadi nilai temperatur, tahapan transformasinya nilai dijital diubah menjadi radians kemudian dikonversi menjadi temperatur. Perlu dilakukan koreksi radiometrik, agar representasi nilai temperatur sesuai dengan kondisi sebenenarnya. Penelitian ini meng-gunakan data Landssat ETM+, hasilnya menunjukkan kisaran rata-rata temperatur di puncak Taman Nasional Gunung Pangrango pada siang hari 15,92oC dan kecenderungan perubahan temperatur terhadap tinggi di lokasi
penelitian adalah linier.
Kata Kunci: Reflektansi, Nilai Spektral, Suhu, Citra, Penginderaan Jauh
ABSTRACT
A mountain is a large landform that stretches above the surrounding land, located in a limited area usually in the form of peak, high altitude in the mountains produce a climate cooler than at sea level, the mountain by a number
of parameters characteristic of the height, volume, relief, steepness, spacing and continuity. Cold climate greatly
affect mountain ecosystems: different heights have different plants and animals. Due to the less hospitable terrain and climate, the mountains tend to be used for resource extraction and recreation, such as mountain climbing.
Functions and environmental parameters have an influence on community life. Remote sensing data can be trans
-formed into a temperature value, phase transformation radians converted to a digital value is then converted to
temperature. Radiometric correction needs to be done, so that the temperature value representation in accordance with the actual conditions. This study used Landsat ETM +, the results show the average temperature range at the top of the Volcano National Park Pangrango 15.92 ° C during the day and the trend toward higher temperature
changes at the sites is linear.
Keywords: Reflectance, Spectral Value, Temperature, Image, Remote Sensing
oleh durasi, intensitas radiasi matahari, laju pindah panas, laju transpirasi, evaporasi, dan aktivitas biologis di sekitar lingkungan.
Lokasi penelitian dalam makalah ini di Taman Nasional Gunung Gede Pangrango (TNGGP), Jawa Barat, Indonesia, gunung ini memiliki ketinggian ± 3.019 m, rata curah hujan 200 mm – 400 mm per bulan, suhu di puncak kurang dari 18oC, dan kelembaban
antara 80%-90% [1,2]. Gunung ini digunakan sebagai lokasi pendakian, karena jalur pendakian memadai dan suhu mencapai 5oC pada musim kemarau di bulan Juni s/d
September. Perubahan dan dinamika informasi suhu gunung, dapat diturunkan dengan menggunakan data penginderaan jauh, hasil dalam penelitian ini tertuangnya informasi atau gambaran pola perubahan suhu terhadap titik-titik ketinggian. Data penginderaan jauh
yang digunakan adalah resolusi menengah dan untuk melakukan koreksi digunakan peta rupa bumi. Pada prinsipnya, untuk menghasilkan peta sebaran suhu, dilaksanakan dengan mengakusisi data penginderaan jauh, melakukan pengolahan citra dijital, melakukan plotting posisi ketinggian dan suhu secara kartografi ke dalam peta tematik.
2. STUDI AREA DAN DATA
2.1 Study Area
Lokasi Taman Nasional Gunung Gede Pangrango terletak di koordinat (6o42’9”S
, 106o56’20”E) sedangkan luasnya adalah
22.815,03 hektar, kawasan Taman Nasional ini ditutupi oleh hutan hujan tropis pegunungan.
Taman Nasional Gunung Gede Pangrango memiliki keanekaragaman ekosistim sub-montana, Montana, sub-alpin, danau, rawa, dan savanna. Dicirikan dengan adanya pohon yang besar dan tinggi seperti jamuju (Dacrycarpus imbricatus), puspa (Schima wallichii), rumput (Isachne pangerangensis), bunga eidelweis (Anaphalis javanica), violet (Viola pilosa), dan Cantigi (Vaccinium
varinginaefoliuma). Satwa primata yang terancam punah dan terdapat di Taman Nasional Gunung Gede Pangrango yaitu owa (Hylobates moloch), surii (Prebytis comata), lutung budeng (Trachyithecus auratus), macan tutul (Panthera pardus melas), landak Jawa
(Hystrix brachyuran), kijang (Muntiacus muntjak), dan musang tenggorokan kuning (Martes flavigula).
2.2 Data
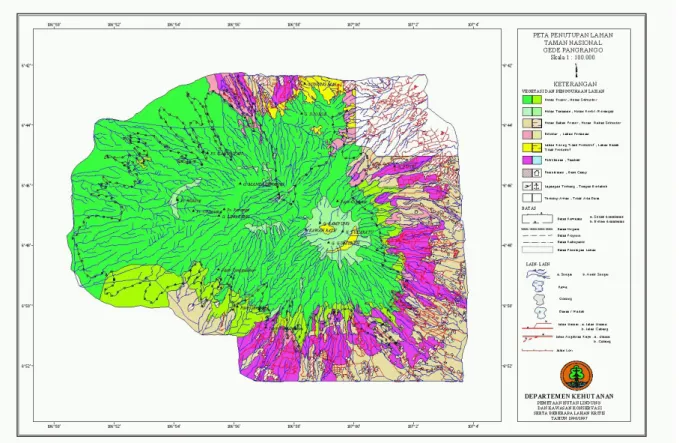
Dalam pelaksanaan penelitian ini menggunakan data antara lain : peta rupa bumi dijital Taman Nasional Gunung Gede Pangrango skala 1:25.000 dengan nomor lembar peta 1209-124,1209-142, 1209-213,1209-231 terbitan Bakosurtanal tahun 1999. Data penginderaan jauh yang digunakan citra satelit Landsat 7 ETM+ hasil perekaman tahun 2010 dengan nomor Path/Row : 122/065, hanya menggunakan band 6 untuk tujuan penelitian ini, gambar 1.
3. METODOLOGI
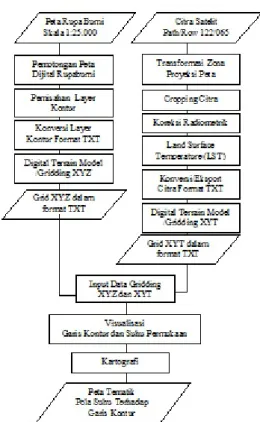
Secara umum, langkah-langkah yang dilakukan dalam pelaksanaan peneltian ini dapat dilihat pada diagram akhir dibawah ini, gambar 2.
Suhu Terhadap Garis Kontur.
Penjelasan Gambar 2 sebagai berikut : Karena data dasar luasannya melebihi dari cukup, maka dilakukan pemotongan dengan koordinat UTM batas pojok kiri atas (707186.461,9260053.235) dan koordinat UTM pojok kanan bawah (726887.867,9239663.500), gambar 3.
Gambar 2. Diagram Alir Penelitian Pola
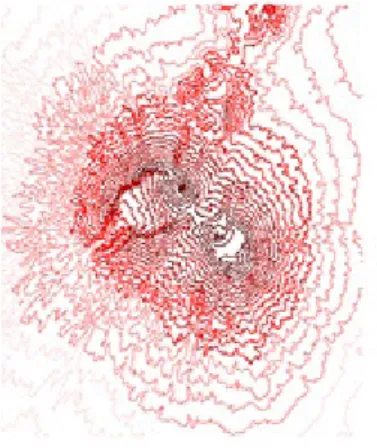
Langkah selanjutnya adalah memisahkan layer kontur dan elevasi dari peta rupa bumi dijital, untuk dibangun digital elevation model (DEM), gambar 4.
Gambar 3. Peta Rupa Bumi Taman Nasional Gede
Pangrango
Gambar 4. Digital Elevation Model Taman Nasional
Gede Pangrango
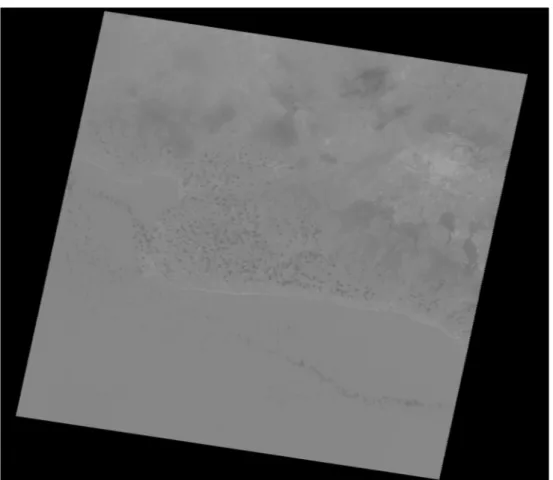
Proses pengolahan citra terhadap data landsat 7 +ETM band 6 sebagai berikut melakukan transformasi datum, pemotongan citra (gambar 5), koreksi radiometrik (gambar 6), menghitung land surface temperature, hasilnya DTM (Digital Temperature Modelling). Datum yang digunakan WGS 84 dan sistim proyeksinya adalah UTM.
Gambar 5. Pemotongan Citra Taman Nasional Gede Pangarango
Hasil koreksi radiometrik, memberikan asumsi nilai reflektansi sesuai dengan kondisi kelas penggunaan lahan sebenarnya. Perhitungan Land Surface Temperature dilaksanakan dengan mengubah digital number menjadi radiance, kemudian dari radiance di konversi ke temperature [3].
Rumus konversi digital number (DN) ke radiance (R) sbb:
R=K*DN+N ... (1) K=Konstanta nilai gain citra=0,05518 N=Nilai bias cahaya=1,2378
Menurut USGS (2001) dan Chen et.al (2001), Rumus konversi radiance (R) ke temperature (T) sbb :
T=K2/ln(K1/Lλ+1)... (2) T =temperature efektif dalam Kelvin K1=konstanta satu dalam watts dengan
nilai 666,09 untuk ETM+
K2=konstanta dua dalam Kelvin dengan nilai 1282071 untuk ETM+
Lλ =radian spektral dalam watt
Langkah selanjutnya adalah membuat Digital Temperature Model (DTM), gambar 7. Gambar 6. Citra Terkoreksi Radiometrik
4. HASIL DAN PEMBAHASAN
Berdasar Digital Elevation Model dan Digital Temperature Model Taman Nasional Gunung Gede Pangrango, Kedua model tersebut dapat divisualisasikan dan dioverlay. Gambar tersebut disajikan pada Gambar 8-10
Gambar 7. Digital Temperature Model Taman Nasional Gede Pangrango
Gambar 8. Visualisasi Digital Temperature Model Taman Nasional Gunung Gede Pangrango
Dalam menvisualisasi dan mengoverlay pola sebaran suhu terhadap garis ketinggian, proses kartografi harus dilakukan agar memenuhi prinsip merancang isi peta, layout, skala dan Gambar 9. Visualisasi Digital Elevation Model Taman Nasional Gunung Gede Pangrango
simbol.
Hasil proses overlay ini disebut Peta Tematik Pola Sebaran Suhu Terhadap Garis Kontur Taman Nasional Gunung Gede Pangrango, disajikan dalam gambar 10
Proses interpolasi dari layer elevasi dan radiansi menjadi Digital Elevation Model dan Digital
Temperature Model menggunakan metoda Krigging. Harapannya metoda interpolasi tersebut dapat memberikan ketelitian relatif cukup untuk ukuran grid 100 m x 100 m, dan sesuai dengan kebutuhan pengguna seperti pendaki gunung, tim SAR atau masyarakat pada umumnya
Dimensi yang dihasilkan di peta tematik tentang pola sebaran suhu terhadap garis ketinggian sebagai berikut menggunakan sistim proyeksi Universal Tranverse Mercator, Zona : 48 S, skala :1:125.000, pewarnaan layer ketinggian dengan 5(lima) symbol garis dengan pola warna yang berbeda pada setiap interval kontur tertentu, dan untuk layer suhu
Tabel 1. Hubungan Garis Kontur Terhadap Suhu Permukaan
Kontur Min Maks Rata2 Label
600 22.34 25.30 23.75 600–900 700 17.41 25.86 22.37 600–900 800 19.02 25.29 21.55 600–900 900 16.35 25.49 20.84 600–900 1000 17.92 28.05 21.21 901–1200 1100 16.64 29.43 21.10 901–1200 1200 16.20 27.42 20.62 901–1200 1300 15.02 25.62 19.86 1201-1700 1400 14.35 26.00 19.12 1201-1700 1500 14.19 23.42 18.39 1201-1700 1600 13.91 23.67 17.91 1201-1700 1700 15.09 24.30 17.44 1201-1700 1800 14.59 20.72 16.99 1701-2300 1900 14.58 20.00 16.62 1701-2300 2000 14.85 20.00 16.40 1701-2300 2100 14.56 20.06 16.22 1701-2300 2200 14.28 20.20 16.05 1701-2300 2300 14.33 18.98 15.89 1701-2300 2400 14.42 17.65 15.72 2301-2900 2500 14.51 16.93 15.51 2301-2900 2600 14.33 16.97 15.42 2301-2900 2700 13.98 20.76 15.65 2301-2900 2800 14.50 20.06 15.76 2301-2900 2900 14.86 17.85 15.92 2301-2900
permukaan menggunakan 9 (Sembilan) pola warna dimana setiap pola warna interval suhunya setiap 2oC.
Berdasarkan yang tersaji di peta (Gambar 9) dan Tabel 1, bahwa pada setiap garis ketinggian memiliki suhu permukaan yang bervariasi dengan batas minimum dan maksimum suhu pada masing-masing ketinggian.
Untuk memudahkan intepretasi hubungan antara perubahan ketinggian dan temperatur, dirubah bentuk penyajian menjadi grafik batang, agar terlihat kecenderungan menurunnya nilai temperatur bersamaan menaiknya ketinggian, gambar 10.
Dalam gambar 11, terlihat perubahan temperatur gradual yang tidak smooth dari ketinggian 600-900 m menuju pada ketinggian 900-1200 meter. Sebagai fenomena, kemungkinan adanya diskontinu perubahan kelas penggunaan lahan seperti lahan terbuka, jenis vegetasi, dan indeks kehijauan wilayah tersebut. Di puncak gunung pada ketinggian 2800 meter, nilai temperatur berkisar 14oC
sampai dengan 16oC, fenomena yang lain
terdapat nilai temperatur antara 18oC sampai
dengan 23oC, ini di karenakan ada kelas
penggunaan lahan yaitu rawa kawah gunung.
Gambar 11. Pola Perubahan Temperatur dan Ketinggian Taman Nasional Gunung Gede Pangrango
4. SIMPULAN
Pengetahuan tentang suhu permukaan tanah (LST) gunung sangat penting, karena membantu untuk memahami proses seperti pertukaran energi antara permukaan dan atmosfer, kebutuhan air di tanah pertanian, pengendalian dan pencegahan kebakaran dan evolusi perubahan iklim.. Perlunya formula koreksi radiometrik yang dapat menghilangkan noise, yang hasilnya mendekati kondisi sebenarnya. Perhitungan temperatur perlu melibatkan kelas penggunaan lahan, agar tidak terdapat anomali dan kerancuan dalam menetapkan nilai temperatur. Perlunya dilakukan visualisasi 3(tiga) dimensi dalam penyajian temperatur dan ketinggian, agar memudahkan pengguna memanfaatkan informasi ini. Formulasi ini cukup dapat digunakan sebagai perangkat pendukung bagi
pengguna yang akan melakukan pendakian di Taman Nasional Gunung Gede Pangrango. Faktor penting, agar diperoleh temperatur dengan akurasi yang cukup, yang memperhitungkan: kondisi lingkungan sekitarnya pada permukaan dan emisivitas sendiri. Untuk harus dilakukan koreksi: koreksi atmosfer untuk menghilangkan kontribusinya terhadap pengukuran satelit dan karena efek dari emisivitas permukaan.
DAFTAR PUSTAKA
(1) (Journal Online Sources style) Benyamin Dendang, “The Diversity of Butterflies in Selabintana Resort,
Gunung Gede Pangrango National Park, West Java,”, Balai Penelitian Kehutanan Ciamis, Jl. Raya Ciamis-Banjar Km. 4 PO. BOX. 5 Ciamis 46201 Telp. (0265) 771352, Fax (0265) 775866, http://www.forda-mof.org/files/ 3_Benyamin_ klm.pdf (2) ..., Hiking in Mt Gede Pangrango
National Park [0nline], http:// g e d e p a n g r a n g o . o r g / w p -c o n t e n t / u p l o a d s / 2 0 0 8 / 0 5 / hikingleaflet2007sepeng-fin.pdf (3) (Journal Online Sources style)
Javed Mallick, Yogesh Kant1 and B.D.Bharath1, Estimation of land surface temperature over Delhi using Landsat-7 ETM, GIS Department, STC-IT-CFS-GIS, Saudi Telecom, Saudi Arabia Indian Institute of Remote Sensing (NRSA), Dept. of Space, Govt. of India, J. Ind. Geophys. Union ( July 2008 ) Vol.12, No.3, pp.131-140
(4) Calvet, J.-C., A. Chanzy, and J.-P. Wigneron, Surface temperature and soil moisture retrieval in the Sahel from multiple frequency radiometry, IEEE Trans. Geosci. Remote Sens., 34, 588 – 600, 1996
(5) J.-F. Wang, R.-H. Zhang, R. R. Gillies , Y. Xue, , and Y.-C. Bo, Air temperature retrieval from remote sensing data based on thermodynamics, Published online October 14, 2004 # Springer-Verlag 2004
(6) Cristóbal, J., M. Ninyerola, and X. Pons. 2008. Modeling air temperature through a combination of remote sensing and GIS data. Journal of Geophysical Research 113. D13106. doi: 10.1029/2007JD009318.
(7) E. Ozelkana, I. Papilaa, D.Z. Uca Avcia, , M. Karamana, Drought Determination By Using Land Surface Temperature And Normalized Difference Vegetation Index Istanbul Technical University, Center For Satellite Communications And Remote Sensing, Ayazaga Campus, Maslak, Istanbul. (Emre, Papila, Damla, Muhittin)@Cscrs.Itu.Edu.Tr
EFEKTIVITAS ARANG AKTIF DIPERKAYA MIKROBA KONSORSIA
TERHADAP RESIDU INSEKTISIDA LINDAN DAN ALDRIN
DI LAHAN SAYURAN
EFFECTIVENESS OF ACTIVATED CARBON ENRICHED CONSORSIA
MICROBES ON INSECTICIDAL RESIDUES OF LINDANE AND ALDRIN
IN VEGETABLE LAND
E.Srihayu Harsanti, Indratin, Sri Wahyuni, Eman Sulaeman, dan A.N. Ardiwinata
(Diterima tanggal 30-04-2012; Disetujui tanggal 2-11-2012)
ABSTRAK
Lindan dan aldrin merupakan insektisida organoklorin yang residunya masih ditemukan di lahan sayuran. Lindan dan aldrin merupakan senyawa cemaran organic persisten (Persistent Organic Pollutants atau POPs) yang memiliki toksisitas dan persistensi yang tinggi di dalam tanah. Salah satu mitigasi residu insektisida POPs dalam tanah adalah remediasi dengan menggunakan arang aktif dengan memanfaatkan mikroba konsorsia. Percobaan lapang dilaksanakan di lahan sayuran di Magelang selama musim penghujan 2010. Tujuan penelitian adalah mengetahui efektivitas arang aktif diperkaya mikroba konsorsia terhadap degradasi residu lindan dan aldrin di lahan sayuran. Percobaan lapang disusun menggunakan rancangan acak kelompok dengan tiga ulangan dan tujuh perlakuan. Parameter yang diamati yaitu karakteristik tanah, residu insektisida lindan dan aldrin dalam tanah dan air, tinggi dan hasil biomassa sawi. Arang aktif efektif menurunkan residu lindan dan aldrin dalam tanah hingga lebih dari 50 % saat 7 hari setelah aplikasi insektisida pada tanaman sawi. Arang aktif yang diperkaya mikroba konsorsia cennderung menurunkan residu lindan dan aldrin lebih tinggi daripada arang aktif tanpa diperkaya mikroba konsorsia. Kadar pestisida lindan dan aldrin dalam tanaman pada perlakuan arang aktif dari tempurung kelapa lebih tinggi daripada arang aktif tongkol jagung dengan inokulasi mikroba. Pemberian arang aktif cenderung memberikan hasil biomassa tanaman sawi lebih tinggi daripada tanpa arang aktif.
Kata kunci: arang aktif, mikroba konsorsia, lindan, aldrin, sawi
ABSTRACT
Lindane and aldrin are organochlorine insecticides that their residues are still found in vegetables lands. Lindane and aldrin are included as persistent organic pollutants (POPs) with high toxicity and persistant in the soil. One of the mitigations of insecticide residues of POPs in soils is remediation by using activated charcoal and consortia microbes. Field experiment was conducted in the vegetables centre in Magelang during the rainy season of 2010. The objective is to examine the effectiveness of activated charcoal enriched consortia microbes on degradation of lindane and aldrin residues in vegetable fields. A randomized block design with three replications and seven treatments was used in the experiment. The observed parameters were soil characteristics, residues of lindane and aldrin in soil and water, cabbage biomass. Activated charcoal effectively reduced residues of lindane and aldrin in the soil by more than 50% at 7 days after application of insecticides on cabbage crop. Activated charcoal enriched consortia microbe tends to reduce residues of lindane and aldrin higher than activated charcoal without enriched consortia microbes. Residues of lindane and aldrin in plot treated with activated charcoal from coconut shell was higher than in plot treated with activated charcoal from corn cobs with microbial inoculation. Application of activated charcoal tends gave cabbage biomass yield higher than without applying active charcoal.