HANNU REPONEN
COORDINATED VOLTAGE CONTROL IN REAL TIME
SIMULATIONS OF DISTRIBUTION NETWORK WITH
DISTRIBUTED ENERGY RESOURCES
Master of Science thesis
Examiner: Prof. Sami Repo
Examiner and topic approved by the Faculty Council of the Faculty of Computing and Electrical Engineering on 4th May 2016
i
ABSTRACT
HANNU REPONEN: Coordinated Voltage Control in Real Time Simulations of Distribution Network with Distributed Energy Resources
Tampere University of Technology
Master of Science thesis, 95 pages, 2 Appendix pages May 2016
Master's Degree Programme in Electrical Engineering Major: Power Systems and Market
Examiner: Prof. Sami Repo
Keywords: coordinated voltage control, distributed energy resources, RTDS, substation automation unit
Voltage rise eect in distribution networks poses challenges in future when increas-ing amount of Distributed Energy Resources(DERs) are connected to the network, and currently is the limiting factor of the network's DER hosting capacity. Passive approaches reinforce the network to increase the hosting capacity but alternatively coordinated voltage control schemes are capable of utilizing the DERs widely across the network. Using reactive power capability of distributed generators, production curtailment or substation voltage control in coordination, desired network voltages can be achieved and e.g. losses minimized. However, this requires accurate infor-mation on the state of the whole network. Distributing the autoinfor-mation and control decision making across network voltage levels reliefs data transfer burden to control centers where the decision making is typically centralized. This allows better utiliza-tion of large scale of resources in optimizing the network operautiliza-tion. With Substautiliza-tion Automation Units(SAUs) the above can be realized in distribution networks. This thesis presents the SAU based architecture, and required algorithms to demon-strate a decentralized automation system and coordinated voltage control in a dis-tribution network. Case study was performed for real LV disdis-tribution network in Real-Time Digital Simulator. Main focus was to verify correct operation, and to an-alyze performance of coordinated voltage control compared to other control schemes under real and articial network conditions. Under demanding network conditions, coordinated voltage control proved to be superior by avoiding over-voltages and conductor thermal limits. The results validate viability of the automation archi-tecture and eectiveness of the coordinated voltage control scheme. Real network demonstrations are follow-up for this thesis' work.
ii
TIIVISTELMÄ
HANNU REPONEN: Koordinoitu jännitteensäätö hajautettuja energiaresursseja sisältävien jakeluverkkojen reaaliaikasimuloinnissa
Tampereen teknillinen yliopisto Diplomityö, 95 sivua, 2 Liitesivua Toukokuu 2016
Sähkötekniikan koulutusohjelma Pääaine: Sähköverkot ja -markkinat Tarkastajat: Prof. Sami Repo
Avainsanat: Koordinoitu jännitteensäätö, reaaliaikasimulointi, RTDS, sähkönjakeluau-tomaatioyksikkö
Jännitteennousu on yksi jakeluverkkojen tulevaisuuden haasteista hajautettujen e-nergiaresurssien integroinnin lisääntyessä pien- ja keskijännitejakeluverkoissa. Jän-nitteennousu liitäntäpisteessä on usein rajoittava tekijä verkkoon liitetylle tuotan-tokapasiteetille. Verkon vahvistamisinvestoinnit ovat tyypillinen käytäntö liitäntäka-pasiteetin kasvattamiseksi, mutta vaihtoehtoisesti koordinoidulla jännitteensäädöllä voidaan hyödyntää näiden resurssien olemassa olevia säätömahdollisuuksia laajem-min. Hajautetun tuotannon loistehokapasiteettia, tehonleikkausta tai sähköaseman jännitteensäätöä yhdistämällä voidaan saavuttaa tavoitellut verkon jännitteet ja minimoida esim. verkon häviöt. Koordinoitu säätö vaatii tarkkaa tietoa verkon nykytilasta, ja siksi automaatio- ja ohjausarkkitehtuurin hajauttaminen myös alem-mille jännitetasoille mahdollistaa pienempienkin resurssien hyödyntämisen verkon tilan optimoinnissa. Yllä oleva voidaan toteuttaa tähän tarkoitukseen kehitetyillä automaatioyksiköillä.
Tässä työssä esitellään näihin automaatioyksiköihin pohjautuva säätöarkkitehtuuri, sekä algoritmit joilla kyseinen hajautettu automaatiojärjestelmä ja koordinoitu jän-nitteensäätö voidaan toteuttaa jakeluverkoissa. Työn testiosuudessa koordinoitua jännitteensäätöä tarkastellaan pienjännitteisen jakeluverkon reaaliaikasimuloinneissa. Simuloinneissa tutkittiin säädön toimintaa ja verrattiin sen tehokkuutta muihin säätömenetelmiin oikeissa ja keinotekoisissa verkon olosuhteissa. Vaativimmissa olosuhteissa koordinoitu jännitteensäätö osoittautui tehokkaimmaksi välttäen yli-jännitteet ja johdinten termiset kestävyydet. Tuloksista voidaan todeta arkkiteh-tuurin toimivuus ja koordinoidun jännitteensäädön suorituskyky, ja siten kyseistä konseptia voidaan demonstroida oikeassa jakeluverkossa.
iii
PREFACE
This Master's thesis was done in the Smart Grid research group at the Department of Electrical Engineering, Tampere University of Technology between Spring 2015 and Spring 2016. The work was done as part of, and received funding from European Union's seventh framework program FP7-SMARTCITIES-2013 under project alias IDE4L - ideal grid for all.
I would like to thank my thesis supervisor and examiner, D.Sc. Anna Kulmala and Prof. Sami Repo respectively for guidance and valuable feedback. I would also like to thank other colleagues in TUT Smart Grid research group, B.Sc. Ville Tuominen, M.Sc. Shengye Lu, Mr. Jussi Lalli and M.Sc. Antti Mutanen in no particular order, for the work you did in realizing the laboratory setup used in the thesis.
Many thanks to all my friends, especially Mr. Niko Leväs Luoto, who helped me to keep at least some balance between the, sometimes rough, start of my career life and free time. Other friends who simultaneously worked on your MSc theses, you kept motivating me by sharing your experiences during the process.
Last but not least, the thanks go to my family for continuous support in the ups and downs throughout my years of studies.
Tampere, 24.5.2016
iv
TABLE OF CONTENTS
1. Introduction 1
1.1 Objectives and scope of the thesis . . . 3
1.2 Structure of the thesis . . . 4
2. Active voltage control in distribution networks with distributed generation 5 2.1 Design and planning of traditional electricity distribution networks . 6 2.2 Voltage quality requirements in distribution networks . . . 8
2.3 Impact of distributed generation in distribution networks . . . 8
2.3.1 Voltage rise eect . . . 9
2.3.2 Voltage rise mitigation . . . 10
2.4 Controllable resources in active voltage control . . . 12
2.4.1 On-Load Tap Changer . . . 12
2.4.2 Real and reactive power of distributed generation . . . 14
2.4.3 Controllable loads . . . 17
2.4.4 Reactive power compensation using power electronics or ca-pacitor banks . . . 18
2.5 Coordinated Voltage Control . . . 19
2.5.1 Control architectures and implementation . . . 20
2.5.2 Control hierarchy in future distribution networks . . . 22
3. Substation Automation Unit 24 3.1 Interfaces and functions . . . 24
3.2 Data modeling . . . 26
3.3 Database . . . 28
4. Algorithms 29 4.1 State Estimation . . . 29
4.2 Power Control . . . 31
4.2.1 Optimal power ow and objective function formulation . . . . 31
4.2.2 Constraints . . . 33
4.2.3 Implementation . . . 34
v
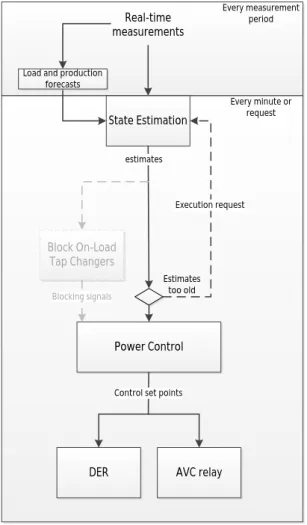
4.4 Execution sequence of the algorithms . . . 37
5. Testing environment 39 5.1 Real Time Digital Simulator . . . 40
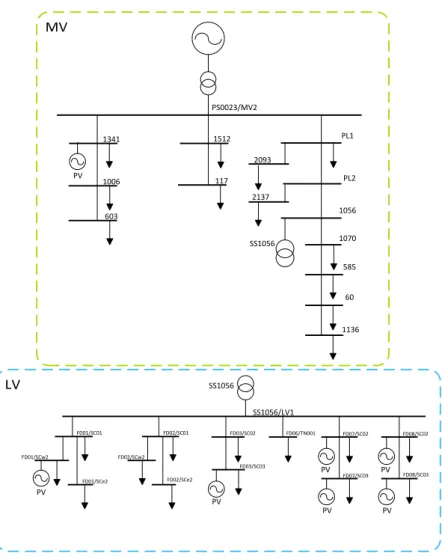
5.2 Simulation network model . . . 42
5.3 Intelligent Electronic Devices . . . 44
5.3.1 Automatic Voltage Regulator . . . 44
5.3.2 Automatic Voltage Controller . . . 45
5.3.3 Remote Terminal Unit . . . 46
5.3.4 Smart meters . . . 46
5.4 Connection setup and implementation . . . 47
6. Case study: Coordinated voltage control in LV network 49 6.1 Control schemes . . . 49
6.2 Test conditions . . . 50
6.3 Test sequences . . . 51
6.3.1 Maximum and minimum generation and loading scenarios . . 52
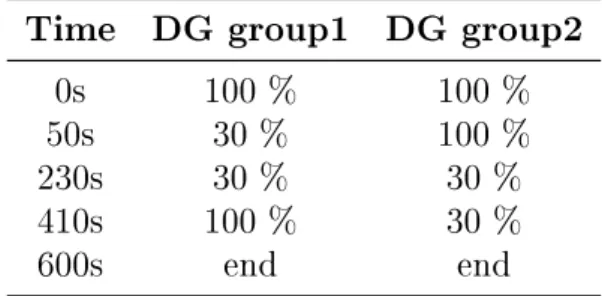
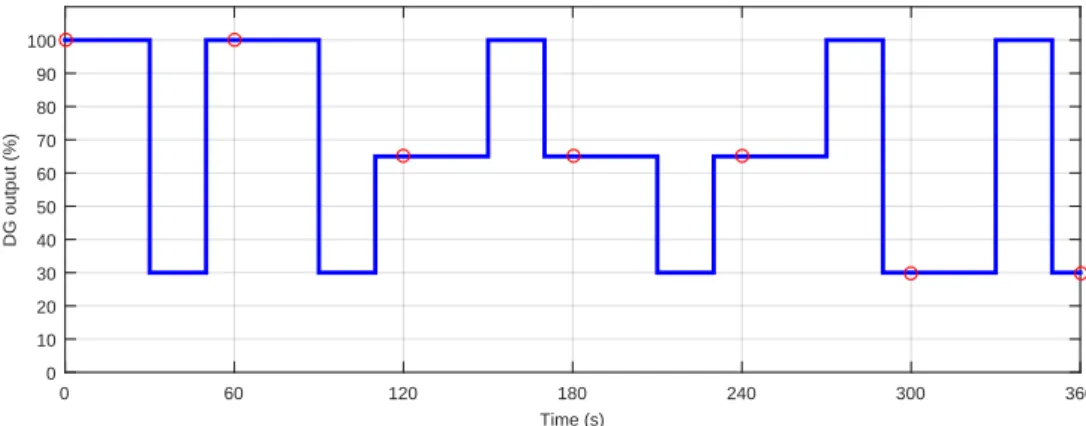
6.3.2 DG output changing in groups . . . 52
6.3.3 Supply network voltage variations . . . 53
6.3.4 Intra-minute voltage variations . . . 53
6.3.5 Eect of cost parameters . . . 54
6.3.6 Production curtailment . . . 55
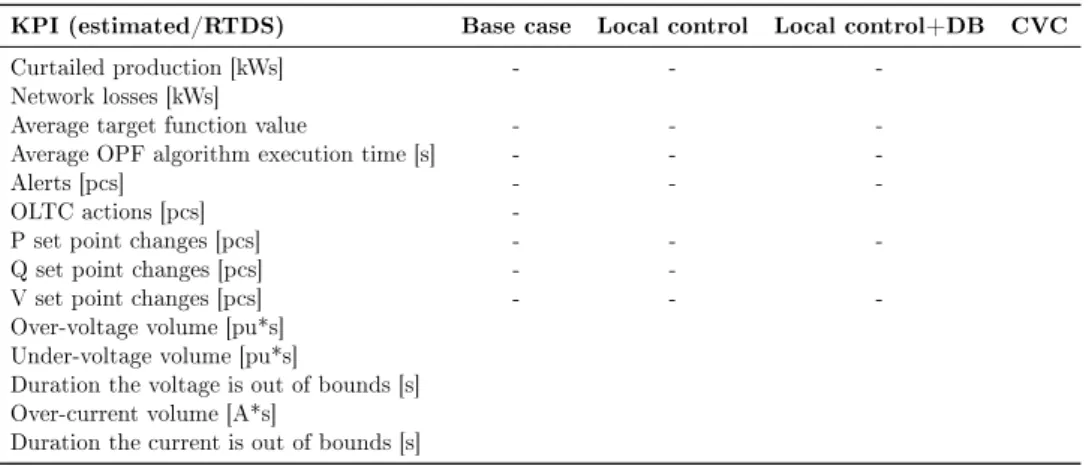
6.4 Key Performance Indicators . . . 55
7. Results 58 7.1 Real conditions . . . 58
7.1.1 Maximum and minimum generation and loading scenarios . . 58
7.1.2 DG output changing in groups . . . 60
7.1.3 Supply network voltage variations . . . 61
7.1.4 Intra-minute voltage variations . . . 65
7.2 Articial conditions . . . 67
7.2.1 Maximum and minimum generation and loading scenarios . . 67
7.2.2 DG output changing in groups . . . 71
7.2.3 Supply network voltage variations . . . 74
vi 7.2.5 Eect of cost parameters . . . 80 7.2.6 Production curtailment . . . 82
8. Discussion of the results 84
8.1 Future studies and development . . . 86
9. Conclusions 88
Bibliography 90
vii
LIST OF ABBREVIATIONS AND SYMBOLS
AMI Advanced Metering Infrastructure
AMR Automatic Meter Reading
AVC Automatic Voltage Controller
AVR Automatic Voltage Regulator
BOT Blocking of On-Load Tap Changers of Transformers
CC Control Center
CIM Common Information Model
COSEM Companion Specication for Energy Metering
CVC Coordinated Voltage Control
DER Distributed Energy Resource
DLMS Device Language Message Specication
DMS Distribution Management System
DR Demand Response
DSO Distribution System Operator
DG Distributed Generation
FACTS Flexible AC Transmission System
GT Graded Time
HEMS Home Energy Management System
IED Intelligent Electronic Device
KPI Key Performance Indicator
LDC Line Drop Compensation
LV Low Voltage
MINLP Mixed-Integer Nonlinear Programming
MMS Manufacturing Message Specication
MV Medium Voltage
NIS Network Information System
OLTC On-Load Tap Changer
OPF Optimal Power Flow
PC Power Control algorithm
PSAU Primary Substation Automation Unit
PV Photovoltaics
RDBMS Relational Database Management System
viii
SAU Substation Automation Unit
SCADA Supervisory Control and Data Acquisition
SE State Estimation algorithm
SQP Sequential Quadratic Programming
SSAU Secondary Substation Automation Unit
STATCOM Static Synchronous Compensator
SVC Static VAr Compensator
TSO Transmission System Operator
WLS Weighted Least Squares
Ccur Cost of production curtailment
CDR Cost of demand response actions
Closses Cost of network losses
Ctap Cost of tap changer operation
CV dif f Cost of voltage variation
ntap Number of tap changer operations
P Real power
Pcur Curtailed production
PDR Demand response actions
R Resistance Q Reactive power V Voltage X Reactance Z Impedance δ Voltage angle
1
1. INTRODUCTION
European Union's targets to increase the share of energy from renewable sources to 20% by 2020[1] has been followed by increasing amount of distributed gener-ation(DG) connected to distribution networks. Also other distributed energy re-sources(DERs) have become more common in medium(MV) and low voltage(LV) distribution networks. Controllable loads, electric vehicles and energy storages are immersing with the technology evolving around them.
The traditional power system where the generating units are large and centralized, and the power ow is unidirectional from generation to loads through transmission and distribution networks, is undergoing signicant changes due to the growth of DG. DGs and other DERs are more often located far from transmission network and it is often cost-ecient to connect them to the nearest network node, along or at the ends of distribution feeders.[2] The currently passive design and control of existing distribution networks needs re-evaluation with the ongoing changes. The networks are oversized to reliably operate under all possible loading conditions, even if the extreme conditions occur very rarely. In order to mitigate the eects that connecting DGs to the existing networks can cause, utilization of active resources is needed.[3] The main challenges are related to voltage quality, equipment thermal ratings, protection blinding and increased fault currents caused by bidirectional power ows[2].
Connecting a DG unit to a weak distribution network raises the voltage level in the network and highest network voltage can no longer be found at the substation. Usually the voltage rise eect is the limiting factor of the connection capacity of the DG unit.[4] Due to the lack of active voltage control methods in these passive networks, reinforcing the network (i.e. upgrading the conductor size) or building a dedicated feeder have been the traditional practices to overcome the voltage rise problem. Considering the increasing penetration of DGs these practices can cause high costs due to the low utilization of the network assets.[5]
1. Introduction 2 Active voltage control methods introduce alternative means to mitigate the voltage rise problems. When applied to existing distribution networks, active voltage control methods have increased the network's DG hosting capacity, thus reducing the DG connection costs[6]. The methods can be based on local measurements or the control actions can be coordinated somehow. Local control of terminal voltages of DGs by limiting real power output(production curtailment) or by adjusting DG reactive power output using automatic voltage regulator (AVR) are examples of methods that operate based on local measurements. These methods do not necessarily require any data transfer between network nodes which reduces the cost of implementation.[5] As the complexity of the network topology grows with increasing amount of DERs, local measurement based active voltage control can become inadequate. Due to the lack of communication, the local control actions may cause clashes with each other. In Coordinated Voltage Control (CVC) the active resources are utilized in coor-dination and the control actions are determined based on more comprehensive in-formation on the state of the distribution network. The actions are executed e.g. by altering target set points of automatic voltage control(AVC) relay controlling on-load tap changer(OLTC) at primary substation and controllers of the DG units simultaneously. In networks with simple topology the coordinated control actions can be determined according to an order of control rules. However, in networks where several controllable components exist, optimizing algorithms should be used to calculate optimal set points values for each individual resource. If the number of resources is large, then some kind of aggregation of the small scale resources is required.[7]
The given problem with reverse power ows applies also to low voltage(LV) distri-bution networks. Small-scale DG units, photovoltaics(PV) panels particularly, are widely connected to European LV networks. The output of PV units is stochastic due to varying, location specic, weather conditions i.e. solar irradiance and tem-perature. The aggregated generation amount of PV units can be signicant during peak production times, and combined together with low load periods can cause the reverse power ows and have eect on voltage quality. Especially because the load on residential feeders is low when PV generation peaks midday, and the peak load can be found during times of no or low generation.[8, 9] The same active voltage control methods can be applied to LV networks but the eciency varies due to the dierence in characteristics of MV and LV networks, and available resources.
1.1. Objectives and scope of the thesis 3 Monitoring and controlling both MV and LV grids eciently from a control cen-ter(CC) is becoming complex to realize as the amount of measurement devices and active resources are increasing in both networks. Distributing the automation bur-den to lower levels of automation can facilitate this issue. Data transfer across the network will decrease as the information is aggregated closer to eld. Only neces-sary information is sent upwards from the lower levels of automation. This provides means for better utilization of large amounts of small-scale DERs in LV networks. Within IDE4L project, Substation Automation Units(SAUs) at primary and sec-ondary substations have been designed for monitoring and control purposes at sub-station level. The SAU collects measurements, runs state estimation and forecasting algorithms, and calculates control actions to optimize the network operation or to solve congestions in the network level it's responsible of. Coordination among CC and the lower level SAUs is required in order to prevent unnecessary control actions. This can be achieved by setting some sort of control hierarchy among the decision making actors.
1.1 Objectives and scope of the thesis
This thesis presents a proof-of-concept of the automation and communication ar-chitecture, and performs a case study of CVC scheme on LV distribution network. The decision making is decentralized to secondary substation. State Estimation and Power Control algorithms are introduced and realize the CVC from SAU at the secondary substation.
The objectives of thesis' work are to
1. Verify interoperability of the decentralized automation system and algorithms 2. Verify the correct operation of the coordinated voltage control algorithm in
real-time simulations
3. Analyze and compare the performance of coordinated voltage control in real-time congestion management with other control schemes
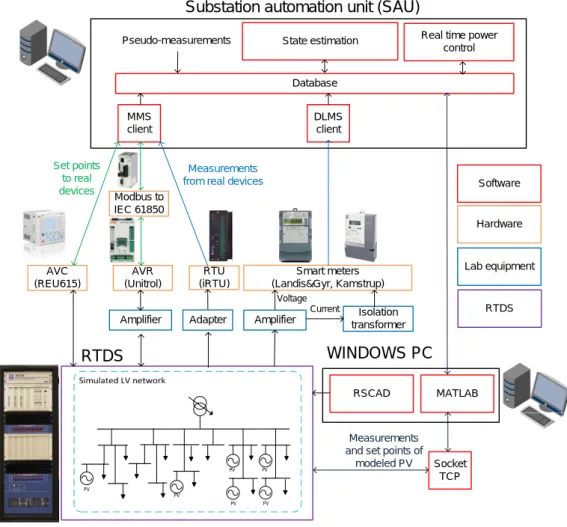
The simulations are run in Real Time Digital Simulator(RTDS) environment. The simulation network in the real-time environment will resemble a real LV distribution network. Real-time simulations are benecial as data exchange and communication delays of real network operation are taken into account. Further, external intelligent
1.2. Structure of the thesis 4 electronic devices(IEDs) are connected to the simulation environment to measure the model and perform control actions similar to real network operation.
The case study excludes upper level controllers in the future distribution network control hierarchy presented in this thesis. Thus Blocking of On-Load Tap-Changers of Transformers algorithm, which could also be utilized to coordinate operation among SAUs, is not included in the case study, but is presented to provide a complete view of the control architecture.
The tests are conducted as a part of IDE4L project and objectives aim to prepare the presented algorithms for future eld demonstrations[10].
1.2 Structure of the thesis
The thesis begins by discussing traditional distribution network design and planning principles in Chapter 2. The chapter then goes on to discuss impacts of DG in MV and LV distribution networks and introduces predominant voltage control principles. Further, the chapter introduces controllable resources that can be utilized in active voltage control. Last topic in the chapter is coordinated voltage control. Possible control architectures and future distribution network control hierarchy are discussed within the subject.
Chapter 3 introduces the aforementioned Substation Automation Unit and what it consists of. SAU interfaces, functions and database are described along with the data models used in modeling dierent system parts, parameters and attributes. Chapter 4 proceeds to describe algorithms required in realizing a coordinated voltage control scheme. State Estimation, Power Control and Blocking of On-Load Tap Changers of Transformers algorithms are introduced. To further explain how these algorithms work together in real-time, an additional section is added.
Simulation network model and laboratory simulation environment including the IEDs connected to the system are introduced in Chapter 5. Connections and imple-mentation of the operators in the simulation system are also described. The tests consist of dierent simulation sequences and the test results are evaluated by cho-sen key performance indicators(KPIs) precho-sented in Chapter 6. Chapter 7 precho-sents calculated KPIs and graphs for each individual simulation sequence under two dier-ent network conditions. Chapter 8 summarizes the simulation results and discusses directions for future work. Finally Chapter 9 concludes the contents of the thesis.
5
2. ACTIVE VOLTAGE CONTROL IN
DISTRIBUTION NETWORKS WITH
DISTRIBUTED GENERATION
In traditional power system the generating units are large and centralized, and the power ow from generation to loads through transmission and distribution networks is considered unidirectional. In radial distribution networks voltage will gradually decrease along the feeder with highest voltage residing at the substation bay. The voltage drop along the feeder is proportional to varying loading and line length. Therefore the lowest possible network voltage can be traditionally found at the end of the feeders during times of maximum loading. The voltage drop along the feeder has been network dimensioning principle in traditional passive network planning. With correctly chosen MV voltage level, OLTC used to boost MV network voltage at the HV/MV substation has traditionally been sucient automatic voltage control method in distribution networks. Manually changing tapping of MV/LV transform-ers o-load has been used to further oset the voltage drop in MV and LV networks to keep customer voltages at acceptable levels.[11]
With increasing amount of DG connected to the distribution networks, the afore-mentioned assumptions are no longer valid. Therefore, the traditional passive design and control of existing distribution networks needs to face changes. Active voltage control methods have been developed to address these issues by utilizing existing and new passively operated active resources. These often reduce high connection costs of DG units and increase protability of the investments, in other words increase the network's DER hosting capacity.
This chapter presents challenges that emerge with the increasing level of DG con-nected to distribution networks, and the required changes to traditional voltage control principles. These may be used to mitigate the negative eects and allow in-creased DG capacity to be connected. These measures will ensure quality of supply
2.1. Design and planning of traditional electricity distribution networks 6
HV/MV
Load GridMV/LV
Load
Figure 2.1 Traditional radial distribution network design
and operating within allowed network voltage limits while providing cost-savings with better utilization of the resources.
2.1 Design and planning of traditional electricity distribution
networks
The original function of distribution networks is to deliver power generated in the transmission network to end customers. The electricity distribution consists of MV and LV networks. The voltage level is adjusted along the path to economically suitable value in HV/MV primary and MV/LV secondary substations considering capacity, operational costs and capital cost. For example, higher voltages increase substation investment costs but result in lower power losses, and longer feeders can be fed with higher voltages as the voltage drop per unit length of the feeder is lower. MV networks supply large customers, such as industrials loads, directly but majority of the customers are connected to LV level and supplied via MV/LV secondary substations and LV networks. The design can vary in dierent countries. In some countries an additional HV or MV voltage level can be in use, e.g. 33kV to 11kV.[11]
The line types in MV and LV networks vary with the preference by country, en-vironmental surroundings and network location. In rural areas overhead lines are generally in use. Overhead lines can utilize air as insulator and are easier to con-struct. Underground cables are common in urban areas. Underground cabling im-proves system reliability but has higher investment cost than overhead lines. Other possible line types are overhead lines with covered conductors and aerial cables.[11] Distribution networks are operated radially even though they are built in open ring or meshed topology. Design of traditional radial distribution network is illustrated in Figure 2.1. In open ring structure two feeders are connected at the end of the
2.1. Design and planning of traditional electricity distribution networks 7 feeders, and an open switch during normal operation separates the feeders. Similarly two substations can be connected via a normally open switch. By closing such switches back-up supply can be activated during network faults or maintenance. The main advantages of radial network design are smaller fault currents and easier implementation of fault isolation, protection and voltage control.[11]
Quality, reliability and safety of supply are of major importance when planning the distribution networks. Utilities search for cost-eective solution in terms of meeting expectations of national regulations, standards and other technical guidelines. The voltage quality experienced by the customers is determined mainly at distribution network level. This is due to use of OLTC in HV/MV primary substation. One limiting factor in network planning is the voltage drop along the feeder from the HV/MV primary substation to the vicinity of the customers. For example, a voltage drop of 5% can be permitted in the whole MV network, and another 5% in LV. In radial network the maximum voltage drop can be calculated during periods of maximum loading at the end of the feeder. Majority of supply interruptions seen by customers are caused by faults in distribution networks. The number and the duration of outages is aimed to be kept within reasonable levels. Radial overhead lines, for example, are prone to environmental conditions, such as snow loads or windy storms. Achieving high levels of reliability can be dicult economically.[11] Economic consideration is required in capital investments. Cost of losses, expected maintenance costs and outage costs during supply interruptions aect the decision making of Distribution System Operator(DSO). Network reinforcement investments in order to supply more LV network customers are large proportion of the capital investments. Network losses increase power ows through the distribution system and system components. Therefore some component ratings need to be increased to take the losses into account. Losses in LV networks need to be fed from upper voltage levels, and therefore losses in lower voltages are aimed to be minimized. The technical aspects alone do not guarantee optimal solutions for the utility. Economic assessment of costs and return of investments through national regulation is also required.[11]
In general the introduction of DGs and other DERs in the MV and LV distribu-tion networks, and tightening requirements for quality of supply and reliability, e.g. allowed interruption durations, alter many of the traditional planning and design principles and pose challenges for the DSOs. Also during the past ten years a lot
2.2. Voltage quality requirements in distribution networks 8 has changed in the national regulatory frameworks that aect the DSO's investment decisions. Therefore, for example in Finland the recent investment trend to increase reliability by reducing outage times has been replacing overhead lines entirely with underground cabling in both rural and urban areas.
2.2 Voltage quality requirements in distribution networks
Network users' appliances are designed to tolerate certain voltage levels. Majority of voltage supply conditions fall within these limits, but too large deviations from the nominal voltage can result in malfunction or breaking of the equipment or network components.
European standard EN 50160 denes requirements for voltage characteristics at points of customer connection in distribution networks. The characteristics have a distinction made between continuous phenomena and voltage events. Continuous phenomena include power frequency, supply voltage variations and rapid voltage changes, whereas voltage events include interruptions of the supply and voltage
dips. According to the standard, the standard nominal voltage in LV networks Un
is 230 V. The supply voltage variation under normal operating conditions is set to:
95% of the 10 minute mean root mean square(r.m.s.) values should be within ±
10% of the nominal voltage at the customer connection point. All 10 minute r.m.s.
values are required to be within range ofUn+10%/-15%. For special remote network
users, the same +10%/-15% limit holds, and the users should be informed about the conditions.[12]
These are used as the minimum requirements as DSOs or national regulation usually sets stricter requirements in dierent countries. In network planning even stricter requirements for voltage quality are used.
2.3 Impact of distributed generation in distribution networks
Optimal locations for DG units are more often far from transmission network and from the owner point of view it is cost-ecient to connect the units to the nearest network node available. Connecting DG units along or at the ends of distribution feeder will alter the assumption of unidirectional power ows in the distribution network. Voltage prole along the feeder will change with the introduction of reverse
2.3. Impact of distributed generation in distribution networks 9
Figure 2.2 Simple radial distribution network with distributed generation
power ows. The results will have eect on existing voltage control and protection strategies.[4] Protection related issues are out of the scope of this thesis, and the thesis focuses on voltage control and voltage quality.
Voltage rise eect caused by DG is often the factor limiting connection capacity of the DG unit in weak distribution networks[4]. DSOs may set criteria how much the voltage in all buses can rise due to connection of the DG, e.g. 3%. In passive distribution network planning, interconnection studies consider DG as a negative load and the connection capacity is derived from calculations under two extreme loading conditions, where loading is at maximum and generation at minimum, and where loading is at minimum and generation at maximum. The conditions represent the worst case scenarios for voltage quality[6].
2.3.1 Voltage rise eect
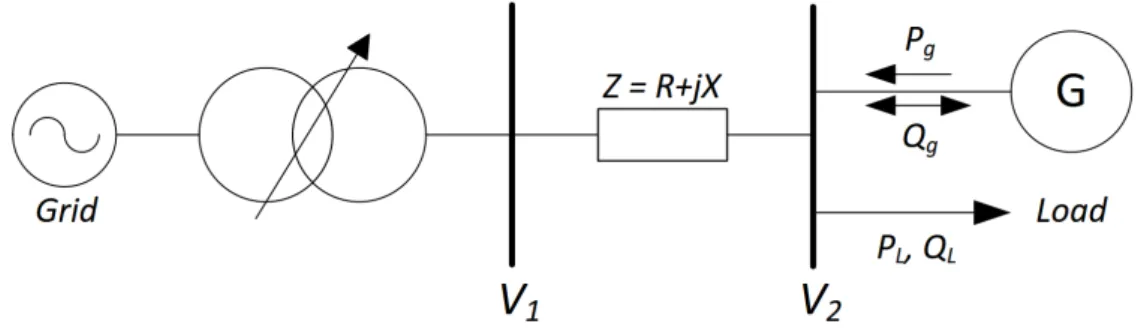
To help examine the impact of DG in distribution network voltage, Figure 2.2 presents a simple radial distribution network with a DG unit connected at end
of a feeder. V1 is the primary transformer secondary busbar voltage, Z is the line
impedance and V2 is the voltage at load and DG connection point. The gure
illus-trates bidirectional power ow and the eect of DG unit to bus voltage at the end of the feeder. The voltage dierence between buses 1 and 2 can be calculated from
V1 −V2 = (R+jX)∗ P −jQ
V∗2 , (2.1)
2.3. Impact of distributed generation in distribution networks 10
and with −Qg the DG unit generates reactive power to the network. If V2 angle
is set as 0, and it is assumed that the voltage angle between phasors V1 and V2 in
Equation 2.1 is small, the imaginary part in the equation can be neglected. This results in approximation
∆V =V1 −V2 ≈
R(PL−Pg) +X(QL±Qg)
V2
. (2.2)
Depending on DG real and reactive power production, real and reactive power load, and reactance per resistance(X/R) ratio of the line, Equation 2.2 indicates that DG can either increase or decrease the voltage drop along the feeder[13]. If the DG unit generates reactive power or does not export any reactive power to grid, the
voltage drop along the feeder will decrease due to the real power generated, Pg.
Furthermore, if the generated real power is larger than the feeder load PL, the DG
connection point voltage V2 will be greater than substation voltage V1. The power
ow in the feeder will be reversed and will cause a voltage rise at the DG connection point.
In case of lightly loaded distribution network or in worst case loading scenario, where real and reactive power load is zero, the maximum voltage rise eect can be approx-imated by Equation 2.3. The impact of DG unit on the network voltage depends on the unit's real and reactive power output. The equation presents situation where DG unit generates reactive power.[4]
∆V ≈ RPg+XQg
V2 (2.3)
Even if the DG unit would consume reactive power(−Qg), the real power output(Pg)
of the unit would generally be larger and therefore DG units almost always introduce a voltage rise to the network at their connection points.[4]
2.3.2 Voltage rise mitigation
The DG voltage rise eect falls under continuous phenomena in EN 50160, i.e. it is a long term voltage problem, thus requiring a scheme to alleviate the problem. At present the predominant practices to mitigate the voltage rise eect have been, ac-cording to the prevailing passive network planning approach, network reinforcement
2.3. Impact of distributed generation in distribution networks 11 by increasing the feeder conductor diameter or dedicating a feeder for the DG unit. Upgrading conductor size will signicantly reduce resistance of the conductor, and slightly reduce its reactance, and therefore mitigate the voltage rise eect according to the preceding equations. However, with the rising amount of DER connected to distribution networks, proceeding with the passive approach will lead to considerable costs.[4, 5]
Taking active voltage control methods into use, the control capabilities of DERs are used to mitigate the voltage rise eect and to improve voltage quality. In addition to traditional control of the substation voltage with OLTCs, allowing DG units to utilize reactive power capability or to curtail production when necessary, or utilizing reactive power compensation devices in the network, are benecial in maintaining network voltages within allowed limits. The OLTC control method could be changed from maintaining constant substation target voltage to increasing or decreasing the target voltage based on voltages in the network. Also controllable loads(demand response) and energy storages could be utilized. Simplest active voltage level man-agement methods require only local measurements and no data transfer between network nodes. In these cases, the controllable resources are operated only consid-ering local voltage problems.
Connection of DG, especially PV, in LV networks has recently introduced the voltage rise eect in LV networks[8]. Due to nature and high penetration of PV micro-generation in LV networks, reactive power control may not be sucient voltage control method. PV based generation peaks during sunniest hours which are often outside of peak demand hours.[14] Also due to lower X/R ratio in LV networks[15], reactive power control is not as ecient according to Equation 2.2. In LV networks the most eective solution is to control tap changer at secondary substation[16]. Application of conventional OLTCs to secondary substation transformers can be expensive but new cheaper technology has been introduced in [17].
Active voltage control based on wider information of the state of the distribution net-work is referred to coordinated voltage control(CVC). CVC methods are discussed in Section 2.5.
2.4. Controllable resources in active voltage control 12
2.4 Controllable resources in active voltage control
Controllable resources can be utilized in active voltage control to keep network voltages within allowed limits and to reduce e.g. network losses. These resources include on-load tap changers of transformers, real and reactive power(power fac-tor) of generation units and controllable loads. Reactive power compensation using power electronics devices can be utilized in control of reactive power ows continu-ously. Capacitor banks installments in distribution networks manage reactive power ows at primary substations in European type networks. Also energy storages can be charged during times voltage rise needs to be mitigated but are not studied in this thesis. In this section, active resources are introduced in terms of local voltage control. Increasing the utilization of all available DERs and coordinating the opera-tion among them can be advantageous. This is further discussed under coordinated voltage control.
2.4.1 On-Load Tap Changer
Primary substation main transformers are equipped with an OLTC. In passive ra-dial distribution networks OLTC is the key component in voltage control. OLTC alters the transformer winding turns ratio and therefore controls the voltage of the substation secondary side busbar. The operation can be done under load i.e. when the transformer is energized. OLTC is normally operated automatically using AVC relay, but can also be operated manually. The operation is limited by tap changer steps and step size. The step size voltage normally lies between 0.8% and 2.5% of the rated voltage.[18] In Finland HV/MV transformer OLTCs typically have 1.67% step
size and e.g. ±9 steps from nominal. Fewer steps have been proposed for MV/LV
OLTCs. With 2.5% step size and ±3 steps from the nominal, the voltage range is
between 0.925 pu and 1.075 pu, resulting in 15% total control range.
In principle the substation voltage is automatically controlled. AVC relay operating the OLTC aims to maintain constant substation voltage by setting a target voltage and a dead band. The target voltage and the dead band are usually determined by assuming the worst case scenario i.e. winter peak load. Time delay is incorporated before operating the tap changer when transformer secondary voltage diers from the set target voltage more than the dead band value. This limits the number of tap changer actions and prevents unnecessary control actions due to short-term voltage uctuations.[19]
2.4. Controllable resources in active voltage control 13 MV/LV distribution transformers use xed o-load tap changers as standard. Tap changer operations are done manually in de-energized network. Conventional OLTCs applied to distribution transformers are expensive, can induce hunting behavior and have problems with reverse power ows. Vacuum switch based OLTCs for MV/LV distribution transformers have been recently introduced due to increased amount of DGs connected to LV networks. As a simpler and cheaper alternative the vacuum switch based OLTCs have been successfully used to control LV network voltage as a part of active distribution network management.[17, 20]
Using OLTC as a voltage control resource is advantageous mainly due to couple of reasons. OLTC actions change the voltage in the whole network downstream from the transformer and these actions can either lower or increase the network voltage. Furthermore the actions will not cause increased losses in the network excluding possible losses from the network current change.[21]
The drawback of OLTC voltage control with DG is that when there is DG connected to only one feeder, altering OLTC turns ratio to decrease voltage in that feeder will also change voltages in other feeders. The other feeders may not be experiencing same voltage quality issues as the one with DG so tap changer action can make the situation worse in a healthy feeder.[21] OLTC is also a mechanical component and therefore is subject to wear and requires maintenance. Therefore the number of tap changer actions should be minimized.[18]
An AVC relay is usually provided with Line Drop Compensation(LDC) functionality where a remote bus voltage is aimed to be kept constant instead of the substation voltage. LDC unit uses measured secondary voltage and secondary current multi-plied by a line drop impedance to simulate voltage drop across the feeder, and thus to calculate the voltage at the remote control point. This scheme requires no com-munication link between the remote bus and the transformer. Nevertheless, many OLTCs are operated with the LDC function disabled due to simpler control scheme and prevention of unnecessary errors.[13] An example of LDC error is when DG generation exceeds load, magnitude of reversed current causes voltage rise from the substation to the DG connection point but LDC considers this as a voltage drop and orders OLTC operation to increase transformer secondary busbar voltage.[15] Therefore LDC is not used in this thesis' simulations.
In a scenario where OLTCs across dierent voltage levels are operated in series, co-ordination between cascade tap-changers is needed to avoid unnecessary tap changer
2.4. Controllable resources in active voltage control 14 actions and voltage uctuation. Problems occur if during upper level voltage devia-tions lower level OLTC operates before the upper level OLTC and reverting acdevia-tions are needed at the lower level. The number of unnecessary tap changer operations results in increased required maintenances and reduced OLTC life cycles, and in-creases voltage out of bounds duration. Graded time(GT) delays are commonly used in cascade OLTC setup. In GT method dierent time delays are assigned for each cascade OLTC operation. Upper level OLTCs have lower time delay compared to lower level OLTC and therefore the delays ensure that upper level OLTC op-erates rst, as suggested in [22]. The GT delays are set by considering the worst case scenario for voltage restoration at consumption points. Alternatively commu-nication can be used to replace the GT delays with blocking signals. This enables reducing the time delay from worst case correction time to upper level OLTC opera-tion time.[15] Therefore an algorithm to improve OLTC coordinaopera-tion and to reduce delays is introduced in Section 4.3 and could be used with cascade OLTC setup. However, with increasing amount of DGs it would be benecial to adjust the OLTC target voltage according to actual network state and the maximum or minimum network node voltage. The node could be located for example at the connection point of one of the DGs in the network. This would require measurements or estimates from critical network nodes and is, in fact, the simplest form of Coordinated Voltage Control as presented in [19].
2.4.2 Real and reactive power of distributed generation
At present DG units connected to distribution networks are considered as passive negative loads with xed real and reactive power in network planning. The focus in planning is on DG interconnection, and the voltage control principles are not altered.[2] Therefore, most DSOs require DG units to operate in constant power factor mode with unity power factor and thus without DGs taking part in voltage control[23]. However, the real and reactive power control capabilities of the DG units can be used in active voltage level management locally. These capabilities vary with the type of the DG unit. Typical operating modes for DG units are voltage control mode, power factor control mode and VAr control mode with xed VAr output. In voltage control mode, DG unit controls its reactive power output based on terminal voltage. In power factor mode, the real and reactive power ratio P/Q is kept constant.
2.4. Controllable resources in active voltage control 15 Real power generation curtailment can be used to reduce the voltage rise eect. This in current practice would be limited to extreme situations where reactive power consumption is insucient for maintaining voltage within allowed limits. The prob-ability of these maximum generation and minimum loading situations is low and therefore curtailment can be only protable if the connection capacity of DG can be increased in return.[24] Intermittent energy sources such as wind and PV are usu-ally operated at maximum available power and therefore their real powers cannot be increased on request. In [25] production curtailment of intermittent wind resources increased the DG hosting capacity in all network nodes with curtailment. Further increased curtailment was found to give diminishing returns i.e. be less attractive. In [26] peak shaving is discussed in terms of DG hosting capacity. By limiting the peak real powers derived from yearly generation curves of intermittent energy sources, considerable higher connection capacities can be allowed with only a small percentage reduce in yearly produced energy i.e. lost income. Limiting the power cut only to necessary locations considering the eect of DG to network voltages is also suggested.
On the other hand, reactive power capability of the DGs can be used to oset the voltage rise locally. In [27] a value for reactive power consumption was calculated to mitigate voltage rise at DG connection point. From DSO's point of view, using this method can represent similar situation as if no DG is connected to the network node. However, consuming reactive power in voltage rise mitigation decreases power factor and increases losses in the network due to increased reactive power ows. Therefore an evaluation of increased losses versus the eectiveness of reactive power control in voltage quality management should be considered in the reactive power control scheme.[6] This may also increase the need of reactive power compensation capacitors at primary substation as reactive power ows from transmission systems are tried to be kept at minimum by DSOs in order to avoid reactive power charges set by transmission system operators(TSOs)[28]. Similarly supplying reactive power in overexcited mode could be used to support local undervoltages.
With synchronous machines the reactive power control is realized by controlling cur-rent supplied to machine eld winding and is done by automatic voltage regulator (AVR)[29]. New generation AVRs are capable of operating in both voltage control and power factor mode, and switching between the modes if voltages are out of bounds. AVRs are also capable of reactive power sharing for generators connected in parallel.[30] Power electronics interfaced DG such as PV units have varying
reac-2.4. Controllable resources in active voltage control 16 tive power capability depending on year, day and weather as the capability is bound to real power output. PV inverters are capable of injecting or consuming reactive
power. The capability can be modeled by the rating of the PV inverter S, and the
real power output of the PV array Ppv as shown in Figure 2.3 [8]. Reactive power
limits ±Qg are found by projecting Ppv intersection points with theS semicircle on
Q-axis. The inverter operation allows continuous reactive power support. However, in requirements of IEEE 1547 interconnection standard an unity power factor op-eration is still a requirement for LV PV inverters. This is expected to be changed to permit injection or consumption of reactive power as the penetration of DER increases.[8, 31] With high penetration levels of PV, the operation of inverters has to be coordinated with other voltage control equipment to fully benet from the reactive power capabilities of the DG units [8].
S Q +Qg -Qg P Ppv
Figure 2.3 Reactive power capability of a PV inverter
If the eect of reactive power control is inadequate, increasing inverter rating and including real power curtailment of PV inverters in the control scheme can be used to improve voltage quality in the network. Increasing inverter rating increases re-active power capability according to Figure 2.3.[32, 33] Curtailing PV generation in residential feeders with high PV penetration can be benecial as typically PV generation peaks during midday when the demand is low, introducing voltage rise. Though this is often mitigated by reverse load proles of commercial and industrial feeders.[32]
2.4. Controllable resources in active voltage control 17 By controlling the power factor of the DG unit appropriately, the voltage rise eect can be mitigated and at the same time connection capacity of the DG unit can be increased and less generation needs to be curtailed. X/R ratio of the network inu-ences the eectiveness of reactive power voltage control. Therefore reactive power compensation is particularly eective in weak distribution networks.[24] Possible drawbacks of local measurement based voltage control of DG units are clashes with OLTC voltage control schemes[34] problems in loss of mains protection schemes[35]. In fact, the possibility generally is not in use because DSOs are limiting the power factor, but it is a cost-eective alternative to network reinforcements[36].
Some countries require reactive power capability from DG units. In Germany, grid codes dene that DG connected to MV distribution network must be able to be
operated with an active power factor at any point between 0.95ind to 0.95cap. The
grid code also sets voltage dependent reactive power characteristic Q(U), where
reactive power is injected or consumed only when voltage thresholds are exceeded, as introduced earlier.[37] This, however, can result in uneven reactive power dispatching among DGs as voltage deviations are larger depending how far the DG unit is from the substation, increasing the need for reactive power capability[38]. Uniform power factor, where DG real power output determines the reactive power contribution of the DG unit is suggested in [38].
2.4.3 Controllable loads
Loads that could be potentially utilized in voltage control can be found from both MV and LV networks. Peak load reduction is a known practice to reduce energy costs in households. Load control has further uses beyond peak load reduction. Using load control in voltage regulation to enhance distribution network's DG hosting capacity has been suggested in [34]. Other advantages are limiting line current overloads and supplying consumers during low cost electricity periods.[34]
To enhance the hosting capacity, load control aims to mitigate the voltage rise eect. This is done by increasing loading during times when the intermittent DG is at maximum output and the demand without load control at its minimum. Switching on energy storage loads such as hot water storages is the most convenient option from customer point of view. Load control as a voltage regulation method has higher costs than other dynamic methods like DG curtailment or DG power factor control, but compared to the passive approach i.e. network reinforcement, load control as
2.4. Controllable resources in active voltage control 18 voltage control method remains competitive for DSOs.[34] On the other hand, DSOs could control loads indirectly by setting electricity prices for specic times of the day, which then would aect customer behavior.
These two types of control: direct and indirect approaches in changes of consumption of the end-use customers is dened as Demand Response(DR). The dispatchable DR is controlled by DSOs. DSOs can use DR in voltage regulation under normal and emergency conditions. Emergency DR programs have been developed to ensure network reliability during network disturbances. Incentive payments are provided to customers who agree to reduce their loads for network reliability purposes. DSO then calls committed customers to reduce the loads during these situations.[39] In [40] the eects of load curtailment in feeder's voltage prole during transmission system disturbance with varying amount of DG units connected to the system were studied. Reliability of supply to critical loads was achieved in all cases.
In general DSOs should be more encouraged to include automation of the LV grids more into active network management. Home Energy Management Systems(HEMS) could be utilized to include DR in DSO's voltage regulation under emergency situ-ations, or to sell ancillary services in normal conditions. DR could be also realized using interfaces for direct load control in smart meters.[3]
2.4.4 Reactive power compensation using power electronics
or capacitor banks
Static VAr Compensator (SVC) and Static Synchronous Compensator (STATCOM) are most common types of power electronics controlled reactive power compensator. Both are able to continuously control reactive power output at their connection point by injecting or absorbing capacitive or inductive current. Facilitated, both of these can be classied as Flexible AC Transmission Systems(FACTS) devices. In transmission systems FACTS are considered key components in reactive power support and controlling power ows to mitigate congestions.[29] When applied to distribution networks, D-prex is often used. D-STATCOMs have been successfully used in voltage regulation of distribution networks in [41].
DSOs may install small number of shunt capacitor banks to distribution networks. These capacitor banks act as a source of reactive power and can be connected to,
2.5. Coordinated Voltage Control 19 or disconnected from, the network with switches according to reactive power com-pensation needs. During times of minimum load, when the DG generation aects the network voltage prole most, capacitors taking part in voltage regulation would be disconnected from the network[42]. Capacitor banks in distribution networks are in wider use in North America. In Finland capacitor banks are installed only at primary substations to control reactive power ows from and to transmission networks.
Optimal location planning and switching operations are needed to improve voltage quality and losses in the network. Switching operations cause transients and high-frequency harmonics which, without external ltering equipment, are unwanted dis-advantages. With high penetration of intermittent PV generation, faster and more exible control is required, and capacitor banks may not be sucient technology to overcome the challenges.[43]
2.5 Coordinated Voltage Control
To achieve improvements in voltage quality while increasing the network's DG host-ing capacity at the same time, the available active resources in the distribution network need to be better utilized. For this purpose CVC methods have been devel-oped. CVC is dened as control scheme where actions are determined based on more extensive information of the distribution network state in [28]. The input data can be real-time measurements from the network nodes or calculated state estimates, and the control actions can be either predetermined or the control can operate in real-time. Determining a control schedule requires accurate load and production forecasts, obtaining which can be dicult. In real-time operation extensive data transfer is required between the network nodes and the actor that determines the control actions. Typically controllable resources include OLTC and DG reactive powers but also other earlier introduced controllable resources can be included in the control scheme.[28] Compared to local measurement based voltage control, even a simple application of coordinating OLTC with real power curtailment in voltage control scheme greatly increased connection capacity of the DG unit in [6].
CVC methods can be based on simple control rules or complex optimizing algorithms depending on the network topology. Computation time required to solve the control actions increases with the complexity of the network. In simple networks, where
2.5. Coordinated Voltage Control 20 only few controllable resources exist, rule based methods are adequate. In tradi-tional radial distribution networks controlling substation voltage or reactive power of DERs, or both, based on network maximum and minimum voltage could be a suitable case for rule based CVC. With increasing number of controllable resources in the network, dening the control rules can be burdensome and complex. When active resources are utilized extensively and cost factors are added in the equation, e.g. aiming to minimize network losses or tap changer actions, optimizing algorithms are needed.[7]
The amount of available real-time measurements in distribution networks has in-creased due to installment of Automatic Meter Reading(AMR) devices. These, when utilized, will improve accuracy of network state estimation. With accurate state estimates, more accurate input data can be provided for CVC algorithms.[44] Possible implementations of control architectures for active network management are discussed in next subsections. CVC scheme with a cascade control architecture, where solving and determining of control actions is distributed across voltage levels, is introduced. Case study is then performed in this thesis on CVC in LV network. The optimization problem and the CVC algorithm implementation are described in detail in Chapter 4. Other algorithms used in the scheme are also presented in the same chapter. The algorithm utilizes all DERs that are available in the simulation network presented in Section 5.2. Controllers realizing the CVC actions in the simulation system are presented in Section 5.3.
2.5.1 Control architectures and implementation
Dierent types of control strategies, i.e. active network management schemes, can be used in distribution networks: Centralized, semi-coordinated or decentralized. The decentralized architecture utilizes local controls and aspires to cost savings using only limited communication or no coordination at all. Fast response and not being subjected to communication failures are advantages of decentralized methods. For example multi-agent systems are used in intelligent decentralized control systems. As many of the methods include a coordinating component, some of the decentralized methods could be described as semi-coordinated.[45]
In centralized architecture all intelligence(i.e. measurements and static data) is gathered into a central system. The logic behind control actions is concentrated
2.5. Coordinated Voltage Control 21 there. Centralized approach requires investments in sensors, and communication and control infrastructure.[27] Most CVC methods are centralized and therefore the algorithms can be implemented as part of existing Distribution Management Sys-tem(DMS). In centralized control architecture, every function and decision making is concentrated in DMS. DMS combines network state estimation and network in-formation data from Network Inin-formation System(NIS), both of which are needed as inputs for CVC algorithms. Supervisory Control and Data Acquisition(SCADA) is commonly integrated into DMS, and provides real-time measurement data, net-work switching state and control possibilities to the scheme. CVC outputs, set point and reference values, can be then sent to the controllable resources directly through SCADA.[28]
Figure 2.4 Concept architecture of coordinated voltage control [28]
SCADA/DMS system can extend to LV network management with the integration of AMR infrastructure to the centralized system. In this advanced metering infras-tructure(AMI) smart meter information is widely available for real-time LV network monitoring and simple control purposes. With large number of controllable devices
2.5. Coordinated Voltage Control 22 and available measurements in the future distribution networks, it is benecial to store measured information and perform necessary control tasks decentralized also at lower levels of automation. This reduces data transfer to upper level CC and therefore enables improved utilization of small-scale DERs in network management. This type of decentralization enables cascade control architecture and aggregation of information in many levels. An example cascaded architecture of coordinated voltage control is presented in Figure 2.4. LV level controller installed at secondary substation aggregates information from LV side measurements and DERs, and is responsible of controlling DERs accordingly. It realizes control commands from up-per level CC and updates the aggregated information of the LV network to upup-per level.[46]
2.5.2 Control hierarchy in future distribution networks
In future distribution networks, according to IDE4L project approach[47], the con-trol is seen to be divided to three hierarchical levels: primary, secondary and tertiary control. Each control level operates in dierent network layer and with dierent de-ployment time.
Primary control is based on local measurements of each DER and therefore only local information is considered when making autonomous control decisions. The control actions could include reactive power control, transformer OLTC voltage control, or production curtailment in extreme cases, and the actions would take eect in the order of seconds or faster. As mentioned earlier primary control of DG units is generally not in use as unity power factor is often a requirement.[47]
Secondary control at primary or secondary substation level receives estimates of the network state and coordinates operation of primary controllers in the network area. Secondary control aims to minimize operational costs while ensuring voltage quality in the network. The required control actions are done in the order of min-utes. Secondary control is realized on primary or secondary substation level, or on both.[47]
Tertiary control is the highest level of the control hierarchy and it coordinates actions of secondary controllers, or orders and provides exibility services from commercial aggregators to optimize the network operation within voltage and conductor limits. The tertiary control actions are based on current and future network states from
2.5. Coordinated Voltage Control 23 state estimation and state forecasts. Tertiary control operates in a time-frame of tens of minutes to hours. Tertiary control is located at the CC.[47]
Coordination of the aforementioned controllers is seen to greatly increase the net-work's DG hosting capacity when assessing the situation versus passive network planning and control, or local measurement based voltage control.[3]
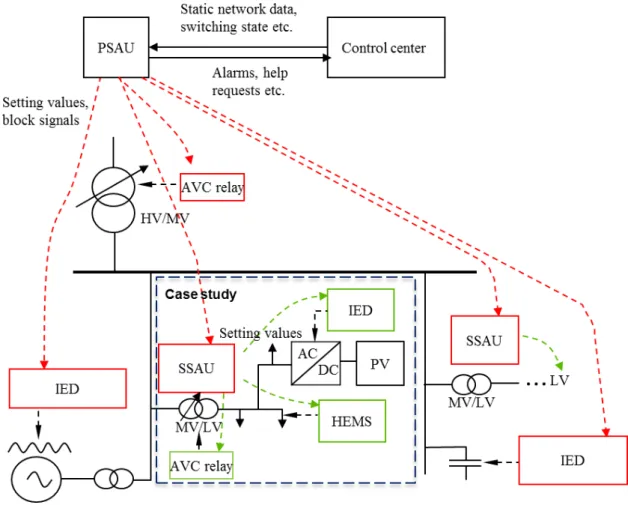
Figure 2.5 IDE4L control architecture of coordinated voltage control
Figure 2.5 presents the three hierarchical levels of IDE4L control architecture. The lower level controllers, Primary Substation Automation Unit(PSAU) and Secondary Substation Automation Unit(SSAU), realize the secondary control. The specica-tion of a SAU is further opened in following chapter. Case study of the thesis is performed on LV network.
24
3. SUBSTATION AUTOMATION UNIT
With the increasing amount of DERs in the networks, the active network manage-ment and automation schemes are becoming complex to realize. The amount of available measurements is increasing and utilizing these requires extensive commu-nication and data transfer across the network. Therefore a Substation Automation Unit(SAU) has been designed in IDE4L project to tackle these issues. With SAUs the automation burden can be distributed across hierarchical voltage levels. The SAU architecture concept in Figure 2.5 enables decentralizing monitoring and con-trol functions closer to eld on each voltage level. SAU collects measurements, runs state estimation and state forecasting and handles network power control, at its network location. PSAU is located at the primary substation and is responsible of MV network. SSAUs are located at the secondary substations and manage LV networks.[48]
A SAU consists of interfaces, database and functions as depicted in Figure 3.1. Data handling and storage is done by using relational database. The data stored in SAU is modeled so that it complies with latest standards IEC 61850 and IEC Common Information Model(CIM) to support interoperability. The SAU hardware can be e.g. a standard computer with Linux or Windows operating system.[48]
3.1 Interfaces and functions
Three types of interfaces are built within the SAU: interfaces to communicate with eld devices and controllers, interfaces to communicate with upper level con-trollers(other SAUs or DMS) and database interfaces within the SAU functions. Various protocols are used in distribution automation, IEC 61850 being the newest widely accepted standard.
Field devices and controllers can lack support to IEC 61850 so therefore Modbus with a gateway is used. DLMS/COSEM is common protocol in the eld of smart
3.1. Interfaces and functions 25
Substation automation unit(SAU), Primary(PSAU) or Secondary (SSAU) IEC 61850 MMS
Relational database management system (RDBMS) Interfaces Database Functions SAU Modbus Data acquisition Data storage Data reporting
Load and production forecast State estimation
State forecast Optimal power flow
Reading/Writing IED settings DLMS/COSEM Web Services (WS)
Figure 3.1 Substation Automation Unit [48]
metering, and is used to communicate with smart meters. Web services(TCP/IP, UDP/IP) are used to concentrate smart meter data when the meters are not directly accessible. MMS is suggested as application protocol for monitoring and control applications by the IEC 61850 standard.
The main functions of SAU are divided to monitoring and control functions. Mon-itoring functions are are acquiring, storing and reporting measurements, load and production forecasting, state estimation and state forecasting, and control function is the real-time power control by utilizing optimal power ow. The functions can be implemented using various programming languages. State estimation, power control and an optional coordinating algorithm for cascade OLTC operation are relevant to the CVC concept and thus further described in the next chapter.
3.2. Data modeling 26 PowerTransformerEnd PowerTransformerEnd RatioTapChanger BusbarSection ACLineSegment ACLineSegment ACLineSegment ACLineSegment EnergyConsumer SynchronousMachine ACLineSegment EnergyConsumer EnergyConsumer ACLineSegment EnergyConsumer EnergyConsumer ACLineSegment ACLineSegment PL1toPL2 ACLineSegment PL2 PL2to1056 ConnectivityNode Terminal 1056 ACLineSegment 1056to1070 ACLineSegment EnergyConsumer 1070 1070to585 EnergyConsumer 585 ACLineSegment 585to60 ACLineSegment EnergyConsumer 60 60to1136 EnergyConsumer 1136 0023toPL1-T1 0023toPL1-T2 PL1toPL2-T1 PL1toPL2-T2 PL1to2093 PL1to2093-T1 PL2to1056-T1 PL2to1056-T2 1056to1070-T1 1056to1070-T2 1070-LOAD 585-LOAD 1070-LOAD-T1 585-LOAD-T1 60-LOAD 1136-LOAD 60-LOAD-T1 1136-LOAD-T1 1070to585-T1 1070to585-T2 585to60-T1 585to60-T2 60to1136-T1 60to1136-T2 ACLineSegment PL2to2137 2137 PL2to2137-T2 EnergyConsumer 2137-LOAD 2137-LOAD-T1 PL2to2137-T1 2093 PL1to2093-T2 2093-LOAD-T1 EnergyConsumer 2093-LOAD PowerTransformer PowerTransformerEnd PowerTransformerEnd RatioTapChanger SS1056 BusbarSection ACLineSegment ACLineSegment F021 F011 ACLineSegment FD02/SC01 SS1056/LV1 FD01/SC01 F013 EnergyConsumer FD01/SCe2 ACLineSegment EnergyConsumer F022 EnergyConsumer FD02/Sce2 ACLineSegment F032 ACLineSegment FD03/SC02 F033 SS1056-LVBUS FD01/SCe2-LOAD FD02/SCe2-LOAD FD02/SC01-LOAD F011-T1 F011-T2 F013-T1 F013-T2 F012-T1 FD03/SC03 F021-T1 F021-T2 FD02/SC01-LOAD-T1 F022-T1 F022-T2 FD02/Sce2-LOAD-T1 F032-T1 F032-T2 FD03/SC01-LOAD-T1 F033-T1 F033-T2 FD03/SC03-LOAD-T1 SS1056-LVBUS-T1 EnergyConsumer FD01/SC01-LOAD FD01/SCe2-LOAD-T1 FD01/SCw2 ACLineSegment F012 EnergyConsumer FD01/SCw2-LOAD FD01/SC01-LOAD-T1 F012-T2 FD01/SCw2-LOAD-T1 F023-T1 FD02/SCw2 ACLineSegment F023 EnergyConsumer FD02/SCw2-LOAD F023-T2 FD02/SCw2-LOAD-T1 ACLineSegment F06 FD06/TN001 FD06/TN001-LOAD-T1 EnergyConsumer FD03/SC02-LOAD FD03/SC02-LOAD-T1 EnergyConsumer FD03/SC03-LOAD SynchronousMachine PV-FD03/SC03 F06-T1 F06-T2 EnergyConsumer FD06/TN001-LOAD ACLineSegment F072 ACLineSegment FD07/SC02 F073 FD07/SC03 F072-T1 F072-T2 F073-T1 F073-T2 FD07/SC03-LOAD-T1 EnergyConsumer FD07/SC02-LOAD FD07/SC02-LOAD-T1 EnergyConsumer FD07/SC03-LOAD SynchronousMachine PV-FD07/SC03 PV-FD07/SC03-T1 PV-FD03/SC03-T1 SynchronousMachine PV-FD07/SC02 PV-FD07/SC02-T1 ACLineSegment F082 ACLineSegment FD08/SC02 F083 FD08/SC03 F082-T1 F082-T2 F083-T1 F083-T2 FD08/SC03-LOAD-T1 EnergyConsumer FD08/SC02-LOAD FD08/SC02-LOAD-T1 EnergyConsumer FD08/SC03-LOAD SynchronousMachine PV-FD08/SC03 PV-FD08/SC03-T1 SynchronousMachine PV-FD08/SC02 PV-FD08/SC02-T1 SS1056-SECONDARY SS1056-T2 SS1056-T1 SS1056-PRIMARY SS1056-TAP Measurement SS1056-LVBUS-U 1056 EnergyConsumer PL1-LOAD Measurement PL1-LOAD-T1 BusbarSection SS1056-MVBUS SS1056-MVBUS-T1 Measurement SS1056-MVBUS-U SynchronousMachine PV-FD01/SCw2 PV-FD03/SC03-T1 PowerTransformer
Figure 3.2 Example of CIM network representation after CIM v15
3.2 Data modeling
IEC 61970-301 and IEC 61968-11 are collectively known as Common Information Model(CIM) for power systems. The IEC 61970-301 Energy management system application program interface (EMS-API) - Part 301: Common information model (CIM) base provides a standardized approach to represent power system resources as object classes and attributes along with the connections in between. The IEC 61968-11 Application integration at electric utilities - System interfaces for distri-bution management - Part 11: Common information model (CIM) extensions for distribution extends the base CIM for the needs of distribution networks and en-ables integration of DSO information systems.[49] Figure 3.2 depicts CIM network representation of transformer and two feeders.
3.2. Data modeling 27 equipment. Each white circle, a terminal, has association with one connectivityn-ode and a connectivitynconnectivityn-ode may associate with multiple terminals. Terminals are also dening points for connectivity related measurements.[49] The measurements are omitted from the gure as each terminal would include multiple measurements for phase voltages, powers or currents etc. The transformer model is based on transformer model after CIM v15 presented in [50]. TransformerEnds refer to the transformer's physical terminals and contain transformer parameters as well as the tap changer. ACLineSegments represent distribution lines between network nodes. SynchronousMachine models DERs that export active and/or reactive power to the network. EnergyConsumers model consumption. The used data model for network topology in SAU database combines the classes and attributes of the CIM standard and each network topology table is based on one or more CIM classes.
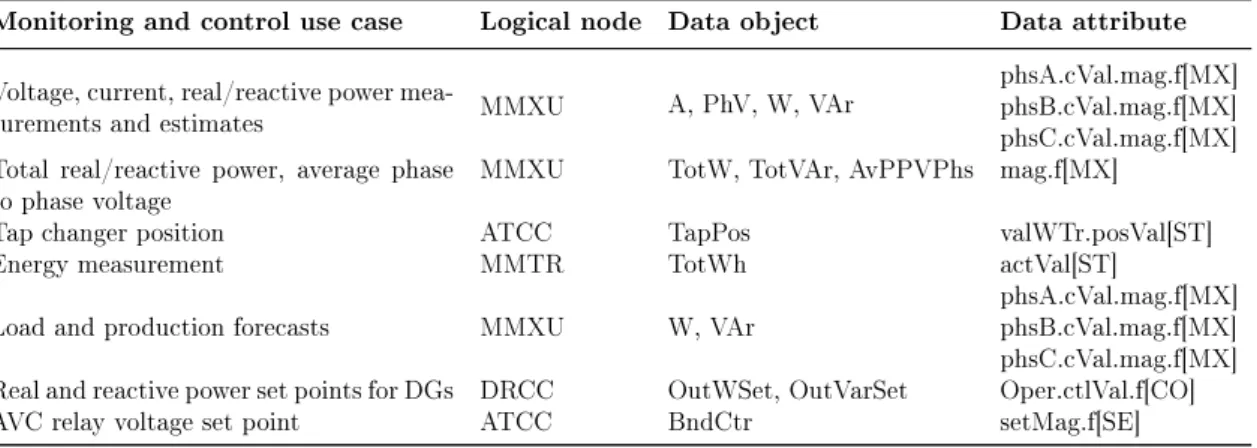
IEC 61850 data model is used in monitoring and control. In SAU database the monitoring and control data is presented using IEC 61850 logical nodes, data objects and data attributes. A logical node is the smallest part of a function that exchanges data and represents a measurement or control function. The devices that perform dierent measurement and control functions are modeled with physical devices and logical devices within a physical device. Data objects within a logical node each have a common data class type. The data objects consist of many data attributes and thus group the data attributes sharing the same function. Finally the data attributes represent elements of the data class e.g. value or timestamp. Table 3.1 presents monitoring and control data modeled according to IEC 61850. Similar structure can be found in the SAU database tables designed for the monitoring and control purposes.
Table 3.1 Monitoring and control IEC 61850 data model
Monitoring and control use case Logical node Data object Data attribute Voltage, current, real/reactive power
mea-surements and estimates MMXU A, PhV, W, VAr
phsA.cVal.mag.f[MX] phsB.cVal.mag.f[MX] phsC.cVal.mag.f[MX] Total real/reactive power, average phase
to phase voltage MMXU TotW, TotVAr, AvPPVPhs mag.f[MX] Tap changer position ATCC TapPos valWTr.posVal[ST]
Energy measurement MMTR TotWh actVal[ST]
Load and production forecasts MMXU W, VAr phsA.cVal.mag.f[MX]phsB.cVal.mag.f[MX] phsC.cVal.mag.f[MX] Real and reactive power set points for DGs DRCC OutWSet, OutVarSet Oper.ctlVal.f[CO] AVC relay voltage set point ATCC BndCtr setMag.f[SE]
3.3. Database 28
3.3 Database
Relational database management system(RDBMS) is used to store required data in each SAU for each network layer. The data is related to eld measurements, control command exchanging, network topology and analyzing algorithm execution. The data is exchanged among functions and interfaces implemented in the SAU. Distributing the storage mitigates the burden of data transfer to the CC and allows more frequent data acquisition from the eld. The database architecture is divided into four sections each representing dierent data.[48]
Network Topology model contains static network information; network components, connections, and all related characteristics and parameters. Network topology schema was designed based on CIM and each table is based on one or more CIM classes. Dynamic network data such as real-time and historical measurements, forecast pro-les and control signals are stored in Measure and Command -model. Measure and Command -model was designed based on IEC 61850 data model. It has been ex-panded to include the real-time, historical and forecast values, and also a socket table which stores connection parameters of physical devices.
The Measure and Command model is mapped to the Network Topology model through a simple Bridge model. The bridge model describes a relation between a measurement or a command with their location in the network topology.
The SAU algorithms are run in parallel and interactions between the algorithms are required in order to produce expected results. For this purpose, Management model was built to coordinate the concurrent algorithm execution. Flag signals are used in the model to report events of each algorithm instance. The ag or algorithm state is then read by other algorithms and used to decide if actions are needed. Logs of algorithm states and execution times are also stored in the model.
![Figure 4.1 Operation of independent BOT unit [16]](https://thumb-ap.123doks.com/thumbv2/123dok/2154120.2707572/45.892.376.601.103.571/figure-operation-of-independent-bot-unit.webp)