USE OF SOFTWARE DEVELOPMENT TECHNIQUES: EXPERIENCES OF BRUNEI DARUSSALAM
Md. Mahbubur Rahim, Mohd. Noah A. Rahmanand Afzaal H. Seyal Department of Computing and Information Systems
Institut Teknologi Brunei Simpang 125, Jalan Muara Bandar Seri Begawan 3786
Brunei Darussalam Tel: 673-2-330427 Ext.:145 or 152
Fax: 673-2-330776 email: [email protected]
ABSTRACT
Even though a wide range of techniques are presently available to aid software development process, the actual adoption of these techniques in the industry has not been investigated widely. Existing information systems literature cites a few studies - all of which however report the experiences of US organisations. As such, little is known about how these techniques are actually being used in other parts of the world. Moreover, existing studies did not address the impact of organisational parameters on the adoption of techniques. Against this backdrop, a study was undertaken in Brunei Darussalam in 1996 to analyse the perceptions of senior Information Systems (IS) personnel regarding the use of popularly cited software development techniques within their organisations. Overall, the results indicate a low use of techniques among the Bruneian organisations. The study further confirmed the impact of size and Information Technology (IT) experience of organisations on the use of techniques, while type of organisation appeared to have no influence. The implications of these findings are discussed.
Keywords : Software, software development, techniques
1.0 INTRODUCTION
In the early years of computing, application software was quite small, simple, and often developed using simple technique like flowchart. As the software became large and complex, however, the need to apply more rigorous techniques was strongly felt. In response, a variety of structured techniques were developed during the 1970s and 1980s. Currently, there exists a plethora of techniques to aid software development process [1]. The adoption of these techniques has not however been studied widely. Existing information systems literature cites several studies [2-7] - all of which report the adoption of software development techniques within
address the impact of organisational parameters on the use of techniques. Against this backdrop, a study was initiated during the period of June 1996 to September 1996, to investigate the use of software development techniques within the Bruneian organisations. This paper reports the findings of this study.
Brunei Darussalam is a small sultanate located on the north-west coast of Borneo island with a total population of 281,200 [8]. Its’ nearest neighbours are Malaysia and Singapore. The gross domestic product (GDP) per capita was B$23,865 (US$1 = B$1.4) in 1992 [9]. After receiving independence in 1984, government has placed considerable importance to promote information technology within both public and private sectors. Even an information technology department was established to proliferate IT within the public sector organisations. The IT department allocates requisite financial resources, and assists various public sector departments to develop their own software systems. The quality of these software development projects however does not depend on finance alone, but to a greater extent on how well relevant techniques are applied. Regrettably, no studies were previously undertaken to investigate the use of software development techniques in context of the Bruneian organisations. As a result, information concerning the use of software development techniques is completely unknown in Brunei Darussalam.
The remainder of this paper has been presented in the following sequence: Firstly, prior studies on the use of software development techniques are reviewed. Secondly, the research objectives are stated, and a set of hypotheses is postulated. Thirdly, the research approach is narrated. Next, the findings of the study are presented, and discussed. Lastly, conclusions are drawn.
2.0 PRIOR STUDIES
Systems Analysis Design Methodology (SSADM) and prototyping. The works of Rouse et al. [10], Langle et al. [11], Saarinen [12], Selamat et al. [13] and Hardy et al. [14] fall under this category. These studies were undertaken in Australia, US, Finland, Malaysia and Finland respectively.
The second group of studies [2-7] investigated the popularity and extent in the use of software development techniques within US organisations only. For instance, Guimaraes [2] studied the use of application development techniques in forty three US organisations, and found that slightly over half of the organisations enforced structured design and structured programming as a development standard. While Carey and McCeod [3] identified data flow diagram, and systems flowchart as the most popular techniques among one hundred and twenty one Texas based organisations, while decision tables and Nassi-Schneiderman diagrams were almost never used. They further reported that a good proportion (16%) of the surveyed organisations did not use any techniques. The popularity of data flow diagram, and systems flowchart was further confirmed by Kievit and Martin [4], Palvia and Nosek [5], and Jones and Arnett [6] while examining the use of systems analysis techniques by the American Information Systems (IS) professionals. On the contrary, Doke [7] found structured design more popular than data flow diagram and flowchart.
In summary, the studies as discussed above indicate an overwhelming use of data flow diagram and flowchart among US organisations. These studies further reveal a slow diffusion of software development techniques. This implies that there exists a gap between what is being taught in IS literature, and what happens in real life software development projects. One possible reason is that the adoption of well-publicised software development techniques does not depend on its popularity alone, organisational parameters like size, type and IT experience play important roles in promoting the use of such techniques. Unfortunately, this particular aspect was not addressed by the prior studies.
3.0 RESEARCH OBJECTIVES AND
HYPO-THESES
This study collected and analysed the perceptions of senior IS professionals (preferably Head of IT units/departments) regarding the degree of use of well known software development techniques within their organisations. This study further examined if the use of techniques depends on type, size and IT experience of organisations. It is argued that the use of techniques is likely to vary between the public and private sector organisations. The reason is that organisations in the private sector operate under acute time constraints as to
apply techniques for application development. In contrast, IS employees within the public sector are more likely to use techniques due to the possible existence of government imposed standards. Moreover, IS employees in the public sector organisations tend to experience less constraints (e.g. budget, time, resources etc.) like their counterparts do in the private sector. Furthermore, IS department in the public sector are less likely to emulate the behaviour of their private sector counterparts, because of the traditional public sector echoes of service to the community [15]. These differences lead to the following hypothesis.
H1: There exists a significant difference in the use of techniques between the public and the private sectors.
The use of techniques is also likely to vary depending on the size of organisations. Higher use of techniques is expected in large organisations as compared to that of small and medium organisations. It is because large organisations have more resources in terms of capital, personnel and existing technology [16]. This leads to the second hypothesis:
H2: There exists a significant difference in the use of techniques among small, medium and large organisations.
Lastly, it is argued that in organisations with no or little IT experience, IS people may develop software systems quickly to address the immediate needs of organisations, bypassing well established techniques. Such systems often contain bugs, fail to meet user needs, and are eventually abandoned. Thus, with the lessons learned from the unsuccessful projects, IS people begin to appreciate the need to apply well proven techniques to develop future IS applications. This notion is supported by Jones and Arnett [6]. Thus, the following hypothesis is postulated:
H3: There exists a significant difference in the use of techniques between organisations with more IT experience, and organisations with little IT experiences.
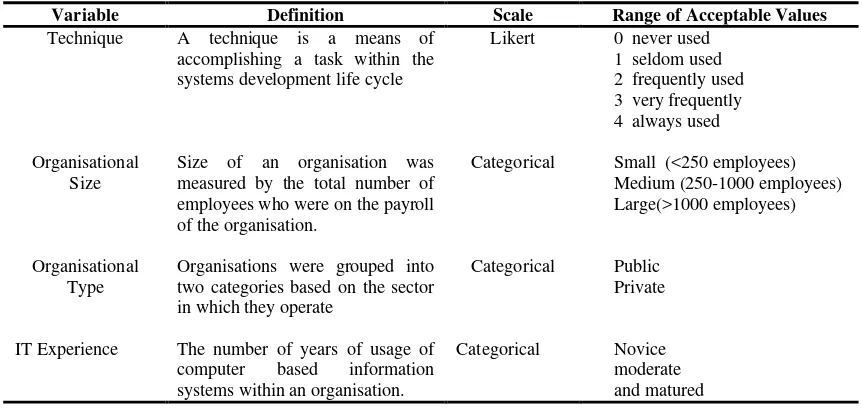
measured by the total number of employees who were on the payroll of the organisation. Three types of organisations were identified: small, medium, and large. An organisation is small when it employs less than 250 personnel, a medium size organisation employs between 250 to less 1000 organisations. While large organisations are those that employ over 1000 employees. Annual turnover, which is often used as a measure of organisational size, was not convenient for the purpose of this study, as it is not appropriate for the Bruneian public sector organisations. Organisations were further divided into three groups depending on their level of IT experience. These include: novice (1 to 5 years), moderate (6 to 10 years), and matured (over 10 years). Lastly, organisations were classified as public and private based on the sector in which they operate. A summary of the research variables (both the dependent and independent variables) are provided in Table 1.
4.0 RESEARCH APPROACH
This study adopted a survey research approach to investigate the use of software development techniques within Bruneian organisations. A questionnaire was developed on the basis of the research variables as introduced in the previous section. The questionnaire was basically structured in nature, and consisted of two parts. Part A captured background information about the participating organisations, while Part B collected information about the extent of use of the prominent software development techniques. These questions were based on Likert scale that varied from 0 to 4. The questionnaire was reviewed by several academics. Later,
the suitability of the questionnaire was examined through pilot testing among selected organisations. Based on their suggestions, several alterations were incorporated. The revised questionnaires were later distributed to sixty one (61) organisations chosen randomly from three published sources: Malay Chamber of Commerce, Chinese Chamber of Commerce and the recent Telephone Directory. The telephone directory was used to obtain a list of public sector organisations. The selected organisations were telephoned prior to mailing the questionnaire in order to identify the appropriate individual to whom the questionnaire should be sent, and to gain a commitment to returning the questionnaire, and therefore encouraging a high response rate. The final questionnaires, with a cover letter assuring the respondent’s confidentiality, were sent to the IS managers/executives of the selected organisations between June 1996 and September 1996. Follow-up telephone calls were made to further boost response rates.
5.0 RESULTS
The results obtained from the survey are presented in terms of tabulations, descriptive analysis, and parametric as well as non-parametric tests. Non-parametric tests like Mann-Whitney and Kruskal-Wallis were chosen because the survey responses did not conform to normal distribution. The non-normality of survey responses was confirmed using Anderson-Darling test [18] and one-way analysis of variance (ANOVA) residual analysis [19]. However, the assumption of normality was compromised while conducting multiple range Duncan test.
Table 1: A summary of research variables
Variable Definition Scale Range of Acceptable Values
Technique A technique is a means of accomplishing a task within the systems development life cycle
Likert 0 never used 1 seldom used 2 frequently used 3 very frequently 4 always used
Organisational Size
Size of an organisation was measured by the total number of employees who were on the payroll of the organisation.
Categorical Small (<250 employees) Medium (250-1000 employees) Large(>1000 employees)
Organisational Type
Organisations were grouped into two categories based on the sector in which they operate
Categorical Public Private
IT Experience The number of years of usage of computer based information systems within an organisation.
Categorical Novice
The findings of the study are presented in two parts. Section 5.1 provides a brief overview of the participating organisations, while Section 5.2 describes the views of the respondents on the current status of the use of software development techniques within their organisations. Section 5.2 further examines the relationships between use of techniques and a set of research variables as introduced in section 3. Two software packages, Minitab Release 10.5, and SPSS 6.5 for windows were used for statistical investigations.
5.1 Organisational Profile
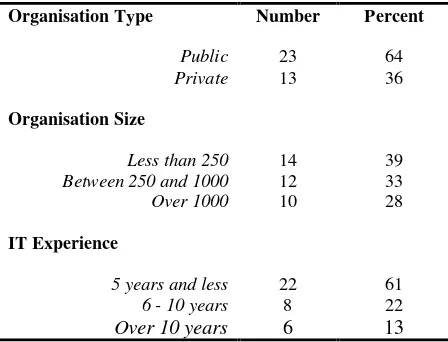
In total, responses from thirty six organisations were received. Thus, the response rate was 60% - which is quite satisfactory for this type of study. The characteristics of the participating organisations are summarised in Table 2. It can be observed that nearly two-thirds (64%) of the organisations were government bodies, while the remaining 36% came from the private sector. The number of employees in the surveyed organisations ranged from less than 100 to over several thousands. These organisations appeared to be evenly distributed based on size. Experience of the participating organisations with information technology (IT) was also identified. Over 60% of the organisations were found to be new in the area of information technology - as they had less than six years of experience. Matured organisations with over ten years of IT use were limited.
Table 2: Organisational characteristics
Organisation Type Number Percent
Public Private
23 13
64 36
Organisation Size
Less than 250 14 39 Between 250 and 1000 12 33 Over 1000 10 28 IT Experience
5 years and less 22 61 6 - 10 years 8 22
Over 10 years 6 13
5.2 Use of Techniques
The use of software development techniques within the participating organisations was expressed in terms of popularity index and degree of use. Popularity index was computed by the number of organisations that used a particular technique divided by the total number of participating organisations (i.e., 36). Such an index indicates how widely a technique is used regardless of the size and type of organisations. In contrast, degree of use indicates how frequently a technique is used within an organisation. It was captured on a Likert scale, and average rating of each technique was calculated. Rankings based on the popularity index and the degree of use was determined, and the differences in rankings were identified. Table 3 illustrates these results. Clearly, system flowchart and data flow diagram emerged as the most popular techniques - as they were practised by nearly two-thirds of the organisations. Despite their popularity, average ratings indicate that these two techniques were not used on a frequent basis. Furthermore, none of the techniques were found to be extensively used as their corresponding average ratings did not exceed three. This implies that overall the extent of use of techniques within the surveyed organisations is low. Furthermore, both popularity index as well as degree of use identified Nassi-Schneiderman diagram, HIPO chart, Action chart, and Warnier-Orr diagram as the least used techniques. The low use of these techniques is surprising in spite of their regular appearances in the text books. Another interesting observation is that techniques that aid systems analysis (e.g. data flow diagram, system flowchart, program flowchart, structured English) were found to be more popular, and were often used as compared to those of design techniques (e.g. structure chart, Action chart, and Warnier-Orr diagram).
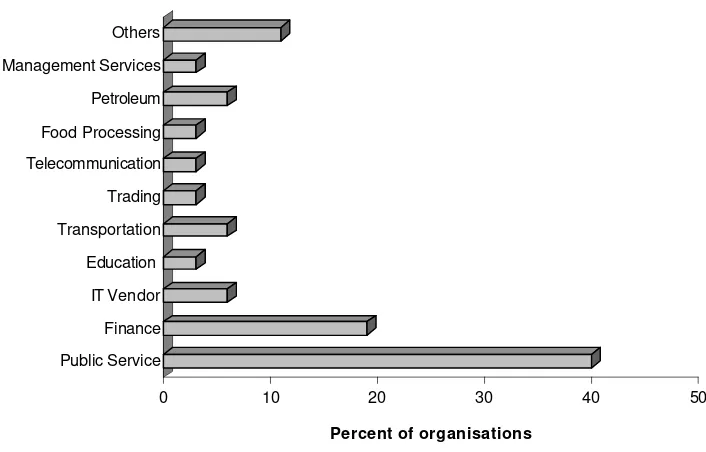
0 10 20 30 40 50
Percent of organisations
Public Service Finance IT Vendor Education Transportation Trading Telecommunication Food Processing Petroleum Management Services Others
Fig. 1: Business profiles of the participating organisations
Table 3: Popularity and degree of use of techniques in organisations
Popularity Degree of Use
Rank
Techniques No. Index Rank Mean
Rating
Rank Difference
Systems flowchart 24 0.67 1 1.416 2 1
Data flow diagram 23 0.64 2 1.472 1 1
Program flowchart 17 0.47 3 1.055 3 0
Structured English 15 0.39 4 0.805 6 2
Data dictionary 13 0.36 4 0.861 4 0
Walkthrough 13 0.36 6 0.722 8 2
Pseudocode 12 0.33 7 0.556 9 2
Structure chart 10 0.28 8 0.750 7 1
Decision table 7 0.19 9 0.861 4 5
Action chart 6 0.17 10 .0305 10 0
Warnier-Orr diagram 4 0.11 11 0.194 11 0
HIPO diagram 3 0.08 12 0.084 12 0
Nassi-Schneiderman diagram
0 0.5 1 1.5 2 2.5 3 3.5 4
Data flow diagram System flowchart Program flowchart
Pseudocode
Structured english
Structure chart
Warnier-Orr Action chart
HIPO
Nassi diagram Decision table Walkthrough Data dictionary
Public Private
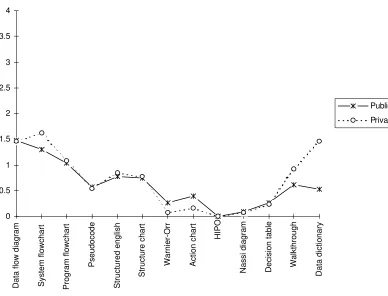
Fig. 2: Average rating of techniques based on organisation type
Table 4: Differences in the use of techniques based on organisation type
Median
Techniques Public
(N=23)
Private (N=13)
W P-value Remarks
Systems flowchart 1 2 400.0 0.392 Nsd
Data flow diagram 1 2 424.0 0.972 Nsd
Program flowchart 0 1 418.5 0.817 Nsd
Structured English 0 0 426.5 0.985 Nsd
Walkthroughs 0 0 409.5 0.551 Nsd
Pseudocode 0 0 433.5 0.767 Nsd
Structure chart 0 0 424.5 0.983 Nsd
Decision table 0 0 433.5 0.720 Nsd
Action chart 0 0 444.0 0.443 Nsd
Warnier-Orr diagram 0 0 434.0 0.629 Nsd
Data dictionary 0 1 377.0 0.065 Nsd
Nassi-Schneiderman diagram 0 0 427.0 0.945 Nsd
Note: Mann-Whitney test for HIPO could not be performed due to presence of identical data. nsd : stands for no significant differences
Statistical analysis like Mann-Whitney tests were performed to ascertain the existence of significant differences in the use of techniques between the public and private sector. The results are shown in Table 4. The p-values of all the techniques were found to be
0 0.5 1 1.5 2 2.5 3 3.5 4
Data flow diagram System flowchart Program flowchart
Pseudocode
Structured english
Structure chart
Warnier-Orr Action chart
HIPO
Nassi diagram Decision table Walkthrough Data dictionary
Small Medium Large
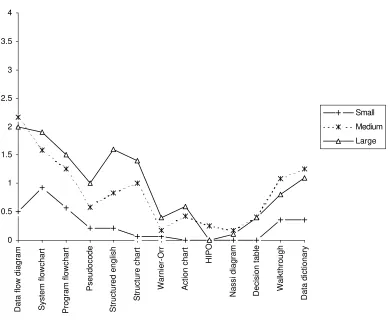
Fig. 3: Average ratings of techniques by organisation size
Table 5: Differences in use of techniques based on organisation size
Average Rank
Techniques Small
(N= 14 )
Medium (N= 12)
Large (N=10)
H Df P-value Remarks
Systems flowchart 14.6 19.7 22.5 3.76 2 .153 nsd.
Data flow diagram 11.4 23.5 22.5 11.51 2 .003 sd.
Program flowchart 14.6 20.0 22.1 3.95 2 .139 nsd
Structured English 13.4 19.5 24.5 8.38 2 .015 sd
Walkthrough 15.6 21.2 19.3 2.6 2 .273 nsd
Pseudocode 15.1 18.7 23.1 4.87 2 .088 nsd
Structure chart 14.0 20.5 22.4 6.49 2 .039 sd
Decision table 15.0 21.0 20.5 5.35 2 .069 nsd
Action chart 16.0 20.3 19.8 3.61 2 .165 nsd
Warnier-Orr diagram 17.7 19.4 18.5 0.54 2 .762 nsd
HIPO diagram 17.0 21.5 17.0 6.36 2 .042 sd
Data dictionary 15.4 21.2 19.5 2.84 2 .242 nsd
Nassi-Schneiderman diagram 17.0 20.0 18.8 2.33 2 .312 nsd
Note : sd :- indicate significant difference, nsd :- no significant difference The use of techniques also varied depending on the size of
organisations. This is reflected in Fig. 3 - which displays the average rating obtained by each technique within small, medium and large organisations. Several important observations can be deduced on the basis of Fig. 3. Firstly, except system flowchart and program flowchart
Table 6: Results revealing group differences
Techniques ANOVA
F
P-value Duncan
statistic
Remarks
Systems flowchart 2.03 .147 nsd No significant difference
Data flow diagram 7.63 .002 (1,3), and
(1,2)
Differences between small and large, as well as between small and medium organisations
Program flowchart 1.88 .169 nsd No significant difference
Structured English 5.08 0.12 (1,3) Differences between small and large
organisations
Walkthrough 1.45 .249 nsd No significant difference
Pseudocode 2.04 .146 nsd No significant difference
Structure chart 3.53 .041 (1,3) Differences between small and large
organisations
Decision table 2.54 .094 nsd No significant difference
Action chart 1.64 .209 nsd No significant difference
Warnier-Orr diagram .62 .542 nsd No significant difference
HIPO diagram 3.67 .036 (1,2) and
(2,3)
Differences between small and medium, as well as between medium and large organisations Nassi-Schneiderman
diagram
1.18 .32 No significant difference
Note : nsd :- no significant difference
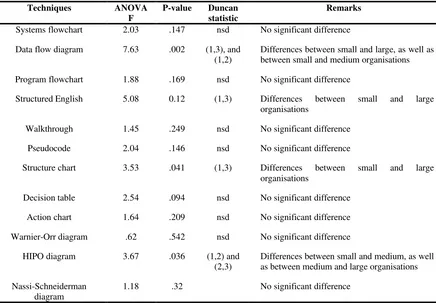
In order to identify which among the three groups of organisations actually differ, further statistical analysis like multiple range Duncan test was carried out by assuming normal distribution of the population, even though this assumption was found to be violated. The results of the Duncan test are shown in Table 6. It can be observed that the use of data flow diagram varied between small and large organisations as well as between small and medium organisations. No significant differences were observed between medium and large organisations. For structured English and structure chart, differences were noted only between small and large organisations. While for HIPO diagram, significant differences were found between small and medium organisations, as well as between medium and large organisations.
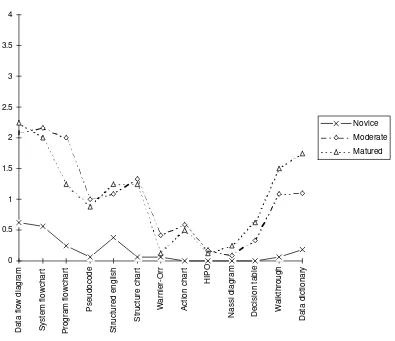
Lastly, the use of techniques was found to vary on the basis of the IT experience of organisations. This is shown in Fig. 4. The overall low use of techniques in novice organisations is clearly established. However, quite a number of techniques like data flow diagram, system flowchart, data dictionary, and walkthrough were used more often in medium and large organisations. On the other hand, design techniques like HIPO, Action chart, Nassi-Schneiderman diagram were the least used by all groups of organisations.
0 0.5 1 1.5 2 2.5 3 3.5 4
Data flow diagram System flowchart Program flowchart
Pseudocode
Structured english
Structure chart
Warnier-Orr Action chart
HIPO
Nassi diagram Decision table Walkthrough Data dictionary
Novice Moderate Matured
Fig. 4: Average ratings of techniques by IT experience
Table 7: Differences in use of techniques based on IT experience
Average Rank
Techniques Novice
(N= 16 )
Moderate (N= 12)
Matured (N=8)
H Df
P-value
Remarks
Systems flowchart 11.5 24.4 23.8 13.85 2 .001 sd
Data flow diagram 12.4 22.4 24.7 10.63 2 .005 sd
Program flowchart 12.1 25.7 20.6 13.76 2 .001 sd
Structured English 15.1 20.5 22.3 3.92 2 .142 nsd
Walkthrough 12.8 21.3 25.6 12.48 2 .002 sd
Pseudocode 13.5 23.4 21.2 9.71 2 .008 sd
Structure chart 13.9 22.2 22.1 8.26 2 .016 sd
Decision table 15.0 20.7 22.2 6.92 2 .032 sd
Action chart 16.0 20.5 20.5 4.49 2 .106 nsd
Warnier-Orr diagram 17.6 19.6 18.7 0.83 2 .659 nsd
HIPO diagram 17.0 20.0 19.3 2.65 2 .266 nsd
Data dictionary 13.9 21.9 22.6 7.50 2 .024 sd
Nassi-Schneiderman diagram 17.0 18.5 21.5 4.24 2 .120 nsd
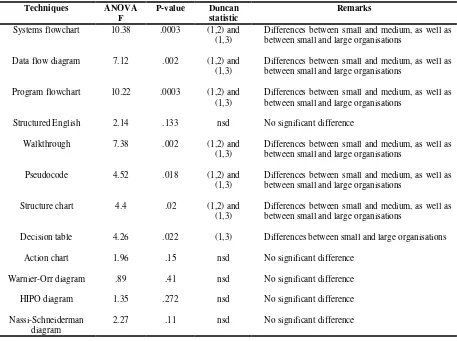
Note: sd:- indicate significant difference, nsd :- no significant difference Once again, Duncan test was carried out by assuming
normal distribution of the population, in order to identify which among the three groups of organisations actually differ. The results are shown in Table 8. A number of
difference between medium and large organisations. While no significant differences were found observed in any groups for techniques like structured English, Action chart, Warnier-Orr diagram, HIPO diagram, and Nassi-Schneiderman diagram.
6.0 DISCUSSIONS
The results of this study indicate that overall the use of popularly cited software development techniques within the responding organisations is low. Although this is disappointing, but is not entirely unexpected. It is because over 60% of the surveyed organisations were new in the area of information technology. The use of techniques is however likely to grow as these organisations become matured with IT. This notion is supported by the fact that the use of techniques was found to be greater in matured organisations.
Type of organisation appeared to have no impact on the use of techniques. Thus, both the public and private
sector organisations are at the same level with regards to the use of techniques. However, organisation size was found to be an important factor in the use of techniques. Small organisations were found to be the least users of software development techniques. This is expected because small organisations lack adequate resources to implement techniques. On the contrary, except data dictionary and walkthrough, all other techniques were used extensively in the large organisations. Surprisingly, walkthrough and data dictionary were used more in medium organisations as compared to those of large organisations. Statistically, however, only four techniques such as data flow diagram, structured English, structure chart and HIPO were found to vary significantly depending on the size of organisations. Likewise, use of techniques varied depending on IT experience of organisations. In summary, the study supports the influence of organisation size and IT experience, while fails to provide any evidence on the impact of organisation type. In other words, hypotheses H2 and H3 were partially supported, while H1 was rejected.
Table 8: Results revealing group differences
Techniques ANOVA
F
P-value Duncan
statistic
Remarks
Systems flowchart 10.38 .0003 (1,2) and
(1,3)
Differences between small and medium, as well as between small and large organisations
Data flow diagram 7.12 .002 (1,2) and
(1,3)
Differences between small and medium, as well as between small and large organisations
Program flowchart 10.22 .0003 (1,2) and
(1,3)
Differences between small and medium, as well as between small and large organisations
Structured English 2.14 .133 nsd No significant difference
Walkthrough 7.38 .002 (1,2) and
(1,3)
Differences between small and medium, as well as between small and large organisations
Pseudocode 4.52 .018 (1,2) and
(1,3)
Differences between small and medium, as well as between small and large organisations
Structure chart 4.4 .02 (1,2) and
(1,3)
Differences between small and medium, as well as between small and large organisations
Decision table 4.26 .022 (1,3) Differences between small and large organisations
Action chart 1.96 .15 nsd No significant difference
Warnier-Orr diagram .89 .41 nsd No significant difference
HIPO diagram 1.35 .272 nsd No significant difference
Nassi-Schneiderman diagram
2.27 .11 nsd No significant difference
Table 9: Comparison of the most popular techniques
Country
System flowchart (%)
data flow diagram
(%)
Brunei 67 64
US
Carey and McCleod (1988) Doke (1989) Palvia and Nosek (1993)
75
57 70.8
79
57
53.9
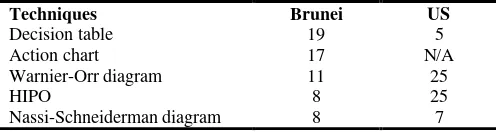
Table 10: Comparison of the least used techniques
Techniques Brunei US
Decision table 19 5
Action chart 17 N/A
Warnier-Orr diagram 11 25
HIPO 8 25
Nassi-Schneiderman diagram 8 7
Note : N/A stands for not available This study further found systems flowchart and data flow diagram as the most popularly used techniques within the surveyed organisations. Each of them was used by nearly two-thirds of the participating organisations. As shown in Table 9, this finding is in line with US studies. For instance, several studies [3, 5, 7] identified data flow diagram and system flowchart as the most widely used techniques in US.
A comparison was further made between Brunei and US regarding the least used techniques. This is highlighted in Table 10. The use and Nassi-Schneiderman diagrams appear to be very low in both US and Brunei. Warnier-Orr diagram and HIPO were more widely used in US as compared to those of Brunei. In contrast, the use of decision table is much higher in Brunei.
7.0 CONCLUSIONS
This study has presented an empirical evaluation of the use of popular software development techniques within thirty six Bruneian organisations. These organisations represent a wide spectrum of business types including education, government agencies, trading, petroleum and computer vendors among others. The size as well as the IT experience of these organisations varied widely. Several important findings were deduced from the results of this study, and were discussed in the earlier section. The main implication of this study is that the overall use
This study found data flow diagram and systems flow chart as the most popular techniques. This finding is similar to those of US studies. Surprisingly, other well known techniques like Action chart, Warnier-Orr diagram were least used despite their publication in the IS literature. This study further confirmed the influence of size and IT experience of organisations on the use of software development techniques, but did not support the impact of organisation type. These findings carry implications to the Bruneian IS academics who could redesign their IS course contents based on the results of the study. The findings are important to the IS researchers as well, who could compare the results of this study with related research studies conducted in other parts of the world.
Lastly, this study solicited the perceptions of senior IS officers who were in charge of IS departments or units within the surveyed organisations. Their opinions could differ considerably from those IS personnel responsible for software development. It is because software developers are more in touch with their work environment than their managers. Thus, further studies should capture the views of individual IS personnel, and should ascertain the existence of any differences between the opinions of IS managers and software developers.
8.0 REFERENCES
[1] D. Batra and G. M. Marakas, “Conceptual data modelling in theory and practice”. European Journal of Information Systems, Vol. 4, No. 3, August 1995, pp. 185-193.
[2] T. Guimaraes, “A study of application program development techniques?”, Communications of the ACM, Vol. 28, 1985, pp. 494-499.
[3] J. M. Carey and R. McCleod, “Use of systems development methodology and tools”, Journal of Systems Management, March 1988, pp. 30-35.
[4] K. Kievit, K. and M. Martin, “Systems analysis tools - Who’s using them?”, Journal of Systems Management, Vol. 40, No. 7, July 1989, pp. 26-30.
[5] P. Palvia and J. T. Nosek, “A field examination of system life cycle techniques and methodologies?”, Information & Management, Vol. 25, 1993, pp. 73-84.
[6] M. C. Jones and K. P. Arnett, “Current practices in management information systems”, Information and Management, Vol. 24, 1993, pp. 61-69.
[7] E. R. Doke, “Application development productivity tools: A survey of importance and popularity”, Journal of Information Systems Management, Winter 1989, pp. 37-43.
[8] Country profile Malaysia and Brunei 1994-95, The Economist Intelligence Unit, 1995.
[9] Brunei Darussalam Statistical Yearbook, Statistic Review Economy Planning Unit, Ministry of Finance, 1993.
[10] A. Rouse, D. Watson, A. Gilbert and R. Dilnutt, (1995) “Systems development practices: A comparison of the experience of Australians and United States”, In Proc. of 1995 Pan Pacific Conference on Information Systems, Singapore, June 29-July 2 1995, pp. 46-56.
[11] G. B. Langle, R. L. Leitheiser and J. D. Naumann, “A survey of applications systems: prototyping in industry”, Information and Management, Vol. 7, 1984, pp. 273-284.
[12] T. Saarinen, “System development methodology and project success”, Information & Management, Vol. 19, 1990, pp. 183-193.
[13] M. H. Selamat, M. M. Rahim, A. T. Othman, “Managing Implementation of CASE Tools”, In Proceedings of the Third Conference on IT and its Applications 94, Leicester, UK, April 2-3 1994, pp. 47-55.
[14] C. J. Hardy, J. B. Thompson and H. M. Edwards, “The use, limitations and customization of structured systems development methods on the United Kingdom”, Information and Software Technology, 1995, pp. 467-477.
[15] W. L. Currie, “Organisational structure and the use of information technology: preliminary findings of a survey in the private and public sector”, International Journal of Information Management, Vol. 16, No. 1, 1995, pp. 51-64.
[16] J. E. Cline, M. A. Ketabchi, J. Link, P. Palvia and T. W. Olle, “IRM and the systems life cycle”, Database Engineering, June 1986, pp. 43-48.
[17] M. Berenson and L. David, Basic Business Statistic, Prentice Hall Inc., U.S.A., 1986.
[18] O. A. Arnold, Probability, Statistics and Queuing Theory with Computer Science Applications, Academic Press, Second edition, USA, 1990.
[19] M. William and T. Sincich, Statistics for Engineering and the Sciences, Fourth edition, Prentice-Hall International, Inc. USA, 1995.
ACKNOWLEDGEMENTS
BIOGRAPHY
Md. Mahbubur Rahim, received M.S. in Computer Science from University Pertanian Malaysia in 1992. Currently, he is a Lecturer at Department of Computing and Information Systems, Institut Teknologi Brunei. His research interest includes CASE, and software prototyping. His research papers have appeared in several international journals including IT and People, Information and Software Technology, International Journal of Information Management, Asia-Pacific Journal of Information Management. He is the recipient of the best paper award in IT conference in UK. Currently, he is a member of the Australian Computer Society. He can be reached via e-mail [email protected].
Mohd Noah A. Rahman obtained his MS Computer & Information Science from University of New Haven, USA in 1987. Currently, he is a lecturer at Dept. Computing and Information Systems, Institut Teknologi Brunei. His research interest include database systems, systems methodology and techniques, software piracy and computer skills. He has published a number of papers related to these areas. He can be reached via e-mail [email protected].